10-K: Annual report [Section 13 and 15(d), not S-K Item 405]
Published on February 11, 2026
UNITED STATES
SECURITIES AND EXCHANGE COMMISSION
WASHINGTON, D.C. 20549
FORM 10-K
THE SECURITIES EXCHANGE ACT OF 1934
For the fiscal year ended December 31 , 2025
OR
THE SECURITIES EXCHANGE ACT OF 1934
For the transition period from to
Commission File No. 001-14428
(Exact Name Of Registrant As Specified In Its Charter)
| (State or Other Jurisdiction of Incorporation or Organization) | (I.R.S. Employer Identification Number) | ||||
(Address of Principal Executive Offices) (Zip Code)
(441 ) 295-4513
(Registrant’s telephone number, including area code)
Securities registered pursuant to Section 12(b) of the Act:
| Title of each class | Trading symbol(s) | Name of each exchange on which registered | ||||||
Securities registered pursuant to Section 12(g) of the Act: None
Indicate by check mark if the registrant is a well-known seasoned issuer, as defined in Rule 405 of the Act. Yes x No o
Indicate by check mark if the registrant is not required to file reports pursuant to Section 13 or Section 15(d) of the Act. Yes o No x
Indicate by check mark whether the registrant (1) has filed all reports required to be filed by Section 13 or 15(d) of the Securities Exchange Act of 1934 during the preceding 12 months (or for such shorter period that the registrant was required to file such reports), and (2) has been subject to such filing requirements for the past 90 days. Yes x No o
Indicate by check mark whether the registrant has submitted electronically every Interactive Data File required to be submitted pursuant to Rule 405 of Regulation S-T (§232.405 of this chapter) during the preceding 12 months (or for such shorter period that the registrant was required to submit such files). Yes x No o
Indicate by check mark whether the registrant is a large accelerated filer, an accelerated filer, a non-accelerated filer, a smaller reporting company, or an emerging growth company. See the definitions of “large accelerated filer,” “accelerated filer,” “smaller reporting company,” and “emerging growth company” in Rule 12b-2 of the Act. Large accelerated filer x, Accelerated filer o, Non-accelerated filer o, Smaller reporting company ☐ , Emerging growth company ☐
If an emerging growth company, indicate by check mark if the registrant has elected not to use the extended transition period for complying with any new or revised financial accounting standards provided pursuant to Section 13(a) of the Exchange Act. o
Indicate by check mark whether the registrant has filed a report on and attestation to its management’s assessment of the effectiveness of its internal control over financial reporting under Section 404(b) of the Sarbanes-Oxley Act (15 U.S.C. 7262(b)) by the registered public accounting firm that prepared or issued its audit report. ☒
If securities are registered pursuant to Section 12(b) of the Act, indicate by check mark whether the financial statements of the registrant included in the filing reflect the correction of an error to previously issued financial statements. o
Indicate by check mark whether any of those error corrections are restatements that required a recovery analysis of incentive-based compensation received by any of the registrant’s executive officers during the relevant recovery period pursuant to §240.10D-1(b). o
Indicate by check mark whether the registrant is a shell company (as defined in Rule 12b-2 of the Act). Yes ☐ No x
The aggregate market value of Common Shares held by nonaffiliates of the registrant at June 30, 2025 was $11.3 billion based on the closing sale price of the Common Shares on the New York Stock Exchange on that date.
The number of Common Shares, par value US $1.00 per share, outstanding at February 6, 2026 was 43,488,908 .
DOCUMENTS INCORPORATED BY REFERENCE
Portions of the registrant’s definitive proxy statement for the 2026 Annual General Meeting of Shareholders are incorporated by reference into Part III of this report.
RENAISSANCERE HOLDINGS LTD.
TABLE OF CONTENTS
| Page | ||||||||
| ITEM 1. | ||||||||
| ITEM 1A. | ||||||||
| ITEM 1B. | ||||||||
ITEM 1C. | ||||||||
| ITEM 2. | ||||||||
| ITEM 3. | ||||||||
| ITEM 4. | ||||||||
| ITEM 5. | ||||||||
| ITEM 6. | ||||||||
| ITEM 7. | ||||||||
| ITEM 7A. | ||||||||
| ITEM 8. | ||||||||
| ITEM 9. | ||||||||
| ITEM 9A. | ||||||||
| ITEM 9B. | ||||||||
| ITEM 9C. | ||||||||
| ITEM 10. | ||||||||
| ITEM 11. | ||||||||
| ITEM 12. | ||||||||
| ITEM 13. | ||||||||
| ITEM 14. | ||||||||
| ITEM 15. | ||||||||
| ITEM 16. | ||||||||
NOTE ON FORWARD-LOOKING STATEMENTS
This Annual Report on Form 10-K for the year ended December 31, 2025, of RenaissanceRe Holdings Ltd. contains forward-looking statements within the meaning of Section 27A of the Securities Act and Section 21E of the Exchange Act. Forward-looking statements are necessarily based on estimates and assumptions that are inherently subject to significant business, economic and competitive uncertainties and contingencies, many of which, with respect to future business decisions, are subject to change. These uncertainties and contingencies can affect actual results and could cause actual results to differ materially from those expressed in any forward-looking statements made by, or on behalf of, us. In particular, statements using words such as “may,” “should,” “estimate,” “expect,” “anticipate,” “intend,” “believe,” “predict,” “potential,” or words of similar import generally involve forward-looking statements. For example, we may include certain forward-looking statements in “Management’s Discussion and Analysis of Financial Condition and Results of Operations” with regard to trends in results, operations, underwriting performance, our segments or business units, reserves, market or economic conditions, investment results, margins, fees, risk management, and the consequences of our strategic decisions. This Form 10-K also contains forward-looking statements with respect to our business and industry, such as those relating to our strategy and management objectives, plans and expectations regarding our response and ability to adapt to changing economic conditions, market standing and product volumes, estimates of net negative impact and insured losses from loss events, competition in our industry, and government initiatives and regulatory matters affecting the (re)insurance industries.
The inclusion of forward-looking statements in this report should not be considered as a representation by us or any other person that our current objectives or plans will be achieved. Numerous factors could cause our actual results to differ materially from those addressed by the forward-looking statements, including the following:
•our exposure to natural and non-natural catastrophic events and circumstances and the variance they may cause in our financial results;
•the effect of climate change on our business, including the trend towards increasingly frequent and severe climate events;
•the effectiveness of our claims and claim expense reserving process;
•the effect of emerging claims and coverage issues;
•the performance of our investment portfolio and financial market volatility;
•the effects of inflation;
•our exposure to ceding companies and delegated authority counterparties and the risks they underwrite;
•our ability to maintain our financial strength ratings;
•our reliance on a small number of brokers;
•the highly competitive nature of our industry;
•the historically cyclical nature of the (re)insurance industries;
•collection on claimed retrocessional coverage and new retrocessional reinsurance being available;
•our ability to attract and retain key executives and employees;
•our ability to successfully implement our business, strategies and initiatives;
•our exposure to credit loss from counterparties;
•our need to make many estimates and judgments in the preparation of our financial statements;
•our exposure to risks associated with our management of capital on behalf of investors;
•changes to the accounting rules and regulatory systems applicable to our business, including changes in Bermuda and U.S. laws or regulations;
•the effect of current or future macroeconomic or geopolitical events or trends, including the ongoing conflicts globally;
•other political, regulatory or industry initiatives adversely impacting us;
•the impact of cybersecurity risks, including technology breaches or failure;
•our ability to comply with covenants in our debt agreements;
•the effect of adverse economic factors, including changes in the prevailing interest rates;
•the effects of new or possible future tax actions or reform legislation and regulations in the jurisdictions in which we operate;
•our ability to determine any impairments taken on our investments;
•our ability to raise capital on acceptable terms;
1
•our ability to comply with applicable sanctions and foreign corrupt practices laws; and
•our dependence on capital distributions from our operating subsidiaries.
As a consequence, our future financial condition and results may differ from those expressed in any forward-looking statements made by or on behalf of us. The factors listed above, as well as those discussed in more detail in “Part I, Item 1A. Risk Factors,” in this Form 10-K, should not be construed as exhaustive. Forward-looking statements speak only as of the date they are made, and we undertake no obligation to revise or update forward-looking statements to reflect new information, events or circumstances after the date hereof or to reflect the occurrence of unanticipated events.
2
PART I
ITEM 1. BUSINESS
In this Form 10-K, references to “RenaissanceRe” refer to RenaissanceRe Holdings Ltd. (the parent company) and references to “we,” “us,” “our” and the “Company” refer to RenaissanceRe Holdings Ltd. together with its subsidiaries, unless the context requires otherwise.
Defined terms used throughout this Form 10-K are included in the “Glossary of Defined Terms” at the end of “Part I, Item 1. Business” of this Form 10-K. We have also included a “Glossary of Selected Insurance and Reinsurance Terms” at the end of “Part I, Item 1. Business” of this Form 10-K.
All dollar amounts referred to in this Form 10-K are in U.S. dollars unless otherwise indicated.
Due to rounding, numbers presented in the tables included in this Form 10-K may not add up precisely to the totals provided.
OVERVIEW
RenaissanceRe is a global provider of reinsurance and insurance. We provide property, casualty and specialty reinsurance and certain insurance solutions to customers, principally through intermediaries. Established in 1993, we have offices in Bermuda, Australia, Canada, Ireland, Singapore, Switzerland, the U.K., and the U.S.
Our mission is to match desirable risk with efficient capital, and our vision is to be the best underwriter. We believe that this will allow us to produce superior returns for our shareholders over the long term, and enable our purpose to protect communities and enable prosperity. We seek to accomplish these goals by delivering a value proposition composed of leadership, expertise and partnership, through our operation as an integrated system of three competitive advantages: superior risk selection, superior customer relationships and superior capital management.
Our current business strategy focuses predominantly on writing reinsurance. We apply our reinsurance lens of approaching risks as a portfolio to the insurance business that we write, primarily though delegated authority arrangements. Through our Capital Partners unit we create and manage innovative joint ventures and managed funds, which provide access to the portfolios our underwriters build. Additionally, we pursue several other opportunities, such as executing customized reinsurance transactions to assume or cede risk, and managing certain strategic investments. We continually explore appropriate and efficient ways to address the risk management needs of our clients and the impact of various regulatory and legislative changes on our operations. From time to time, we consider diversification into new opportunities, either through organic growth, the formation of new joint ventures or managed funds, or the acquisition of, or investment in, other companies or books of business of other companies.
Our business consists of the following reportable segments: (1) Property, which is comprised of catastrophe and other property (re)insurance, and (2) Casualty and Specialty, which is comprised of general casualty, professional liability, credit and other specialty (re)insurance. The underwriting results of our consolidated operating subsidiaries and underwriting platforms are included in our Property and Casualty and Specialty segment results as appropriate.
We have three principal drivers of profit that generate diversified earnings streams for our business: underwriting income, fee income, and investment income. Underwriting income is the income that we earn from our core underwriting business. By matching desirable risk with efficient capital and accepting the volatility that this business brings, we believe that we can generate superior returns over the long-term. Fee income is the income that we earn primarily from managing third-party capital in our Capital Partners unit and is composed of management fee income and performance fee income. Investment income is income derived from the investment portfolio that we maintain to support our business. We take a disciplined approach in building a relatively conservative, well-structured investment portfolio, with a focus on fixed income investments. Compared to underwriting income, we view fee income, especially management fee income, and investment income, as being relatively less volatile and as diversifying sources of income.
3
We principally measure our financial success through long-term growth in tangible book value per common share plus the change in accumulated dividends. We believe this metric is the most appropriate measure of our financial performance, and in respect of which we believe we have delivered superior performance over time.
CORPORATE STRATEGY
Our mission is to match desirable risk with efficient capital, and our vision is to be the best underwriter. We believe that this will allow us to produce superior returns for our shareholders over the long term, and fulfill our purpose to protect communities and enable prosperity. Our strategy for achieving these objectives, which is supported by our core values, our principles and our culture, is to operate an integrated system of three competitive advantages: superior customer relationships, superior risk selection and superior capital management. We believe all three competitive advantages are required to achieve our objectives, and we aim to seamlessly coordinate the delivery of these competitive advantages for the benefit of our shareholders, ceding insurers, brokers, investors in our joint ventures and managed funds, and other stakeholders.
Superior Customer Relationships. Our value proposition to customers is underpinned by leadership, expertise, and partnership. We seek to offer stable, predictable and consistent risk-based pricing and prompt turnaround on claims. We believe our modeling and technical expertise, our broad risk appetite, and our track record of keeping our promises have made us a provider of first choice in many lines of business to our customers worldwide. We aim to be a trusted long-term partner to our customers for assessing and managing risk and delivering responsive solutions.
Superior Risk Selection. We pursue a disciplined approach to underwriting and seek to select those risks that we believe will produce a portfolio with an attractive return, subject to prudent risk constraints. We develop a view of risk for each risk submission we receive utilizing a combination of proprietary data sets, sophisticated risk modelling capabilities, market leading risk selection tools, such as our REMS© exposure management system, and the expertise and judgment of our experienced underwriters. We manage our portfolio of risks dynamically, both within sub-portfolios and across the Company.
Superior Capital Management. We aim to match the portfolio of risk that we build with the most appropriate form(s) of capital. As a result of our strategy and the diversified nature of our business, we believe that we are uniquely positioned to utilize various forms of capital depending on the situation. We access capital through joint ventures, managed funds, ceded retrocession, debt and equity markets, and other structures to support underwriting opportunities, and we prudently manage our capital position, which may include returning capital when we believe it would be beneficial. When possible, our preference is to deploy any excess capital into profitable business opportunities before returning excess capital to shareholders. In our Capital Partners unit, we aim to leverage our access to business and our underwriting capabilities on an efficient capital base, develop fee income, generate performance fees, diversify our portfolio, and provide attractive risk-adjusted returns to our capital providers.
We believe we are well positioned to fulfill our objectives by virtue of the experience and skill of our management team, our integrated and flexible underwriting and operating platform, our significant financial strength, our strong relationships with brokers, customers and capital partners, our commitment to superior service and our proprietary modeling technology. By consistently applying each of our three competitive advantages we can offer specialized services and products at times and in markets where capacity and alternatives may be limited.
UNDERWRITING
Underwriting Income
Our first driver of profit is underwriting income, which we earn on our core underwriting business. Our underwriting results are reflected in our reportable segments: (1) Property, which is comprised of catastrophe and other property (re)insurance written on behalf of our consolidated operating subsidiaries, joint ventures and managed funds; and (2) Casualty and Specialty, which is comprised of general casualty, professional liability, credit and other specialty (re)insurance written on behalf of our consolidated operating subsidiaries, joint ventures and managed funds. Our underwriting results reflect the full value of the
4
business written on behalf of our consolidated operating subsidiaries, joint ventures and managed funds, before we reflect the interests of third-party investors in these entities that are not retained by us.
The following table shows gross premiums written by segment. Operating results relating to our segments are included in “Part II, Item 7. Management’s Discussion and Analysis of Financial Condition and Results of Operations.”
| Year ended December 31, | 2025 | 2024 | 2023 | ||||||||||||||||||||||||||||||||||||||
| (in thousands, except percentages) | Gross Premiums Written | Percentage of Gross Premiums Written | Gross Premiums Written | Percentage of Gross Premiums Written | Gross Premiums Written | Percentage of Gross Premiums Written | |||||||||||||||||||||||||||||||||||
| Property | $ | 4,942,141 | 42.1 | % | $ | 4,823,731 | 41.1 | % | $ | 3,562,414 | 40.2 | % | |||||||||||||||||||||||||||||
| Casualty and Specialty | 6,796,279 | 57.9 | % | 6,909,335 | 58.9 | % | 5,299,952 | 59.8 | % | ||||||||||||||||||||||||||||||||
| Total gross premiums written | $ | 11,738,420 | 100.0 | % | $ | 11,733,066 | 100.0 | % | $ | 8,862,366 | 100.0 | % | |||||||||||||||||||||||||||||
Across our segments, we write proportional business, excess of loss business, and business through delegated authority arrangements. The business we write through delegated authority arrangements is primarily insurance business. We view our insurance business through a reinsurance lens, with a focus on approaching it as a portfolio of risks. Our relative mix of business between proportional business and excess of loss business has fluctuated in the past and has the potential to change in the future. Proportional and delegated authority business typically have relatively higher premiums per unit of expected underwriting income as well as a higher acquisition expense ratio and combined ratio than traditional excess of loss reinsurance, as these coverages tend to be exposed to relatively more attritional, and frequent, losses while being subject to less expected severity.
As a result of our three competitive advantages, superior risk selection, superior customer relationships and superior capital management, combined with our financial strength, we are able to offer significant capacity across both our Property and Casualty and Specialty segments.
The following table shows gross premiums written by type of risk in each of our segments:
| Year ended December 31, 2025 | Property | Casualty and Specialty | Total | ||||||||||||||||||||
| (in thousands) | |||||||||||||||||||||||
| Excess of loss | $ | 3,616,178 | $ | 1,129,139 | $ | 4,745,317 | |||||||||||||||||
| Proportional | 828,570 | 5,303,495 | 6,132,065 | ||||||||||||||||||||
| Delegated authority | 497,393 | 363,645 | 861,038 | ||||||||||||||||||||
| Total gross premiums written | $ | 4,942,141 | $ | 6,796,279 | $ | 11,738,420 | |||||||||||||||||
Year ended December 31, 2024 | |||||||||||||||||||||||
| (in thousands) | |||||||||||||||||||||||
| Excess of loss | $ | 3,364,490 | $ | 1,134,177 | $ | 4,498,667 | |||||||||||||||||
| Proportional | 821,955 | 5,308,224 | 6,130,179 | ||||||||||||||||||||
| Delegated authority | 637,286 | 466,934 | 1,104,220 | ||||||||||||||||||||
| Total gross premiums written | $ | 4,823,731 | $ | 6,909,335 | $ | 11,733,066 | |||||||||||||||||
Year ended December 31, 2023 | |||||||||||||||||||||||
| (in thousands) | |||||||||||||||||||||||
| Excess of loss | $ | 2,468,566 | $ | 857,957 | $ | 3,326,523 | |||||||||||||||||
| Proportional | 667,074 | 4,102,088 | 4,769,162 | ||||||||||||||||||||
| Delegated authority | 426,774 | 339,907 | 766,681 | ||||||||||||||||||||
| Total gross premiums written | $ | 3,562,414 | $ | 5,299,952 | $ | 8,862,366 | |||||||||||||||||
5
Property Segment
Our Property segment includes our catastrophe class of business, principally comprised of excess of loss reinsurance and excess of loss retrocessional reinsurance, which insures insurance and reinsurance companies against natural and man-made catastrophes. It also includes our other property class of business, primarily comprised of proportional reinsurance, property per risk, property (re)insurance, delegated authority arrangements and regional U.S. multi-line reinsurance, which have exposure to natural and man-made catastrophes.
The following table shows gross premiums written in our Property segment allocated by class of business:
| Year ended December 31, | 2025 | 2024 | 2023 | ||||||||||||||||||||||||||||||||||||||
| (in thousands, except percentages) | Gross Premiums Written | Percentage of Gross Premiums Written | Gross Premiums Written | Percentage of Gross Premiums Written | Gross Premiums Written | Percentage of Gross Premiums Written | |||||||||||||||||||||||||||||||||||
| Catastrophe | $ | 3,318,186 | 67.1 | % | $ | 2,996,890 | 62.1 | % | $ | 2,146,323 | 60.2 | % | |||||||||||||||||||||||||||||
| Other property | 1,623,955 | 32.9 | % | 1,826,841 | 37.9 | % | 1,416,091 | 39.8 | % | ||||||||||||||||||||||||||||||||
Property segment gross premiums written | $ | 4,942,141 | 100.0 | % | $ | 4,823,731 | 100.0 | % | $ | 3,562,414 | 100.0 | % | |||||||||||||||||||||||||||||
We write catastrophe reinsurance and insurance coverage protecting against natural and man-made catastrophes such as earthquakes, hurricanes, typhoons and tsunamis, winter storms, freezes, floods, fires, windstorms, tornadoes, explosions and acts of terrorism. We offer this coverage to insurance companies and other reinsurers primarily on an excess of loss basis. This means we begin paying when our customers’ claims from a catastrophe exceed a certain retained amount. We also offer proportional coverages and other structures on a catastrophe-exposed basis.
Our excess of loss property contracts generally cover natural perils, and our predominant exposure under such coverage is to property damage. However, other risks, including business interruption and other non-property losses, may also be covered under our property reinsurance contracts when arising from a covered peril.
We offer our coverages on a worldwide basis. Because of the wide range of possible catastrophic events to which we are exposed, including the size of such events and the potential for multiple events to occur in the same time period, our property business is volatile and our financial condition and results of operations reflect this volatility. To moderate the volatility of our risk portfolio, we may increase or decrease our presence in the property business based on market conditions and our assessment of risk-adjusted pricing adequacy. We frequently purchase reinsurance or other protection for our own account for a number of reasons, including to optimize the expected outcome of our underwriting portfolio, to manage capital requirements for regulated entities and to reduce the financial impact that a large catastrophe or a series of catastrophes could have on our results.
Casualty and Specialty Segment
We write casualty and specialty reinsurance and insurance across a broad range of classes of business, including general casualty, professional liability, credit and other specialty lines. This business is predominantly reinsurance, although we also write insurance business, primarily through delegated authority arrangements.
6
The following table shows gross premiums written in our Casualty and Specialty segment aggregated by class of business:
| Year ended December 31, | 2025 | 2024 | 2023 | ||||||||||||||||||||||||||||||||||||||
| (in thousands, except percentages) | Gross Premiums Written | Percentage of Gross Premiums Written | Gross Premiums Written | Percentage of Gross Premiums Written | Gross Premiums Written | Percentage of Gross Premiums Written | |||||||||||||||||||||||||||||||||||
General casualty (1) | $ | 2,145,495 | 31.6 | % | $ | 2,280,818 | 33.0 | % | $ | 1,730,102 | 32.6 | % | |||||||||||||||||||||||||||||
Professional liability (2) | 1,076,897 | 15.8 | % | 1,212,134 | 17.5 | % | 1,212,393 | 22.9 | % | ||||||||||||||||||||||||||||||||
Credit (3) | 1,224,716 | 18.0 | % | 901,716 | 13.1 | % | 769,321 | 14.5 | % | ||||||||||||||||||||||||||||||||
Other specialty (4) | 2,349,171 | 34.6 | % | 2,514,667 | 36.4 | % | 1,588,136 | 30.0 | % | ||||||||||||||||||||||||||||||||
Casualty and Specialty segment gross premiums written | $ | 6,796,279 | 100.0 | % | $ | 6,909,335 | 100.0 | % | $ | 5,299,952 | 100.0 | % | |||||||||||||||||||||||||||||
(1)Includes automobile liability, casualty clash, employers’ liability, umbrella or excess casualty, workers’ compensation and general liability.
(2)Includes directors and officers, medical malpractice, professional indemnity and transactional liability.
(3)Includes financial guaranty, mortgage guaranty, political risk, surety and trade credit.
(4)Includes accident and health, agriculture, aviation, construction, cyber, energy, marine, satellite and terrorism. Lines of business such as regional multi-line and whole account may have characteristics of various other lines of business, and are allocated accordingly.
We offer our casualty and specialty reinsurance products principally on a proportional basis, and we also provide excess of loss coverage. These products frequently include tailored features such as limits or sub-limits which we believe help us manage our exposures. Any liability exceeding, or otherwise not subject to, such limits reverts to the cedant. Certain casualty and specialty lines of business such as marine, energy and terrorism are also exposed to catastrophe risk, and we seek to appropriately estimate and manage correlations between these lines and our property reinsurance portfolio.
Our Casualty and Specialty segment also offers certain insurance products, including excess and surplus, general liability and professional liability lines of business, primarily through delegated authority arrangements. We write this business in a similar manner to our reinsurance business, and view it through a reinsurance lens, with a focus on approaching it as a portfolio of risks.
Other
In addition to our two reportable segments, we have an Other category. Our Other category primarily includes the results of: (1) our investment unit which manages and invests the funds generated by our consolidated operations; (2) our share of strategic investments in certain markets we believe offer attractive risk-adjusted returns or where we believe our investment adds value, and where, rather than assuming exclusive management responsibilities ourselves, we partner with other market participants; and (3) corporate expenses, certain expenses related to acquisitions and dispositions, capital servicing costs, income tax benefit (expense) and noncontrolling interests.
7
Geographic Breakdown
Our exposures are generally diversified across geographic zones, but are also a function of market conditions and opportunities. Our largest exposure has historically been to the U.S. and Caribbean.
The following table sets forth the amounts and percentages of our gross premiums written by territory of coverage exposure:
| Year ended December 31, | 2025 | 2024 | 2023 | ||||||||||||||||||||||||||||||||||||||
| (in thousands, except percentages) | Gross Premiums Written | Percentage of Gross Premiums Written | Gross Premiums Written | Percentage of Gross Premiums Written | Gross Premiums Written | Percentage of Gross Premiums Written | |||||||||||||||||||||||||||||||||||
Property | |||||||||||||||||||||||||||||||||||||||||
| U.S. and Caribbean | $ | 3,162,323 | 26.9 | % | $ | 2,996,981 | 25.5 | % | $ | 2,303,013 | 26.0 | % | |||||||||||||||||||||||||||||
| Worldwide | 1,038,625 | 8.8 | % | 1,063,292 | 9.1 | % | 798,623 | 9.0 | % | ||||||||||||||||||||||||||||||||
| Europe | 233,440 | 2.0 | % | 244,523 | 2.1 | % | 163,500 | 1.9 | % | ||||||||||||||||||||||||||||||||
Worldwide (excluding U.S.) (1) | 152,653 | 1.3 | % | 180,688 | 1.5 | % | 70,646 | 0.8 | % | ||||||||||||||||||||||||||||||||
| Japan | 103,383 | 0.9 | % | 106,533 | 0.9 | % | 85,823 | 1.0 | % | ||||||||||||||||||||||||||||||||
| Australia and New Zealand | 94,161 | 0.8 | % | 101,976 | 0.9 | % | 70,107 | 0.8 | % | ||||||||||||||||||||||||||||||||
| Other | 157,556 | 1.4 | % | 129,738 | 1.1 | % | 70,702 | 0.8 | % | ||||||||||||||||||||||||||||||||
Total Property segment | 4,942,141 | 42.1 | % | 4,823,731 | 41.1 | % | 3,562,414 | 40.3 | % | ||||||||||||||||||||||||||||||||
Casualty and Specialty | |||||||||||||||||||||||||||||||||||||||||
| U.S. and Caribbean | 3,127,671 | 26.6 | % | 2,986,956 | 25.5 | % | 2,333,096 | 26.3 | % | ||||||||||||||||||||||||||||||||
| Worldwide | 3,070,027 | 26.2 | % | 3,217,662 | 27.3 | % | 2,280,687 | 25.7 | % | ||||||||||||||||||||||||||||||||
| Europe | 274,346 | 2.3 | % | 353,863 | 3.0 | % | 197,228 | 2.2 | % | ||||||||||||||||||||||||||||||||
Worldwide (excluding U.S.) (1) | 165,274 | 1.4 | % | 195,489 | 1.7 | % | 130,334 | 1.5 | % | ||||||||||||||||||||||||||||||||
| Australia and New Zealand | 22,076 | 0.2 | % | 43,183 | 0.4 | % | 27,397 | 0.3 | % | ||||||||||||||||||||||||||||||||
| Other | 136,885 | 1.2 | % | 112,182 | 1.0 | % | 331,210 | 3.7 | % | ||||||||||||||||||||||||||||||||
Total Casualty and Specialty segment | 6,796,279 | 57.9 | % | 6,909,335 | 58.9 | % | 5,299,952 | 59.7 | % | ||||||||||||||||||||||||||||||||
| Total gross premiums written | $ | 11,738,420 | 100.0 | % | $ | 11,733,066 | 100.0 | % | $ | 8,862,366 | 100.0 | % | |||||||||||||||||||||||||||||
(1)The category “Worldwide (excluding U.S.)” consists of contracts that cover more than one geographic region (other than the U.S.).
Principal Wholly-Owned Operating Subsidiaries
Our principal wholly-owned operating subsidiaries are Renaissance Reinsurance, RREAG, Renaissance Reinsurance U.S., RenaissanceRe Specialty U.S., Syndicate 1458 and Renaissance Reinsurance of Europe DAC. Through these subsidiaries we write the property and casualty and specialty (re)insurance that drives our underwriting income.
Renaissance Reinsurance is our primary flagship balance sheet, through which we have broad exposure to a range of risks. Our other balance sheets allow us to optimize where and how we write specific risks, considering geographic location, regulatory flexibility, and the ability to access different markets of risk. For example, RREAG focuses on writing specialty risks across the European market and in other jurisdictions utilizing its branches and our reinsurance intermediaries. We utilize our integrated and flexible underwriting platform to ensure that risks are matched with the optimal principal wholly-owned operating subsidiary balance sheet.
CAPITAL PARTNERS
Fee Income
We pursue a number of other opportunities, including creating and managing our joint ventures and managed funds, executing structured reinsurance transactions to assume or cede risk and managing certain strategic investments, primarily through our Capital Partners unit. These opportunities aid us in generating our second driver of profit, the fee income that we earn on our third-party capital management activities. We earn two types of fee income managing third-party capital: management fee income and performance fee income. Management fees are fees that we receive for the day-to-day management and oversight of our joint venture vehicles, managed funds and certain structured reinsurance products. Performance fees are based on the performance of the individual vehicles or products. Compared to
8
underwriting income, we view fee income, especially management fee income, as being a relatively less volatile and diversifying source of income.
Our capital management business is one of the oldest, largest and most respected in the industry and provides us with a larger capital base, through which we are able to write more business and reach a broader customer base. In addition to the business that we write for our own account, we also write risk with capital provided by third parties. Because we often co-invest alongside our third-party capital providers, we view them as partners in achieving our mission of matching desirable risk with efficient capital. Our third-party capital partners are typically institutional investors seeking investment returns that are less correlated with the broader capital markets.
We believe that we benefit from our ability to optimize our portfolio construction across our vehicles and business through superior risk selection. Our third-party capital partners benefit from our ability to access the best risk and construct high-quality portfolios in tailored geographies. At the same time, this business benefits our customers, as it allows us to write more risk in various forms across balance sheets with diversified counterparties. We are also able to offer additional investment opportunities to institutional and other investors to serve as our capital partners and make targeted investments in certain of the products that we offer.
Managed Joint Ventures and Managed Funds
We manage a number of joint ventures and managed funds which provide us with an additional presence in the market, enhance our client relationships and generate management fee income and performance fee income. Currently, our principal joint ventures and managed funds include DaVinci, Fontana, Medici, Medici UCITS, Vermeer, Top Layer and Upsilon.
| December 31, 2025 | |||||||||||||||||||||||||||||
Entity | Consolidated | RenaissanceRe’s Economic Ownership (1) | Generates Management Fee Income (2) | Generates Performance Fee Income (3) | |||||||||||||||||||||||||
DaVinci | X (4) | 24.3% | X | X | |||||||||||||||||||||||||
Fontana | X (4) | 28.7% | X | X | |||||||||||||||||||||||||
Medici | X (4) | 11.3% | X | — | |||||||||||||||||||||||||
Vermeer | X (4) | — | X | — | |||||||||||||||||||||||||
Medici UCITS | — | 34.3% | X | — | |||||||||||||||||||||||||
| Top Layer | — | 50.0% | X | — | |||||||||||||||||||||||||
| Upsilon | X (5) | 12.9% | X | X | |||||||||||||||||||||||||
(1)Represents the Company’s noncontrolling economic ownership in each of the entities.
(2)Management fees are fees that we receive for the day-to-day management and oversight of our joint venture vehicles and managed funds.
(3)Performance fees may be negative in a particular period if, for example, large losses occur, which can potentially result in no performance fees or the reversal of previously accrued performance fees.
(4)As a result of our interests in these entities that are considered VIEs, and our determination that we are the primary beneficiary of each of those entities, we consolidate these entities in our financial statements. Accordingly, the third parties’ economic interest in the entities’ net assets and net income (loss) are reflected in our consolidated balance sheets and consolidated statements of operations in redeemable noncontrolling interests and net (income) loss attributable to redeemable noncontrolling interests, respectively.
(5)Upsilon includes Upsilon RFO and Upsilon Fund. We consolidate the financial results of certain segregated accounts of Upsilon RFO and account for the portion of its premium that we do not own as a ceded retrocession. We do not consolidate the financial results of Upsilon Fund.
DaVinci
DaVinci, which we formed in 2001, expands our capacity to provide property catastrophe reinsurance and certain lines of casualty and specialty reinsurance on a global basis. Third-party investors own a majority of the economic interest in DaVinci, which provides them with access to attractive risk while generating management fee income and performance fee income for us. In addition, we maintain a significant economic investment in DaVinci. DaVinci, DaVinci Reinsurance’s holding company, is considered a VIE
9
and, as we are the primary beneficiary, we consolidate DaVinci in our financial results. RUM, a wholly owned subsidiary of RenaissanceRe, acts as the exclusive underwriting manager for DaVinci. Through our wholly-owned operating subsidiaries, we participate on every risk that DaVinci Reinsurance assumes, ensuring alignment. Often, our wholly-owned operating subsidiaries will write business for themselves and then cede a portion to DaVinci Reinsurance.
Fontana
Fontana assumes casualty and specialty risks, including long-tail lines. Third-party investors own a majority of the economic interest in Fontana, which provides them with access to attractive casualty and specialty risk while generating management fee income and performance fee income for us. Fontana also allows us to increase casualty and specialty capacity for our customers. Fontana is considered a VIE and, as we are the primary beneficiary, we consolidate Fontana in our financial results. Fontana assumes a whole account quota share of our global casualty and specialty book of business, including the credit portfolio, ensuring alignment. Fontana comprises a group of reinsurance operating companies and their holding companies, in which we maintain a significant economic investment.
Medici
Medici principally invests in property catastrophe bonds, although it may also invest in various other insurance-based investment instruments that have returns primarily correlated to property catastrophe risk. Third-party investors own a majority of the participating, non-voting common shares of Medici, pursuant to which they own a majority of Medici’s economic benefits, which provides them with access to attractive catastrophe bond risks while generating management fee income for us. Medici allows us to increase our participation in our customers’ catastrophe bond offerings and broaden our relationships with them. Medici is considered a VIE and, as we are the primary beneficiary, we consolidate Medici in our financial results. RFM, a wholly owned subsidiary of RenaissanceRe, acts as the exclusive investment fund manager of Medici. We maintain a significant investment in Medici.
Medici UCITS
Renaissance Medici UCITS Fund, an Irish domiciled property catastrophe bond fund, and a sub-fund of RenaissanceRe Medici ICAV, is purpose-built to provide European and other global investors with access to RenaissanceRe’s catastrophe bond investment strategy through a dedicated European-regulated UCITS structure. Medici UCITS is intended to complement our existing catastrophe bond fund, Medici, and Medici UCITS and Medici share substantially similar investment guidelines and risk appetites. Third-party investors own a majority of the common shares of Medici UCITS, pursuant to which they own a majority of Medici UCITS’s economic benefits, which provides them with access to attractive catastrophe bond risks while generating management fee income for us. We do not control the voting rights of Medici UCITS and therefore it is not consolidated within our results. RFM, a wholly owned subsidiary of RenaissanceRe, acts as the exclusive investment fund manager of Medici UCITS. We maintain a significant investment in Medici UCITS.
Vermeer
Vermeer expands our ability to provide capacity focused on risk remote layers in the U.S. property catastrophe market. Vermeer is considered a VIE and, as we are the primary beneficiary, we consolidate Vermeer in our financial results. Stichting Pensioenfonds Zorg en Welzijn, a pension fund represented by PGGM, retains 100% of Vermeer’s economic benefits. RUM acts as the exclusive underwriting manager for Vermeer, which generates management fee income for us. Vermeer gives us the ability to provide additional capacity to the high excess U.S. property catastrophe market. We separately participate in the risks written by Vermeer through our wholly-owned operating subsidiaries and joint ventures.
Top Layer
We established Top Layer in 1999 to expand our ability to write high excess non-U.S. property catastrophe reinsurance. Top Layer is owned 50% by State Farm and 50% by Renaissance Reinsurance, although State Farm provides the majority of Top Layer’s underwriting capacity through a $3.9 billion stop-loss reinsurance agreement, and therefore, State Farm retains most of Top Layer’s underwriting results. Since
10
we do not control Top Layer, we do not consolidate it in our financial results. RUM acts as the exclusive underwriting manager for Top Layer, which generates management fee income for us. We maintain a significant investment in Top Layer.
Upsilon
Upsilon is composed of Upsilon RFO and Upsilon Fund. Upsilon RFO is the risk bearing entity. As a segregated accounts company, Upsilon RFO holds identified pools of assets and liabilities in accounts that are each ring-fenced or segregated from any claims from the creditors of Upsilon RFO’s general account and from the creditors of other segregated accounts within Upsilon RFO. Upsilon RFO’s segregated accounts enter into collateralized reinsurance arrangements, and each account’s capital is sourced either directly from third-party investors, or from Upsilon Fund. Upsilon RFO is considered a VIE and, as we are the primary beneficiary of certain segregated accounts, we consolidate the financial results of those certain accounts of Upsilon RFO and account for the portion of its premium that we do not own as a ceded retrocession. Upsilon gives us the ability to provide additional capacity to the worldwide aggregate and per-occurrence primary and retrocessional markets on a collateralized basis, either directly, or through business written by Renaissance Reinsurance and then ceded to Upsilon RFO.
Upsilon Fund is also a segregated accounts company, and each account acts as either a pool of assets from multiple investors, such as Upsilon Diversified, or as a separately-managed account for an individual institutional investor, such as NOC1 and Stratos Fund. Upsilon Fund’s segregated accounts invest in either Upsilon RFO, or in other reinsurance risks, such as catastrophe bonds, that are managed by us. RFM acts as the exclusive investment manager for Upsilon Fund, which generates management fee income and performance fee income for us. We do not consolidate Upsilon Fund. We maintain a significant investment in Upsilon RFO.
AlphaCat
In connection with the Validus Acquisition, we acquired AlphaCat Managers, which manages third-party capital in various forms, including through closed-end and open-end Bermuda mutual funds and one managed account, collectively, the “AlphaCat Funds,” which currently generate fee income. Prior to the Validus Acquisition, substantially all of the AlphaCat Funds had received full redemption requests from their investors and capital was being released accordingly, subject to certain constraints. We expect to run off this business over a period of time.
Noncontrolling Interest
We manage several entities - DaVinci, Fontana, Medici, and Vermeer - where we control the decision making authority through ownership of the voting interests but do not own all of the economic interest. As a result of our control, we include the full financial results of these entities in our consolidated financial statements. However, since we do not own all of the economic interest in these entities, we do not ultimately retain all of the economic outcomes they generate. Rather, portions of these entities’ economic outcomes are due to third-party investors who hold noncontrolling interests in these entities and are ultimately allocated to such third-party investors.
These entities’ economic outcomes may include underwriting results, investment results, and foreign exchange impacts, among other items. For example, if one of these entities realizes a financial gain or loss from its underwriting or investment activities, the full amount of such gain or loss is shown in net income (loss) on our consolidated statements of operations. But only the portion of such gain or loss that represents our investment in such entity is reflected in net income (loss) attributable to RenaissanceRe. The remainder, which is ultimately allocated to such third-party investors in those entities, is shown separately in net (income) loss attributable to redeemable noncontrolling interests.
Refer to “Note 10. Noncontrolling Interests” in our “Notes to the Consolidated Financial Statements” for additional information regarding our redeemable noncontrolling interests and how this accounting treatment impacts our financial results.
11
Other Transactions
From time to time, we pursue other customized reinsurance and financing transactions. For example, we have participated in, and continuously analyze, other attractive opportunities in the market for insurance-linked securities and derivatives. We believe our products contain a number of customized features designed to fit the needs of our capital partners, as well as our risk management objectives.
INVESTMENTS
Investment Income
Our investment portfolio generates our third driver of profit, investment income. We structure our investment portfolio to emphasize the preservation of capital and the availability of liquidity to meet our claims obligations, to be well diversified across market sectors, and to generate relatively attractive returns on a risk-adjusted basis over time.
Our investment portfolio also serves as a stable capital base against which we can underwrite risk, and also allows us to generate relatively attractive investment income and returns over time. Our investment portfolio includes both investments that we make on behalf of the Company and whose investment results are fully retained by the Company, as well as investments that we manage on behalf of our joint ventures and managed funds, in which we retain no, or only a partial, economic interest.
The majority of our investments are highly-rated fixed income securities. We also hold a significant amount of short term investments which have a maturity of one year or less when purchased. In addition, we hold equity and commodity futures, and other investments, including catastrophe bonds, fund investments and direct private equity investments, which offer the potential for higher returns but with relatively higher levels of risk. Our investment portfolio takes into account the duration of our liabilities and the level of strategic asset risk we wish to assume over the medium- to long-term. We may from time to time re-evaluate our investment guidelines and explore investment allocations to other asset classes that either increase or decrease our overall asset risk. To further the sustainability of our investment portfolio, we consider certain environmental, social and governance factors within our investment strategy. Our investments are subject to market-wide risks and fluctuations, as well as to risks inherent in particular securities.
For additional information regarding our investment portfolio, refer to “Part II, Item 7. Management’s Discussion and Analysis of Financial Condition and Results of Operations—Financial Condition, Liquidity and Capital Resources—Investments” and “Note 5. Investments” in our “Notes to the Consolidated Financial Statements.”
Strategic Investments
We also pursue strategic investments where, rather than assuming exclusive management responsibilities ourselves, we partner with other market participants. These investments may be directed at classes of risk other than catastrophe reinsurance, and at times may also be directed at non-insurance risks. We find these investments attractive because of their target risk-adjusted returns, and because of their ability to help advance our business objectives and capabilities. We believe that our strategic investments provide us with enhanced risk access and information on markets that are core to our business, as well as potential new markets for future growth consideration. For example, we have strategic investments in the Tower Hill Companies which grant us access to participants in the Florida homeowners insurance market. Additionally, we have a strategic investment in TWFG, which distributes personal and commercial insurance across the United States.
COMPETITION
The markets in which we operate are highly competitive. Our competitors include independent reinsurance and insurance companies, subsidiaries, divisions and/or affiliates of globally recognized insurance companies, domestic and international underwriting operations, such as managing general agents, as well as a range of other entities offering risk transfer protection on a collateralized or other non-traditional basis. As our business and the (re)insurance industry continue to evolve, we expect our competitors to evolve as well, and we may face competition from other non-traditional participants, such as technology companies, among others.
12
We believe that our principal competitors are traditional insurance and reinsurance companies, but also include third-party capital managers. We also compete with certain Lloyd’s syndicates active in the London market. Hedge funds, pension funds and endowments, investment banks and other capital market participants may also be active in the reinsurance market and the market for related risk, either through the formation of reinsurance companies or through the use of financial products, such as catastrophe bonds and other insurance-linked securities.
RISK MANAGEMENT
Underwriting Risk Management
Our primary underwriting goal is to construct a portfolio of reinsurance and insurance contracts and other financial risks that maximizes our return on shareholders’ equity, subject to prudent risk constraints, and to generate long-term growth in tangible book value per common share plus the change in accumulated dividends. We assess each new (re)insurance contract on the basis of the expected incremental return relative to the incremental contribution to portfolio risk.
We have developed a proprietary pricing and exposure management system, REMS©, which has analytic and modeling capabilities that help us to assess the risk and return of each incremental (re)insurance contract in relation to our overall portfolio of (re)insurance contracts. We believe that REMS© is a robust underwriting and risk management system that has been successfully integrated into our business processes and culture. In conjunction with pricing models that we run outside of REMS©, the REMS© framework encompasses and facilitates risk capture, analysis, correlation, portfolio aggregation and capital allocation within a single system for all of our natural and non-natural hazards (re)insurance contracts. We continue to invest in and improve REMS©, incorporating our underwriting and modeling experience and adding proprietary software and industry data. We believe that the expertise and tools are state of the art and have been fully embedded in our underwriting processes.
We generally utilize a multiple model/method approach when evaluating a proposed transaction, combining both probabilistic and deterministic techniques. We combine the analyses generated by REMS© with other information and other model inputs available to us, including our own knowledge of the client submitting the proposed program, to assess the premium offered against the risk of loss and the cost of utilized capital which the program presents. The underlying risk models integrated into our underwriting and REMS© framework are a combination of internally constructed and commercially available models. We use commercially available models to assist with validating and stress testing our base model and REMS© results.
Before we bind a (re)insurance risk, exposure data, historical loss information and other risk data is gathered from customers. Using a combination of proprietary software, underwriting experience, actuarial techniques and engineering expertise, the exposure data is reviewed and augmented, as we deem appropriate. We use this data as primary inputs into the REMS© modeling system as a base to create risk distributions to represent the risk being evaluated. We believe that the REMS© modeling system helps us to analyze each contract on a consistent basis, assisting our determination of what we believe to be an appropriate price to charge for each policy based upon the risk to be assumed. In part, through the process described above and the utilization of REMS©, we seek to compare our estimate of the expected returns in respect of a contract with the amount of capital we notionally allocate to the contract based on our estimate of its marginal impact on our portfolio of risks. A key advantage of our REMS© framework is our ability to include additional perils, risks and geographic areas that may not be captured in commercially available natural hazards risk models.
We periodically review the estimates and assumptions that are reflected in REMS© and our other tools, driven either by new hazard science and understanding or by experience of loss events. We continually monitor frequency and severity trends for our casualty lines of business, in particular emerging trends toward higher levels of social inflation. Where appropriate, we are able to shift our business mix away from classes and industry sectors that are particularly sensitive to higher social inflation trends. More generally, our team of scientists at RenaissanceRe Risk Sciences Inc. have been tracking the influence of climate change to better understand the impact of natural catastrophes on our business.
13
Our underwriters use the combination of our risk assessment and underwriting process, REMS© and other tools in their pricing decisions, which we believe provides them with several competitive advantages. These include the ability to: (i) simulate a range of potential outcomes that adequately represents the risk to an individual contract; (ii) analyze the incremental impact of an individual reinsurance contract on our overall portfolio; (iii) better assess the underlying exposures associated with assumed retrocessional business; (iv) price contracts within a short time frame; (v) capture various classes of risk, including catastrophe and other insurance risks; (vi) assess risk across multiple entities (including our various joint ventures and managed funds) and across different components of our capital structure; and (vii) provide consistent pricing information. As part of our risk management process, we also use REMS© to assist us, as a retrocedant, with the purchase of reinsurance coverage for our own account.
Our underwriting and risk management process, in conjunction with REMS©, quantifies and manages our exposure to claims from single events and the exposure to losses from a series of events. As part of our pricing and underwriting process, we also assess a variety of other factors, including: (i) the reputation of the proposed cedant and the likelihood of establishing a long-term relationship with the cedant; (ii) the geographic area in which the cedant does business and its market share; (iii) historical loss data for the cedant and, where available, for the industry as a whole in the relevant regions and lines of business, in order to compare the cedant’s historical catastrophe loss experience to industry averages; (iv) the cedant’s pricing strategies; and (v) the perceived financial strength of the cedant and factors such as the cedant’s historical record of making premium payments in full and on a timely basis.
In order to estimate the risk profile of each line of non-natural hazard reinsurance (i.e., our casualty and specialty lines of business), we establish probability distributions and assess the correlations with the rest of our portfolio. In casualty and specialty lines with catastrophe risk, such as marine, energy and terrorism, we seek to directly leverage our skill in modeling property reinsurance risks, and aim to appropriately estimate and manage the correlations between these casualty and specialty lines and our property reinsurance portfolio. For other classes of business, in which we believe we have little or no natural catastrophe exposure, and therefore less correlation with our property reinsurance coverages, we derive probability distributions from a variety of underlying information sources, including recent historical experience, and the application of judgment as appropriate. The nature of some of these businesses lends itself less to the analysis we use for our property reinsurance coverages, reflecting both the nature of available exposure information, and the impact of human factors such as tort exposure. We produce probability distributions to represent our estimates of the related underlying risks which our products cover, which we believe helps us to make consistent underwriting decisions and to manage our total risk portfolio.
In addition, we also produce, utilize, and report on models which measure our utilization of capital in light of regulatory capital considerations and constraints. Our position in respect of these regulatory capital models is reviewed by our risk management professional staff and periodically reported to and reviewed by senior underwriting personnel and executive management with responsibility for our regulated operating entities.
Enterprise Risk Management
We believe that high-quality and effective ERM is best achieved when it is a shared cultural value throughout the organization and consider ERM to be a key process which is the responsibility of every individual at RenaissanceRe. We have developed and utilize tools and processes we believe support a culture of risk management and create a robust framework of ERM within our organization. We believe that our ERM processes and practices help us to identify potential events that may affect us, quantify, evaluate and manage the risks to which we are exposed, and provide reasonable assurance regarding the achievement of our objectives. We also believe that effective ERM assists our efforts to minimize the likelihood of suffering financial outcomes in excess of the ranges which we have estimated in respect of specific investments, underwriting decisions, or other operating or business activities, including cybersecurity risks, although we do not believe this risk can be eliminated. In particular, we utilize our risk management tools to support our efforts to monitor our capital and liquidity positions on a consolidated basis and for each of our major operating subsidiaries, and to allocate an appropriate amount of capital to support the risks we have assumed in the aggregate and for each of our major operating subsidiaries.
Our Board and its committees are responsible for overseeing enterprise-wide risk management and are actively involved in the monitoring of risks that could affect us. The members of the Board have regular, direct access to the senior executives and other officers responsible for identifying and monitoring our risks
14
and coordinating our ERM, including our Group Chief Risk Officer, Chief Portfolio Officer, Group Chief Underwriting Officer, Chief Financial Officer, and Group General Counsel, each of whom reports directly to our Chief Executive Officer, as well as other senior personnel such as our Chief Investment Officer, Chief Compliance Officer, Chief Accounting Officer, Global Corporate Controller and Head of Internal Audit. The Board also receives regular reports from the Operational Risk and Resilience Committee, which includes members of senior management, compliance professionals and others and oversees policies and procedures relating to accounting, financial reporting, internal controls, legal and regulatory matters, and complex transactions, among other matters.
Our ERM framework operates via a three lines model. The first line consists of individual functions that deliberately assume risks on our behalf and own and manage risk within the Company on a day-to-day and business operational basis. The second line is responsible for risk oversight and also supports the first line to understand and manage risk, and is comprised of a dedicated risk team led by the Group Chief Risk Officer who reports to the Board’s Investment and Risk Management Committee and the Chief Executive Officer, and a dedicated compliance team led by the Group General Counsel who reports to the Board’s Audit Committee and the Chief Executive Officer. The third line, our Internal Audit team, reports to the Audit Committee of the Board and provides independent, objective assurance as to the assessment of the adequacy and effectiveness of our internal control systems and also coordinates risk-based audits and compliance reviews and other specific initiatives to evaluate and address risk within targeted areas of our business.
The principal risk areas that make up our ERM framework are assumed risk (including reserve risk), business environment risk and operational risk:
•Assumed Risk. We define assumed risk as activities where we deliberately take risk against our capital base, including underwriting risks and other quantifiable risks such as credit risk and market risk as they relate to investments, ceded reinsurance credit risk and strategic investment risk, each of which can be analyzed in substantial part through quantitative tools and techniques. Of these, we believe underwriting risk to be the most material to us. In order to understand, monitor, quantify and proactively assess underwriting risk, we seek to develop and deploy appropriate tools to estimate the comparable expected returns on potential business opportunities and the impact that such incremental business could have on our overall risk profile. We use the tools and methods described above in “Underwriting” to seek to achieve these objectives. Embedded within our consideration of assumed risk is our management of our aggregate, consolidated risk profile. In part through the utilization of REMS© and our other systems and procedures, we analyze our in-force aggregate assumed risk portfolio on a daily basis. We believe this capability helps us to manage our aggregate exposures and to rigorously analyze and evaluate individual proposed transactions in the context of our in-force portfolio. This aggregation process captures line of business, segment and corporate risk profiles, calculates internal and external capital tests and explicitly models ceded reinsurance. Generally, additional data is added quarterly to our aggregate risk framework to reflect updated or new information or estimates relating to matters such as interest rate risk, credit risk, capital adequacy and liquidity. This information is used in day-to-day decision making for underwriting, investments and operations and is also reviewed quarterly from both a unit level and consolidated financial position perspective. We also regularly assess, monitor and review our regulatory risk capital and related constraints.
•Reserve Risk. Reserve risk is a subcomponent of assumed risk. We define reserve risk as the risks related to our reserve for net claims and claim expenses, including the amount, both absolute and relative, of our reserve for net claims and claim expenses, and the impact of economic, social, legal and regulatory matters. Our reserve for net claims and claim expenses is subject to significant uncertainty and has the potential to develop adversely in future periods. While reserve risk may increase in both absolute terms and relative to its overall consideration in our ERM framework, we employ robust resources, procedures and technology to identify, understand, quantify and manage this risk. Our reserving methodologies and sensitivities for each respective line of business described in “Part II. Item 7. Management’s Discussion and Analysis of Financial Condition and Results of Operations—Summary of Critical Accounting Estimates—Claims and Claim Expense Reserves.”
15
•Business Environment Risk. We define business environment risk as the risk of changes in the business, political or regulatory environment that could negatively impact our short term or long-term financial results or the markets in which we operate. This risk area also typically includes emerging risks. These risks are predominately extrinsic to us and our ability to alter or eliminate these risks is limited, so we focus our efforts on monitoring developments, assessing potential impacts of any changes, and investing in cost effective means to attempt to mitigate the consequences of, and ensure compliance with, any new requirements applicable to us.
•Operational Risk. We are subject to a number of additional risks arising out of operational, regulatory, and other matters. We define operational risk to include the risk that we fail to create, manage, control or mitigate the people, processes, structures or functions required to execute our strategic and tactical plans and assemble an optimized portfolio of assumed risk, and to adjust to and comply with the evolving requirements of business environment risk applicable to us. In light of the rapid evolution of our markets, business environment, and business initiatives, we seek to continually invest in the tools, processes and procedures we use to mitigate our exposure to operational risk on a cost-effective basis. As with assumed risk and business environment risk, operational risk presents intrinsic uncertainties, and we may fail to appropriately identify or mitigate applicable operational risk.
We address other areas of operational risk through our business continuity and incident response program, human resource practices such as motivating and retaining top talent, our strict tax protocols and our legal and regulatory policies and procedures.
ENVIRONMENTAL AND CLIMATE-RELATED RISK MATTERS
Our principal economic exposures arise from our coverages for natural disasters and catastrophes. We believe, and we believe the consensus view of current scientific studies substantiates, that changes in climate conditions, primarily global temperatures and expected sea levels, have increased, and are likely to continue to increase, the severity and frequency of weather-related natural disasters and catastrophes relative to the historical experience over the past 100 years. While it is difficult to distinguish between permanent climate change and transient climate variability, an ever-expanding body of research suggests that these trends are in fact man-made, and, if correct, we believe that this trend will not revert to the mean but continue to worsen. We believe that this increase in severe weather, coupled with currently projected demographic trends in catastrophe-exposed regions, contributes to factors that will increase the average economic value of expected losses, increase the number of people exposed per year to natural disasters and in general exacerbate disaster risk, including risks to infrastructure, global supply chains and agricultural production. Accordingly, we expect an increase in both the frequency and magnitude of claims, especially from properties located in coastal areas.
The consideration of the impacts of climate-related risk, including climate change is integrated into our ERM process. We have taken measures to mitigate losses related to climate change through our underwriting process and by continuously monitoring and adjusting our risk management models to reflect the higher level of risk that we think will persist. We have been progressively integrating the consideration of the financial risk of climate change into our governance frameworks, risk management processes, and business strategies over the past several years. We monitor emerging regulatory expectations, as many of our regulators are increasingly focused on climate-related risk oversight and disclosures.
Additionally, as a (re)insurance company, we believe that we play a role in supporting the orderly transition to a lower-carbon economy through three primary channels: (i) through our underwriting activities, where we assume risk, in ways that help provide the liquidity and capital necessary to enable the orderly transition of industries, businesses and society towards a lower carbon future; (ii) through our investments portfolio, where, as an asset owner, we seek to allocate capital in a manner that supports long-term decarbonization and resilience; and (iii) through our own business operations, by working to reduce our operational carbon footprint and enhance the sustainability of our business practices.
Our Board and its committees are actively engaged in the oversight of sustainability initiatives and strategy, and receive regular updates from management on progress, risk and developments.
In addition to the impacts that environmental events may have on our business, we are subject to increasing governmental and regulatory initiatives and scrutiny related to climate-related risk and
16
greenhouse gas emissions. Various jurisdictions have introduced, or are in the process of introducing, climate-related disclosure requirements that may affect our operations. For example, several jurisdictions are in the process of implementing the International Sustainability Standards Board requirements which requires disclosure of the risks and opportunities arising from social and environmental issues. Other regulators have also strengthened their expectations. In the United Kingdom, the Prudential Regulation Authority, has issued enhanced expectations for climate risk integration and disclosure. Similarly, Switzerland’s FINMA has adopted a new circular required phased implementation of climate and nature risk obligations beginning in 2026. The implementation of these, and other, requirements may increase compliance burdens and associated regulatory costs and complexity. Additionally, regulators may introduce similar requirements in the future.
RATINGS
Financial strength ratings are important to the competitive position of reinsurance and insurance companies. We have received high financial strength ratings from A.M. Best, S&P, Moody’s and Fitch. These ratings represent independent opinions of an insurer’s financial strength, operating performance and ability to meet policyholder obligations, and are not an evaluation directed toward the protection of investors or a recommendation to buy, sell or hold any of our securities. Certain of our entities and the senior notes and preference shares issued by them also have credit ratings. Rating organizations continually review the financial positions of our principal operating subsidiaries and joint ventures and ratings may be revised or revoked by the agencies which issue them. Additionally, rating organizations may change their capital models and rating methodologies, which could have a material impact on our ratings and business.
In addition, A.M. Best assesses and scores companies’ ERM practices, which is an opinion on the many critical dimensions of risk that determine overall creditworthiness. RenaissanceRe has been assigned an ERM score of “Very Strong,” which is the highest ERM score assigned.
See “Part II, Item 7. Management’s Discussion and Analysis of Financial Condition and Results of Operations, Financial Condition, Liquidity and Capital Resources—Ratings” for the ratings of our principal operating subsidiaries and joint ventures by segment, and details of recent ratings actions.
RESERVE FOR CLAIMS AND CLAIM EXPENSES
We believe the most significant accounting judgment made by management is our estimate of claims and claim expense reserves. Claims and claim expense reserves represent estimates, including actuarial and statistical projections at a given point in time, of the ultimate settlement and administration costs for unpaid claims and claim expenses arising from the insurance and reinsurance contracts we sell. Our claims and claim expense reserves are a combination of case reserves, ACR and incurred but not reported losses and incurred but not enough reported losses, collectively referred to as IBNR. Case reserves are losses reported to us by insureds and ceding companies, but which have not yet been paid. If deemed necessary and in certain situations, either we establish, or our clients report, ACR. Client reported ACR represents their estimate of additional contract specific claims in excess of the case reserves they have reported to us. ACR established by us represents our estimates for claims related to specific contracts which we believe may not be adequately estimated by the client as of that date or is not within the IBNR. We establish IBNR using actuarial techniques and expert judgment to represent the anticipated cost of claims which have not been reported to us yet or where we anticipate increased reporting. Our reserving committee, which includes members of our senior management, reviews, discusses, and assesses the reasonableness and adequacy of the reserving estimates included in our audited consolidated financial statements. Because of the nature of the coverages that we provide, the amount and timing of the cash flows associated with our policy liabilities will fluctuate, perhaps significantly, and, therefore, are highly uncertain.
Our reserving techniques, assumptions and processes differ among our Property and Casualty and Specialty segments. Refer to “Note 8. Reserve for Claims and Claim Expenses” in our “Notes to the Consolidated Financial Statements” for more information on the risks we insure and reinsure, the reserving techniques, assumptions and processes we follow to estimate our claims and claim expense reserves, prior year development of the reserve for claims and claim expenses, analysis of our incurred and paid claims development and claims duration information for each of our Property and Casualty and Specialty segments. In addition, refer to “Part II, Item 7. Management’s Discussion and Analysis of Financial
17
Condition and Results of Operations—Summary of Critical Accounting Estimates—Claims and Claim Expense Reserves” for more information on our actual results versus our initial estimates of our claims reserves, and sensitivity analysis for each of our Property and Casualty and Specialty segments.
MARKETING
We believe that our modeling and technical expertise, our broad risk appetite, and our reputation for paying valid claims promptly has enabled us to become a provider of first choice in many lines of business to our customers worldwide. We market our products primarily through reinsurance brokers and we focus our marketing efforts on targeted brokers and partners. We believe that our existing portfolio of business is a valuable asset and, therefore, we attempt to continually strengthen relationships with our existing brokers and customers. We believe that by maintaining close relationships with brokers, we are able to obtain access to a broad range of potential reinsureds.
We believe that primary insurers’ and brokers’ willingness to use a particular reinsurer is based not just on pricing, but also on the financial security of the reinsurer, its claim paying ability ratings and demonstrated willingness to promptly pay valid claims, the quality of a reinsurer’s service, the reinsurer’s willingness and ability to design customized programs, its long-term stability and its commitment to provide stable reinsurance capacity across market cycles.
Our portfolio of business continues to be characterized by relatively large transactions with ceding companies with whom we do business, although no current relationship exceeds 10% of our gross premiums written.
Our brokers assess client needs and also perform data collection, contract preparation and other administrative tasks, enabling us to market our products cost effectively. Our distribution is reliant on a small number of broker relationships, which has continued to decrease in recent years as a result of consolidation in the broker sector. We expect this concentration to continue. In 2025, three brokerage firms accounted for 81.3% of our gross premiums written.
The following table shows the percentage of our Property and Casualty and Specialty segments’ gross premiums written generated through subsidiaries and affiliates of our largest brokers:
| Year ended December 31, 2025 | Property | Casualty and Specialty | Total | ||||||||||||||||||||
| Aon plc | 44.2 | % | 27.4 | % | 34.5 | % | |||||||||||||||||
| Marsh & McLennan Companies, Inc. | 30.4 | % | 36.3 | % | 33.8 | % | |||||||||||||||||
| Arthur J. Gallagher | 6.9 | % | 17.5 | % | 13.0 | % | |||||||||||||||||
| Total of largest brokers | 81.5 | % | 81.2 | % | 81.3 | % | |||||||||||||||||
| All others | 18.5 | % | 18.8 | % | 18.7 | % | |||||||||||||||||
| Total | 100.0 | % | 100.0 | % | 100.0 | % | |||||||||||||||||
HUMAN CAPITAL RESOURCES
Human Capital Resources Oversight
At RenaissanceRe, our people are our most valuable resource and are core to our success, and the effective execution of our strategy. We believe in fostering an open and collaborative culture that encourages employees to take ownership of their performance and development. Our executive management team oversees initiatives to create an environment in which employees can develop and succeed. The Corporate Governance and Human Capital Management Committee of our Board is actively engaged in the oversight of our human capital strategy, which includes employees, work environment, inclusion strategy and compensation practices, and receives regular updates from management on progress and developments. Our executive management team and Corporate Governance and Human Capital Management Committee receive regular reports on progress against our annual human resources tactical plans.
18
Employees
At February 6, 2026, we employed 1,040 people worldwide (February 7, 2025 - 945, February 14, 2024 - 925). Of these employees, 249 were located in Bermuda, 270 in the U.S. and Canada, 492 in Europe and 29 in the Asia-Pacific region.
Talent Acquisition, Development, and Retention
We strive to hire talented people and invest in their development to aid them in their professional and personal growth. As employees progress at RenaissanceRe, we provide structured opportunities to support them in mastering specific competencies at each career level. We also invest in the professional growth of our leaders through customized leadership development programs to build advanced skills and capabilities across a diverse set of participants within the organization. Our bespoke approach to development encourages continuous learning, supported by skills-based training, technical development programs and stretch assignments. We aim to attract, motivate, reward and retain the best people by aligning our performance management practices with our compensation and benefits programs.
Work Environment
We endeavor to provide a safe, healthy and supportive work environment that promotes the well-being of our employees and enables our people to contribute effectively across our global organization. We actively encourage open dialogue with our employees, and conduct engagement and culture surveys to gather feedback on employee satisfaction and engagement. Insights from these surveys inform targeted action, and we monitor follow-up progress, to support the provision of appropriate support and oversight of areas requiring improvement.
Our Commitment to Inclusion
At RenaissanceRe, we are committed to fostering an environment where every individual feels a sense of belonging and is empowered to contribute to our shared success. By collaborating and embracing a wide range of perspectives, we strengthen our ability to fulfill our purpose: protecting communities and enabling prosperity. To achieve this, our inclusion efforts focus on three key areas: supporting and developing talent, empowering inclusive and high-performing teams, and building stronger communities.
Compensation and Benefit Practices
We design our compensation and benefit programs to incorporate a range of components intended to attract and retain talented individuals and mitigate potential risks, while rewarding employees for pursuing our strategic and financial objectives through appropriate risk-taking, risk management and prudent tactical and strategic decision making. We aim to offer fair, competitive wages and benefits based on experience, skills, knowledge and geographic location. We do this by conducting regular market checks of our competitive pay and benefit programs in each of our operating locations, as well as an annual compensation review cycle where we assess pay levels for all employees.
REGULATION
Most countries and all U.S. states regulate (re)insurance business to varying degrees. We currently have significant (re)insurance operations in Australia, Bermuda, Ireland, Singapore, Switzerland, the U.K. and the U.S. Our operating subsidiaries and branches are principally regulated by the regulatory authorities of their respective jurisdictions, and may also be subject to regulation in the jurisdictions of their ceding companies. Expansion into additional (re)insurance markets could expose us or our subsidiaries to increasing regulatory oversight. However, we intend to continue to conduct our operations so as to minimize the likelihood that our Bermuda subsidiaries will become subject to direct U.S. regulation.
Bermuda Regulation
Overview
Generally, Bermuda companies must comply with the provisions of the Bermuda Companies Act 1981. Bermuda-registered insurance companies and insurance management companies are also regulated under
19
the Insurance Act and related regulations, which impose various requirements depending on a company’s classification under the Insurance Act. The Insurance Act imposes solvency and liquidity standards as well as auditing and reporting requirements, and confers on the BMA powers to supervise, investigate and intervene in the affairs of insurance companies. As a holding company, RenaissanceRe is not directly regulated as an insurer under the Insurance Act.
Our entities registered under the Insurance Act include:
•Class 4 general business insurers: Renaissance Reinsurance, and DaVinci Reinsurance
•Class 3B general business insurers: RenaissanceRe Specialty U.S., Vermeer and RREAG, Bermuda Branch
•Class 3A general business insurers: Top Layer, Fontana Re and Fontana US
•Class 3 general business insurer: AlphaCat Re, Mont Fort Re Ltd. and Shima Reinsurance Ltd.
•Collateralized insurer: Upsilon RFO
•Insurance managers: RUM and RenaissanceRe Underwriting Management Ltd.
The European Commission recognizes Bermuda’s regulatory regime as achieving Solvency II equivalence for its commercial (re)insurers and insurance groups.
From time to time, RenaissanceRe’s Bermuda-registered entities may apply for, and be granted, certain modifications to, or exemptions from, regulatory requirements which may otherwise apply to them.
Group Supervision
The BMA is the group supervisor of the RenaissanceRe Group and it has designated Renaissance Reinsurance to be the “designated insurer” in respect of the RenaissanceRe Group. The designated insurer is required to ensure that the RenaissanceRe Group complies with the provisions of the Insurance Act pertaining to groups and all related group solvency and group supervision rules.
The BMA has certain powers of investigation and intervention, relating to Bermuda-registered entities and their holding companies, subsidiaries and other affiliates, including the power to cancel a Bermuda-registered entity’s registration, which it may exercise in the interest of such an insurer’s policyholders or if there is any risk of insolvency or a breach of the Insurance Act or the license conditions of a Bermuda-registered entity.
The International Association of Insurance Supervisors, or IAIS, has adopted a Common Framework for the Supervision of Internationally Active Insurance Groups, or IAIGs, which is focused on both qualitative and quantitative measures that are expected to enhance the group-wide supervision of IAIGs. As part of ComFrame, the IAIS developed global risk-based insurance capital standards that, if applied to us, could increase our prescribed capital requirement, increase regulatory scrutiny on the level of capital we maintain, limit intercompany capital transactions, suspend debt repayments, and significantly increase our cost of regulatory compliance. The BMA embedded the ComFrame group-supervision requirements, including the risk-based insurance capital standards, and requirement for a recovery plan, in the Insurance Act and related regulations in January 2026.
Disclosure and Reporting Requirements
At the group level, the RenaissanceRe Group is required to submit to the BMA a quarterly financial return, as well as the following annual filings: group statutory financial statements, group capital and solvency return, audited group financial statements, and a group solvency self-assessment. At the entity level, our Bermuda registered insurers are required to submit to the BMA both general and statutory audited annual financial statements, which are available on the BMA’s website. Certain insurers and insurance groups are also required to prepare and publish a Financial Condition Report, or FCR. We file a consolidated group FCR, inclusive of Renaissance Reinsurance, RenaissanceRe Specialty U.S., DaVinci Reinsurance, Top Layer, Fontana Re, Fontana US and Vermeer. RREAG files a separate FCR in lieu of a standalone FCR for its Bermuda Branch. Our FCRs are available on our website. In addition, general business insurers are generally required to file an annual capital and solvency return, or BSCR, with the BMA. The BSCR is a risk-based capital model designed to give the BMA robust methods for determining an insurer’s capital
20
adequacy. Our 2024 group BSCR exceeded the target capital level. We are currently completing our 2025 group BSCR, and at this time, we believe we will exceed the target capital, and that each entity that is required to file will exceed the minimum amount of regulatory capital required to be maintained under Bermuda law.
The Insurance Act requires that the BMA be notified in writing when any person becomes, or ceases to be, a “controller” (as defined by applicable regulations to include significant shareholders, managing directors, and chief executives of the registered insurer or its parent company) of any Bermuda registered insurer or an “officer” (as defined by applicable regulations) of any Bermuda registered insurer or its parent company. We must also file with the BMA any changes to an “officer” or “controller” (as such are defined by applicable regulations) of our insurance managers. All registered insurers, and in certain limited cases insurance groups, are required to give notice to the BMA of their intention to effect a material change within the meaning of the Insurance Act.
Capital, Solvency, and Liquidity Requirements
Certain solvency requirements apply to all Bermuda companies under the Bermuda Companies Act 1981. Additional requirements apply to insurance companies and insurance groups. At the group level, the value of the insurance group’s statutory assets must exceed the amount of the insurance group’s statutory liabilities by the group minimum solvency margin. At the entity level, where applicable, a general business insurer’s statutory assets must exceed its statutory liabilities by an amount equal to or greater than the prescribed minimum solvency margin. The minimum solvency margin is determined on the basis of registration category and the net premiums written and loss reserves posted. Additional regulations apply to the determination of the types of capital instruments that may be used to satisfy the solvency requirements.
RenaissanceRe and certain of our Bermuda-registered insurers are also generally required to maintain available statutory economic capital and surplus at a level at least equal to their enhanced capital requirement, which level may be adjusted by the BMA. The BMA has established a target capital level applicable to certain registration categories, and to insurance groups, equal to 120% of the applicable ECR. Failure to maintain statutory capital at least equal to the target capital level would likely result in increased BMA regulatory oversight. An insurer engaged in general business is generally required to maintain a minimum liquidity ratio equal to the value of its relevant assets at not less than 75% of the amount of its relevant liabilities.
Restrictions on Dividends, Distributions and Reductions of Capital
Our Bermuda-registered insurers are generally prohibited from declaring or paying any dividends, if declaring or paying such dividend would cause them to fail to meet the required minimum solvency margin or minimum liquidity ratio, or if certain solvency requirements are not met. Additional restrictions apply to any dividend and any reduction in statutory capital over applicable thresholds.
Income Taxes
Through December 31, 2024, neither we nor our shareholders were required to pay Bermuda income or profits tax, withholding tax, capital gains tax, capital transfer tax, estate duty or inheritance tax in respect of our shares. However, on December 27, 2023, the Corporate Income Tax Act 2023 was enacted. As a result, certain Bermuda businesses which are part of large multinational groups became subject to a 15% corporate income tax in Bermuda for fiscal years beginning on or after January 1, 2025, regardless of any assurance given pursuant to the Exempted Undertakings Tax Protection Act 1966. Our profits generated on or after January 1, 2025 in Bermuda, except for profits earned by our joint ventures and managed funds, are subject to the 15% corporate income tax.
Additional Rules and Regulations
Certain of our Bermuda-registered entities are subject to additional regulatory requirements, including the following:
•Insurance Code of Conduct. Bermuda registered insurers are required to comply with the BMA’s Insurance Code of Conduct, which establishes duties, requirements and standards regarding sound corporate governance, risk management and internal controls.
21
•Special Purpose Insurer and Collateralized Insurer Reporting Requirements. Unlike other (re)insurers, SPIs and collateralized insurers are fully funded to meet their (re)insurance obligations; therefore, the application and supervision processes are less burdensome than traditional registered general business insurers. However, these entities remain subject to annual financial statements and solvency reporting and disclosure requirements. Collateralized insurers are also subject to minimum solvency and enhanced capital requirements.
•Insurance Manager Reporting Requirements. Insurance managers are required to report to the BMA information regarding their management and operations, as well as certain events, for example, a failure to comply with a condition imposed upon it by the BMA.
•Economic Substance Act. Every Bermuda registered entity, other than an entity which is resident for tax purposes in certain jurisdictions outside Bermuda, engaged in a relevant activity (which includes, but is not limited to insurance, fund management, financing and leasing, and holding entity activities) and from which it earns gross revenue in a relevant financial period must satisfy economic substance requirements by maintaining a substantial economic presence in Bermuda, and certain of our entities incorporated in Bermuda are subject to annual reporting obligations regarding this requirement.
•Policyholder Priority. The Insurance Amendment (No. 2) Act 2018 provides that, subject to the prior payment of preferential debts under the Employment Act 2000 and the Bermuda Companies Act 1981, the insurance debts of an insurer must be paid in priority to all other unsecured debts of the insurer.
•Investment Fund Regulation. The Bermuda Investment Funds Act 2006 sets standards applicable to the establishment and operation of investment funds in Bermuda with a view to protecting investors. Each of our managed funds, including Medici and Upsilon Fund is registered or authorized under the Investment Funds Act and are supervised funds regulated by the BMA. Under the Investment Funds Act, registered funds and authorized funds are subject to offering disclosure requirements and obligations with respect to service providers, depositary functions, safekeeping obligations, valuations, and reporting to investors and the public, among other requirements.
•Investment Business Regulation. RFM operates under a Standard License, and AlphaCat Managers is registered as a Class B Registered Person under the Bermuda Investment Business Act 2003. As a result, RFM and AlphaCat Managers are subject to supervision by the BMA, including disclosure and reporting requirements and, in the case of RFM, minimum net asset and liquidity requirements.
U.S. Regulation
Overview
Renaissance Reinsurance U.S. is a Maryland-domiciled insurer licensed or accredited as a reinsurer in all 50 states and the District of Columbia. It is also a certified reinsurer with the U.S. Treasury. Renaissance Reinsurance U.S. is subject to considerable regulation and supervision by state insurance regulators. State insurance departments regulate insurer solvency, authorized investments, loss and loss adjustment expense and unearned premium reserves, cybersecurity, and deposits of securities for the benefit of policyholders. They also conduct periodic examinations and require the filing of annual and other reports relating to the financial condition of companies and other matters. The MIA, as Renaissance Reinsurance U.S.’s domestic regulator, is the primary financial regulator of Renaissance Reinsurance U.S. RREAG, US Branch is in runoff, but is still subject to supervision by the NYDFS and remains subject to many of the regulations described below.
Holding Company Regulation
We are subject to the insurance holding company laws of Maryland, which require Renaissance Reinsurance U.S. to file certain reports concerning its capital structure, ownership, financial condition, general business operations, and material risks with the MIA. Generally, all affiliate transactions involving Renaissance Reinsurance U.S. must be fair and reasonable and, if material or of specified types, require prior notice to and approval or non-disapproval by the MIA.
22
Disclosure and Reporting Requirements
Renaissance Reinsurance U.S. is required to file various detailed reports, including annual and quarterly financial statements in accordance with prescribed statutory accounting rules, with regulatory officials in the jurisdictions in which it conducts business. In addition, the Risk Management and Own Risk Solvency and Assessment Act requires Renaissance Reinsurance U.S. and RREAG, US Branch to: (i) maintain a risk management framework for identifying, assessing, monitoring, managing, and reporting its material and relevant risks; (ii) complete an ORSA at least once each year and at any time there is a significant change to the risk profile of the entity or its holding company system; and (iii) submit an ORSA summary report to the MIA at not more than each year.
Capital and Surplus Requirements
Renaissance Reinsurance U.S. is required to meet certain minimum statutory capital and surplus requirements under Maryland law, including risk-based capital requirements, and to submit an annual report regarding its risk-based capital levels to the MIA. As of December 31, 2025, we believe Renaissance Reinsurance U.S. exceeded all applicable Maryland minimum capital and surplus requirements.
Restrictions on Dividends and Distributions
Maryland law places limitations on the amounts of dividends or distributions payable by Renaissance Reinsurance U.S., including the requirement that any “extraordinary dividends” require certain regulatory notices and approvals (or non-disapprovals) and must be paid out of earned surplus. Renaissance Reinsurance U.S. must also provide notice to the MIA of payment of ordinary dividends.
Acquisition of Control
Any person seeking to acquire “control” (which presumptively includes holders of 10% or more of the outstanding voting securities) of a Maryland-domestic insurer or of an entity that directly or indirectly controls a Maryland-domestic insurer, must provide advance notice to and obtain approval of, the MIA. Therefore, any investor who intends to acquire 10% or more of RenaissanceRe’s outstanding voting securities may need to comply with these laws and would be required to file statements and reports with the MIA before such acquisition. In addition, any existing controlling person of a Maryland-domestic insurer seeking to divest its controlling interest in the insurer must file with the MIA a confidential notice of the proposed divestiture at least 30 days prior to the cessation of control (unless a person acquiring control from the divesting party has filed notice of the proposed acquisition of control with the Commissioner).
RREAG, US Branch
The U.S. casualty portfolio of RREAG, US Branch was transferred to Renaissance Reinsurance U.S. in 2019. The remaining property and specialty business portfolio of RREAG, US Branch will be runoff until all liabilities are extinguished, a process that we expect to take several years.
RREAG, US Branch is licensed in New York and Kansas and it is an accredited reinsurer in 48 states, and the District of Columbia. The NYDFS is RREAG, US Branch’s insurance regulator in the U.S. RREAG, US Branch is subject to New York’s holding company laws as well as laws and regulations pertaining to solvency, capital and surplus, authorized investments, deposits of securities for the benefit of policyholders, cybersecurity, corporate governance and the financial risks related to climate-related risk, such as climate change. As of December 31, 2025, we believe RREAG, US Branch exceeded all applicable minimum capital and surplus requirements. The NYDFS may conduct periodic examinations of RREAG, US Branch and requires the filing of annual and other reports relating to RREAG, US Branch’s financial condition and risk-based capital levels. RREAG, US Branch does not pay ordinary dividends and would need approval from the NYDFS for any return of capital to RREAG.
Reinsurance Regulation
The insurance laws of each U.S. state indirectly regulate the sale of reinsurance to licensed ceding insurers by non-admitted alien reinsurers acting from locations outside the state through the state’s credit for reinsurance laws. With some exceptions, the sale of insurance within a jurisdiction where the insurer is not admitted to do business is prohibited.
23
Although reinsurance contract terms and rates are generally not subject to regulation by state insurance authorities, a U.S. insurance company ordinarily will enter into a reinsurance agreement only if it can obtain credit on its statutory financial statements for the reinsurance ceded. State insurance regulators permit U.S. ceding insurers to take credit for reinsurance ceded to non-admitted, non-U.S. reinsurers, or “alien reinsurers,” if the reinsurance contract contains certain minimum provisions and the alien reinsurer provides appropriate security for its outstanding obligations. The amount of security that an alien reinsurer may be required to provide and the form of that security varies significantly and depends on an alien reinsurer’s financial strength and its status in a given U.S. state. As alien reinsurers, Renaissance Reinsurance, DaVinci Reinsurance, Fontana US, RREAG, RenaissanceRe Specialty U.S., and Vermeer have each been approved by one or more U.S. states as a “Certified Reinsurer” or “Reciprocal Jurisdiction Reinsurer,” which permits it to post reduced or zero security, respectively, while still allowing its cedants to take financial statement credit for the reinsurance.
Federal Oversight and Other Government Intervention
Although generally the insurance industry is not directly regulated by the federal government, federal legislation and initiatives can affect the industry and our business. The Dodd-Frank Act created the Federal Insurance Office, which performs various functions with respect to insurance, including the submission of reports to Congress that could ultimately lead to changes in the regulation of insurers and reinsurers in the U.S., and has preemption authority over state insurance laws that conflict with certain international agreements.
The Dodd-Frank Act also authorizes the U.S. Treasury and the Office of the U.S. Trade Representative to enter into international agreements of mutual recognition regarding the prudential regulation of insurance or reinsurance, or “covered agreements” that address insurance prudential measures and credit for reinsurance.
U.K. Regulation
Overview
RenaissanceRe’s principle risk taking balance sheets in the U.K. are Syndicate 1458 at Lloyd’s, which is managed by RSML and RREAG, UK Branch. The PRA and the FCA regulate all financial services firms in the U.K. including the Lloyd’s market, RSML and RREAG, UK Branch, and have substantial powers of intervention in relation to regulated firms. Under the Lloyd’s Acts, the Council of Lloyd’s is responsible for regulating and directing underwriting at Lloyd’s. Co-operation agreements between Lloyd’s and the FCA and the PRA set out, amongst other things, the co-operation and information sharing between Lloyd’s. If it appears to either the PRA or the FCA that either Lloyd’s is not fulfilling its delegated regulatory responsibilities or that managing agents are not complying with the applicable law and regulation, the PRA or the FCA may intervene in the regulation of individuals and entities operating at Lloyd’s and impose penalties or sanctions for non-compliance or misconduct.
Lloyd’s Regulation
The operations of RSML are subject to oversight by Lloyd’s, substantially effected through the Council of Lloyd’s. RSML’s business plan for Syndicate 1458, including maximum underwriting capacity, requires annual approval by Lloyd’s. Lloyd’s may require changes to any business plan presented to it or additional capital to be provided to support the underwriting plan. We have deposited certain assets with Lloyd’s to support the underwriting business at Lloyd’s of RenaissanceRe CCL, the sole corporate member of Syndicate 1458. RenaissanceRe also participates in the writing of other syndicates at Lloyd’s (managed by third-party managing agents) through RenaissanceRe Corporate Member (No. 2) Limited.
The obligations of RenaissanceRe’s corporate members of Lloyd’s include the following:
•Capital Requirements. The underwriting capacity of a member of Lloyd’s must be supported by providing a deposit, referred to as “Funds at Lloyd’s” or “FAL,” in an amount determined on the basis of such entity’s solvency and capital requirements. The amount of such deposit is calculated for each member through the completion of an annual capital adequacy exercise. In addition, if the FAL are not sufficient to cover all losses, the Lloyd’s Central Fund provides an additional level of security for policyholders. Dividends from a Lloyd’s managing agent and a Lloyd’s corporate
24
member can be declared and paid provided the relevant company has sufficient profits available for distribution.
•Ratings. The financial security of the Lloyd’s market as a whole is regularly assessed by three independent rating agencies (A.M. Best, S&P and Fitch). Syndicates at Lloyd’s take their financial security rating from the rating of the Lloyd’s market.
•Intervention Powers. The Council of Lloyd’s has wide discretionary powers to regulate members’ underwriting at Lloyd’s, including, the power to withdraw a member’s permission to underwrite business or to underwrite a particular class of business and to change the basis on which syndicate expenses are allocated.
•Assessments. If the Council of Lloyd’s determines that additional resources are required for the Central Fund, it may require underwriting members to make additional contributions, including by calling all or part of members’ “callable contributions,” the level and calculation basis of which is set by the Council of Lloyd’s from time to time.
Disclosure and Reporting Requirements
RSML is required to provide Lloyd’s with annual financial statements for Syndicate 1458. These financial statements are then published and made publicly available by Lloyd’s on the Lloyd’s website.
Capital and Surplus Requirements
Following “Brexit,” with effect from December 31, 2024, the capital adequacy of insurers and reinsurers in the U.K., including Syndicates at Lloyd’s is determined under the PRA’s prudential regime for insurers commonly referred to as “Solvency UK.” Solvency UK reforms the PRA’s previous prudential regulation framework, Solvency II, which was established by EU law and transposed into U.K. law. Under Solvency UK, an insurer’s or reinsurer’s capital adequacy in relation to various insurance and business risks may be measured with an internal model developed by the insurer or reinsurer and approved for use by the PRA.
RREAG, UK Branch is not required to hold capital at the branch level. In light of this and related matters, the PRA granted various modifications and waivers to RREAG, UK Branch from its Solvency UK regulatory reporting requirements.
Lloyd’s is subject to an annual PRA solvency test which measures whether Lloyd’s has sufficient assets in the aggregate to meet all outstanding liabilities of its members, both current and run-off. If Lloyd’s fails this test, the PRA may require the entire Lloyd’s market to cease underwriting or individual Lloyd’s members may be required to cease or reduce their underwriting.
Change of Control
Prior approval from the PRA (with consent from the FCA) and Lloyd’s is required before any person or entity, together with its associates, acquires “control” of a regulated insurer, reinsurer, or Lloyd’s managing agent and prior approval is required from Lloyd’s in respect of a corporate member. Any company or individual that, together with its or his associates, acquires or controls 10% or more of the shares or voting power in a regulated insurer, reinsurer, Lloyd’s managing agent, or corporate member or its parent company, would be considered to have acquired control for these purposes, as would a person who had significant influence over the management of such entity or its parent company by virtue of their shareholding or voting power in either. A purchaser of 10% or more of RenaissanceRe’s common shares or voting power would therefore be considered to have acquired control of RSML or RenaissanceRe CCL.
Swiss Regulation
Overview
RREAG is a reinsurance company licensed and supervised by the Swiss Financial Market Supervisory Authority FINMA, or FINMA. As such, RREAG must comply with Swiss insurance supervisory law and regulations applicable to reinsurers. RREAG maintains branch operations in Australia, Bermuda, the U.K. and the U.S., each in accordance with applicable local regulations. In addition, the group affiliate
25
RenaissanceRe Services of Switzerland AG must comply with applicable provisions of the Swiss Financial Services Act to continue its distribution activities for insurance-linked securities.
Adequacy of Financial Resources
RREAG must comply with capital, solvency, and reserve requirements, such as the Swiss Solvency Test, or SST, under applicable Swiss regulations, including the Insurance Supervision Act and the Insurance Supervision Ordinance. Certain of these requirements may be determined by FINMA. The solvency requirement of the SST is met if the available risk-bearing capital exceeds the required target capital. The SST has been recognized by the EU as an equivalent standard to European standards. At December 31, 2025, we believe RREAG exceeded the minimum solvency and capital requirements required to be maintained under Swiss law. These and other regulations limit the amount of capital that RREAG may distribute to its holding company parent.
Additional Regulatory Requirements
RREAG is subject to additional regulatory requirements under Swiss law, including the following:
•Reporting and Disclosure Requirements. RREAG is required to submit an annual report (including audited financial statements and a management report), FCR, an annual supervisory report, and a forward-looking self-assessment of its risk situation and capital requirements, or ORSA, to FINMA each year. RREAG is also required to maintain and update with FINMA a regulatory business plan, including details on their organization, financials, qualified participants, management, oversight, control persons, and responsible actuary. RREAG must notify FINMA of any changes to its business plan, and FINMA is required to approve certain changes.
•Dividends and Distributions. RREAG may only distribute dividends out of its retained earnings or distributable reserves based on the audited annual accounts. Any distribution of dividends may be subject to the approval of FINMA (as a change of the regulatory business plan) if they have a bearing on the solvency of the reinsurer and/or the interests of the insured.
Change of Control
Any person who intends to directly or indirectly participate in RREAG with a participation reaching or exceeding the thresholds of 10% of the capital or voting rights in RREAG must notify FINMA. Moreover, any participant of RREAG must notify FINMA if it changes its participation to cross below certain thresholds of the capital or voting rights in RREAG.
Irish Regulation
Renaissance Reinsurance of Europe DAC is a non-life insurance company licensed and supervised by the Central Bank of Ireland. As such, it is subject to the requirements of Solvency II. It must also comply with Irish insurance acts and regulations as well as with directions and guidance issued by the CBI. Renaissance Reinsurance of Europe DAC and Renaissance Services of Europe Ltd., our Dublin-based Irish service company, are both registered with the Companies Registration Office in Ireland and subject to the Companies Act 2014.
RenaissanceRe Medici ICAV is an Irish collective asset-management vehicle established pursuant to the Irish Collective Asset-management Vehicles Act 2015 and the European Communities (Undertakings for Collective Investment in Transferable Securities) Regulations 2011. The ICAV is authorized by the CBI as an umbrella fund with segregated liability between sub-funds.
Additional Regulation
Certain of our other branches and affiliated entities are subject to regulation in other jurisdictions, including those described below. We do not regard the effect of these regulations to be material to us at this time.
•Singapore: Branches of Renaissance Reinsurance and DaVinci Reinsurance based in the Republic of Singapore have each received a license to carry on insurance business as a general reinsurer and are regulated by ACRA as a foreign company pursuant to Singapore’s Companies Act.
26
Renaissance Services of Asia Pte. Ltd., our Singapore-based service company, is registered with ACRA and subject to Singapore’s Companies Act.
•Australia: RREAG, Australia Branch, based in Sydney, Australia, provides coverage to insurers and reinsurers, principally, from Australia and New Zealand. The activities of RREAG, Australia Branch are licensed and regulated by APRA and the Australian Securities and Investments Commission. Pursuant to these regulations, RREAG, Australia Branch is subject to certain reporting and capital requirements in Australia.
27
GLOSSARY OF DEFINED TERMS
“2024 Large Loss Events” | Hurricanes Milton and Helene, and the Other 2024 Large Loss Events | ||||
“2025 Large Loss Events” | a series of wildfires that burned throughout southern California in January 2025 (the “California Wildfires”), Hurricane Melissa and the Other 2025 Large Loss Events | ||||
| “ACR” | additional case reserves | ||||
“AIG” | American International Group, Inc., a Delaware corporation and NYSE-listed company (together with its affiliates and subsidiaries) | ||||
“AlphaCat Funds” | collectively, certain third-party closed-end and open-end Bermuda mutual funds and one managed account that are managed by AlphaCat Managers. | ||||
“AlphaCat Managers” | AlphaCat Managers Ltd. | ||||
“AlphaCat Re” | AlphaCat Reinsurance Ltd. | ||||
“A.M. Best” | A.M. Best Company, Inc. | ||||
“ACRA” | Accounting and Corporate Regulatory Authority | ||||
“APRA” | Australian Prudential Regulation Authority | ||||
“ASC” | Accounting Standards Codification | ||||
“Baltimore Bridge Collapse” | the collapse of the Francis Scott Key Bridge in Baltimore following a collision with a cargo ship in March 2024 | ||||
“BEPS” | Base Erosion and Profit Shifting | ||||
“BMA” | Bermuda Monetary Authority | ||||
“Board” | the Board of Directors of RenaissanceRe Holdings Ltd. | ||||
“BSCR” | Bermuda solvency and capital requirement | ||||
“CIT” | Corporate Income Tax Act 2023 | ||||
“Code of Ethics” | RenaissanceRe’s Code of Ethics and Conduct | ||||
“ComFrame” | Common Framework for the Supervision of Internationally Active Insurance Groups | ||||
“DaVinci” | DaVinciRe Holdings Ltd. and its subsidiaries | ||||
“DaVinci Reinsurance” | DaVinci Reinsurance Ltd. | ||||
“ECR” | Enhanced Capital Requirement | ||||
“ERM” | enterprise risk management | ||||
“EU” | European Union | ||||
“Exchange Act” | the Securities Exchange Act of 1934, as amended | ||||
“FAL” | a deposit that must be submitted to support the underwriting capacity of a member of Lloyd’s | ||||
“FASB” | Financial Accounting Standards Board | ||||
“FCA” | U.K. Financial Conduct Authority | ||||
“FCR” | financial condition report | ||||
“FINMA” | Swiss Financial Market Supervisory Authority | ||||
“Fitch” | Fitch Ratings Ltd. | ||||
| “Fontana” | Fontana Holdings L.P. and its subsidiaries | ||||
“Fontana Re” | Fontana Reinsurance Ltd. | ||||
“Fontana US” | Fontana Reinsurance U.S. Ltd. | ||||
“Form 10-K” | this Annual Report on Form 10-K for the year ended December 31, 2025 | ||||
“GAAP” | generally accepted accounting principles in the U.S. | ||||
“GloBE Rules” | global anti-base erosion model rules, approved by the OECD/G20 Inclusive Framework on BEPS | ||||
“IAIG” | Internationally Active Insurance Groups | ||||
“IAIS” | International Association of Insurance Supervisors | ||||
28
| “IBNR” | incurred but not reported | ||||
“Insurance Act” | Bermuda Insurance Act 1978 | ||||
| “MIA” | Maryland Insurance Administration | ||||
“Medici” | RenaissanceRe Medici Fund Ltd. | ||||
| “Medici UCITS” | RenaissanceRe Medici UCITS Fund | ||||
“Moody’s” | Moody’s Investors Service | ||||
“NOC1” | NOC1, a segregated account of Upsilon Fund | ||||
“NYDFS” | New York State Department of Financial Services | ||||
“NYSE” | New York Stock Exchange | ||||
“OECD” | Organisation for Economic Co-operation and Development | ||||
| “OFAC” | U.S. Treasury’s Office of Foreign Assets Control | ||||
“ORSA” | Own Risk and Solvency Assessment | ||||
“Other 2024 Large Loss Events” | the Baltimore Bridge Collapse, a series of severe convective storms impacting the Southern and Midwest United States, the Hualien earthquake which impacted Taiwan in April 2024, a severe hailstorm which impacted Calgary in August 2024, Hurricanes Debby and Beryl, and certain aggregate loss contracts triggered during 2024 | ||||
“Other 2025 Large Loss Events” | the crash of American Airlines flight 5342, certain refinery fires in the first quarter of 2025, the crash of UPS Airlines flight 2976, and the Grasberg mine landslide | ||||
“PFIC” | passive foreign investment company | ||||
“PGGM” | PGGM Vermogensbeheer B.V. | ||||
“Pillar II Rules” | the GloBE Rules and the OECD commentary and administrative guidance interpreting and expanding the GloBE Rules | ||||
| “Platinum” | Platinum Underwriters Holdings, Ltd. | ||||
| “PRA” | U.K. Prudential Regulatory Authority | ||||
| “Proxy Statement” | Proxy Statement for the Annual General Meeting of Shareholders to be held on May 5, 2026 | ||||
“REMS©” | Renaissance Exposure Management System | ||||
“Renaissance Reinsurance” | Renaissance Reinsurance Ltd. | ||||
“Renaissance Reinsurance of Europe DAC” | Renaissance Reinsurance of Europe Designated Activity Company | ||||
| “Renaissance Reinsurance U.S.” | Renaissance Reinsurance U.S. Inc. | ||||
“RenaissanceRe” | RenaissanceRe Holdings Ltd. | ||||
“RenaissanceRe CCL” | RenaissanceRe Corporate Capital (UK) Limited | ||||
“RenaissanceRe Finance” | RenaissanceRe Finance Inc. | ||||
“RenaissanceRe Group” | RenaissanceRe group of companies | ||||
“RenaissanceRe Specialty U.S.” | RenaissanceRe Specialty U.S. Ltd. | ||||
“RFM” | RenaissanceRe Fund Management Ltd. | ||||
“RREAG” | RenaissanceRe Europe AG | ||||
“RREAG, Australia Branch” | RenaissanceRe Europe AG, Australia Branch | ||||
“RREAG, Bermuda Branch” | RenaissanceRe Europe AG, Bermuda Branch, an overseas company that has been granted a permit from the Minister of Finance to engage in or carry on any trade or business pursuant to the Companies Act and which is also registered to carry on insurance business as a Class 4 insurer pursuant to the Insurance Act in Bermuda | ||||
“RREAG, UK Branch” | RenaissanceRe Europe AG, UK Branch | ||||
“RREAG, US Branch” | RenaissanceRe Europe AG, US Branch | ||||
“RSML” | RenaissanceRe Syndicate Management Ltd. | ||||
29
“RUM” | Renaissance Underwriting Managers, Ltd. | ||||
“S&P” | Standard and Poor’s Rating Services | ||||
“SEC” | U.S. Securities and Exchange Commission | ||||
“Securities Act” | Securities Act of 1933, as amended | ||||
“SPI” | special purpose insurer | ||||
“SST” | Swiss Solvency Test | ||||
“State Farm” | State Farm Mutual Automobile Insurance Company | ||||
“Stock Purchase Agreement” | Stock Purchase Agreement, dated May 22, 2023, among RenaissanceRe Holdings Ltd. and AIG, as amended | ||||
“Stratos” | Stratos, a segregated account of Upsilon Fund | ||||
“Syndicate 1458” | RenaissanceRe Syndicate 1458 | ||||
“TMR” | collectively, Tokio Millennium Re AG and certain associated entities and subsidiaries | ||||
“Top Layer” | Top Layer Reinsurance Ltd. | ||||
“Tower Hill Companies” | collectively, our investments in a group of Tower Hill affiliated companies including Bluegrass Insurance Management, LLC, Tower Hill Claims Service, LLC, Tower Hill Holdings, Inc., Tower Hill Insurance Group, LLC, Tower Hill Insurance Managers, LLC, Tower Hill Re Holdings, Inc., Tower Hill Risk Management LLC and Tomoka Re Holdings, Inc. | ||||
“U.K.” | United Kingdom | ||||
“U.S. persons” | a citizen or resident of the United States, a U.S. partnership or corporation, or an estate or trust that is not a foreign estate or trust | ||||
“U.S. Treasury” | U.S. Department of the Treasury | ||||
“U.S.” | United States of America | ||||
| “Upsilon” | collectively, Upsilon Fund and Upsilon RFO | ||||
“Upsilon Diversified” | RenaissanceRe Upsilon Diversified Fund, a segregated account of Upsilon Fund | ||||
“Upsilon Fund” | RenaissanceRe Upsilon Fund Ltd. | ||||
“Upsilon RFO” | Upsilon RFO Re Ltd. | ||||
“Validus” | Validus Holdings, Validus Specialty, and their respective subsidiaries that were acquired in the Validus Acquisition (including Validus Re and Validus Holdings (UK) Ltd), collectively | ||||
“Validus Acquisition” | The acquisitions under the Stock Purchase Agreement, together with the other transactions contemplated in the Stock Purchase Agreement. | ||||
“Validus Re” | Validus Reinsurance, Ltd. | ||||
“Validus Switzerland” | Validus Reinsurance (Switzerland) Ltd | ||||
“Vermeer” | Vermeer Reinsurance Ltd. | ||||
“VIE” | variable interest entity | ||||
30
GLOSSARY OF SELECTED (RE)INSURANCE TERMS
| Accident year | Year of occurrence of a loss. Claim payments and reserves for claims and claim expenses are allocated to the year in which the loss occurred for losses occurring contracts and in the year the loss was reported for claims made contracts. | ||||
| Acquisition expenses | The aggregate expenses incurred by a company for acquiring new business, including commissions, underwriting expenses, premium taxes and administrative expenses. | ||||
| Additional case reserves; ACR | Additional case reserves represent management’s estimate of reserves for claims and claim expenses that are allocated to specific contracts, less paid and reported losses by the client. | ||||
| Attachment point | The dollar amount of loss (per occurrence or in the aggregate, as the case may be) above which excess of loss reinsurance becomes operative. | ||||
| Bordereaux | A report providing premium or loss data with respect to identified specific risks. This report is periodically furnished to a reinsurer by the ceding insurers or reinsurers. | ||||
| Bound | A (re)insurance contract is considered bound, and the (re)insurer responsible for the risks of the contract, when both parties agree to the terms and conditions set forth in the contract. | ||||
| Broker | An intermediary who negotiates contracts of insurance or reinsurance, receiving a commission for placement and other services rendered, between (1) a policy holder and a primary insurer, on behalf of the insured party, (2) a primary insurer and reinsurer, on behalf of the primary insurer, or (3) a reinsurer and a retrocessionaire, on behalf of the reinsurer. | ||||
| Capacity | The percentage of surplus, or the dollar amount of exposure, that an insurer or reinsurer is willing or able to place at risk. Capacity may apply to a single risk, a program, a line of business or an entire book of business. Capacity may be constrained by legal restrictions, corporate restrictions or indirect restrictions. | ||||
| Case reserves | Loss reserves, established with respect to specific, individual reported claims. | ||||
| Casualty insurance or reinsurance | Insurance or reinsurance that is primarily concerned with the losses caused by injuries to third persons and their property (in other words, persons other than the policyholder) and the legal liability imposed on the insured resulting therefrom. Also referred to as liability insurance. | ||||
| Catastrophe | A severe loss, typically involving multiple claimants. Common perils include earthquakes, hurricanes, hailstorms, severe winter weather, floods, fires, tornadoes, typhoons, explosions and other natural or man-made disasters. Catastrophe losses may also arise from acts of war, acts of terrorism and political instability. | ||||
| Catastrophe excess of loss reinsurance | A form of excess of loss reinsurance that, subject to a specified limit, indemnifies the ceding company for the amount of loss in excess of a specified retention with respect to an accumulation of losses resulting from a “catastrophe.” | ||||
| Catastrophe-linked securities; cat-linked securities | Cat-linked securities are generally privately placed fixed income securities where all or a portion of the repayment of the principal is linked to catastrophic events. This includes securities where the repayment is linked to the occurrence and/or size of, for example, one or more hurricanes or earthquakes, or insured industry losses associated with these catastrophic events. | ||||
| Cede; cedant; ceding company | When a party reinsures its liability with another, it “cedes” business and is referred to as the “cedant” or “ceding company.” | ||||
31
| Claim | Request by an insured or reinsured for indemnification by an insurance company or a reinsurance company for losses incurred from an insured peril or event. | ||||
| Claims made contracts | Contracts that cover claims for losses occurring during a specified period that are reported during the term of the contract. | ||||
| Claims and claim expense ratio, net | The ratio of net claims and claim expenses to net premiums earned determined in accordance with either statutory accounting principles or GAAP. | ||||
| Claim reserves | Liabilities established by insurers and reinsurers to reflect the estimated costs of claim payments and the related expenses that the insurer or reinsurer will ultimately be required to pay in respect of insurance or reinsurance policies it has issued. Claims reserves consist of case reserves, established with respect to individual reported claims, additional case reserves and “IBNR” reserves. For reinsurers, loss expense reserves are generally not significant because substantially all of the loss expenses associated with particular claims are incurred by the primary insurer and reported to reinsurers as losses. | ||||
| Combined ratio | The combined ratio is the sum of the net claims and claim expense ratio and the underwriting expense ratio. A combined ratio below 100% generally indicates profitable underwriting prior to the consideration of investment income. A combined ratio over 100% generally indicates unprofitable underwriting prior to the consideration of investment income. | ||||
| Delegated authority | A contractual arrangement between an insurer or reinsurer and an agent whereby the agent is authorized to bind insurance or reinsurance on behalf of the insurer or reinsurer. The authority is normally limited to a particular class or classes of business and a particular territory. The exercise of the authority to bind insurance or reinsurance is normally subject to underwriting guidelines and other restrictions such as maximum premium income. Under the delegated authority, the agent is responsible for issuing policy documentation, the collection of premium and may also be responsible for the settlement of claims. | ||||
| Excess of loss reinsurance or insurance | Reinsurance or insurance that indemnifies the reinsured or insured against all or a specified portion of losses on underlying insurance policies in excess of a specified amount, which is called a “level” or “retention.” Also known as non-proportional reinsurance. Excess of loss reinsurance is written in layers. A reinsurer or group of reinsurers accepts a layer of coverage up to a specified amount. The total coverage purchased by the cedant is referred to as a “program” and will typically be placed with predetermined reinsurers in pre-negotiated layers. Any liability exceeding the outer limit of the program reverts to the ceding company, which also bears the credit risk of a reinsurer’s insolvency. | ||||
| Exclusions | Those risks, perils, or classes of insurance with respect to which the reinsurer will not pay loss or provide reinsurance, notwithstanding the other terms and conditions of reinsurance. | ||||
| Expense override | An amount paid to a ceding company in addition to the acquisition cost to compensate for overhead expenses. | ||||
| Frequency | The number of claims occurring during a given coverage period. | ||||
| Funds at Lloyd’s | Funds of an approved form that are lodged and held in trust at Lloyd’s as security for a member’s underwriting activities. They comprise the members’ deposit, personal reserve fund and special reserve fund and may be drawn down in the event that the member’s syndicate level premium trust funds are insufficient to cover its liabilities. The amount of the deposit is related to the member’s premium income limit and also the nature of the underwriting account. | ||||
32
| Generally Accepted Accounting Principles in the United States | Accounting principles as set forth in the statements of the Financial Accounting Standards Board and related guidance, which are applicable in the circumstances as of the date in question. | ||||
| Gross premiums written | Total premiums for insurance written and assumed reinsurance during a given period. | ||||
| Incurred but not reported; IBNR | Reserves for estimated losses that have been incurred by insureds and reinsureds but not yet reported to the insurer or reinsurer, including unknown future developments on losses that are known to the insurer or reinsurer. | ||||
| Insurance-linked securities | Financial instruments whose values are driven by (re)insurance loss events. Our investments in insurance-linked securities are generally linked to property losses due to natural catastrophes. | ||||
| International Financial Reporting Standards | Accounting principles, standards and interpretations as set forth in opinions of the International Accounting Standards Board which are applicable in the circumstances as of the date in question. | ||||
| Layer | The interval between the retention or attachment point and the maximum limit of indemnity for which a reinsurer is responsible. | ||||
| Line | The amount of excess of loss reinsurance protection provided to an insurer or another reinsurer, often referred to as limit. | ||||
| Line of business | The general classification of insurance written by insurers and reinsurers, e.g., fire, allied lines, homeowners and surety, among others. | ||||
| Lloyd’s | Depending on the context, this term may refer to (a) the society of individual and corporate underwriting members that insure and reinsure risks as members of one or more syndicates (i.e., Lloyd’s is not an insurance company); (b) the underwriting room in the Lloyd’s building in which managing agents underwrite insurance and reinsurance on behalf of their syndicate members (in this sense Lloyd’s should be understood as a market place); or (c) the Corporation of Lloyd’s which regulates and provides support services to the Lloyd’s market. | ||||
| Loss; losses | An occurrence that is the basis for submission and/or payment of a claim. Whether losses are covered, limited or excluded from coverage is dependent on the terms of the policy. | ||||
| Loss reserve | For an individual loss, an estimate of the amount the insurer expects to pay for the reported claim. For total losses, estimates of expected payments for reported and unreported claims. These may include amounts for claims expenses. | ||||
| Managing agent | An underwriting agent which has permission from Lloyd’s to manage a syndicate and carry on underwriting and other functions for a member. | ||||
| Net claims and claim expenses | The expenses of settling claims, net of recoveries, including legal and other fees and the portion of general expenses allocated to claim settlement costs (also known as claim adjustment expenses or loss adjustment expenses) plus losses incurred with respect to net claims. | ||||
| Net claims and claim expense ratio | Net claims and claim expenses incurred expressed as a percentage of net premiums earned. | ||||
| Net premiums earned | The portion of net premiums written during or prior to a given period that was actually recognized as income during such period. | ||||
| Net premiums written | Gross premiums written for a given period less premiums ceded to reinsurers and retrocessionaires during such period. | ||||
| Perils | This term refers to the causes of possible loss in the property field, such as fire, windstorm, collision, hail, etc. In the casualty field, the term “hazard” is more frequently used. | ||||
33
| Profit commission | A provision found in some reinsurance agreements that provides for profit sharing. Parties agree to a formula for calculating profit, an allowance for the reinsurer’s expenses, and the cedant’s share of such profit after expenses. | ||||
| Property insurance or reinsurance | Insurance or reinsurance that provides coverage to a person with an insurable interest in tangible property for that person’s property loss, damage or loss of use. | ||||
| Property per risk | Reinsurance on a treaty basis of individual property risks insured by a ceding company. | ||||
| Proportional reinsurance | A generic term describing all forms of reinsurance in which the reinsurer shares a proportional part of the original premiums and losses of the reinsured. (Also known as pro rata reinsurance, quota share reinsurance or participating reinsurance.) In proportional reinsurance, the reinsurer generally pays the ceding company a ceding commission. The ceding commission generally is based on the ceding company’s cost of acquiring the business being reinsured (including commissions, premium taxes, assessments and miscellaneous administrative expense) and also may include a profit factor. See also “Quota Share Reinsurance.” | ||||
| Quota share reinsurance | A form of proportional reinsurance in which the reinsurer assumes an agreed percentage of each insurance policy being reinsured and shares all premiums and losses accordingly with the reinsured. See also “Proportional Reinsurance.” | ||||
| Reinstatement premium | The premium charged for the restoration of the reinsurance limit of a contract to its full amount after payment by the reinsurer of losses as a result of an occurrence. | ||||
| Reinsurance | An arrangement in which an insurance company, the reinsurer, agrees to indemnify another insurance or reinsurance company, the ceding company, against all or a portion of the insurance or reinsurance risks underwritten by the ceding company under one or more policies. Reinsurance can provide a ceding company with several benefits, including a reduction in net liability on insurances and catastrophe protection from large or multiple losses. Reinsurance also provides a ceding company with additional underwriting capacity by permitting it to accept larger risks and write more business than would be possible without an equivalent increase in capital and surplus, and facilitates the maintenance of acceptable financial ratios by the ceding company. Reinsurance does not legally discharge the primary insurer from its liability with respect to its obligations to the insured. | ||||
| Reinsurance to Close | Also referred to as a RITC, it is a contract to transfer the responsibility for discharging all the liabilities that attach to one year of account of a syndicate into a later year of account of the same or different syndicate in return for a premium. | ||||
| Retention | The amount or portion of risk that an insurer retains for its own account. Losses in excess of the retention level are paid by the reinsurer. In proportional treaties, the retention may be a percentage of the original policy’s limit. In excess of loss business, the retention is a dollar amount of loss, a loss ratio or a percentage. | ||||
| Retrocedant | A reinsurer who cedes all or a portion of its assumed insurance to another reinsurer. | ||||
34
| Retrocessional reinsurance; Retrocessionaire | A transaction whereby a reinsurer cedes to another reinsurer, the retrocessionaire, all or part of the reinsurance that the first reinsurer has assumed. Retrocessional reinsurance does not legally discharge the ceding reinsurer from its liability with respect to its obligations to the reinsured. Reinsurance companies cede risks to retrocessionaires for reasons similar to those that cause primary insurers to purchase reinsurance: to reduce net liability on insurances, to protect against catastrophic losses, to stabilize financial ratios and to obtain additional underwriting capacity. | ||||
| Risks | A term used to denote the physical units of property at risk or the object of insurance protection that are not perils or hazards. Also defined as chance of loss or uncertainty of loss. | ||||
| Solvency II | A set of regulatory requirements that codify and harmonize the EU insurance and reinsurance regulation. Among other things, these requirements impact the amount of capital that EU insurance and reinsurance companies are required to hold. Solvency II came into effect on January 1, 2016. | ||||
Solvency UK | A set of regulatory requirements that codify insurance and reinsurance regulation in the U.K. Among other things, these requirements determine the amount of capital that insurance and reinsurance companies in the U.K. are required to hold. Solvency UK came into effect on December 31, 2024. | ||||
| Specialty lines | Lines of insurance and reinsurance that provide coverage for risks that are often unusual or difficult to place and do not fit the underwriting criteria of standard commercial products carriers. | ||||
| Statutory accounting principles | Recording transactions and preparing financial statements in accordance with the rules and procedures prescribed or permitted by Bermuda, U.S. state insurance regulatory authorities including the National Association of Insurance Commissioners and/or in accordance with Lloyd’s specific principles, all of which generally reflect a liquidating, rather than going concern, concept of accounting. | ||||
| Stop loss | A form of reinsurance under which the reinsurer pays some or all of a cedant’s aggregate retained losses in excess of a predetermined dollar amount or in excess of a percentage of premium. | ||||
| Submission | An unprocessed application for (i) insurance coverage forwarded to a primary insurer by a prospective policyholder or by a broker on behalf of such prospective policyholder, (ii) reinsurance coverage forwarded to a reinsurer by a prospective ceding insurer or by a broker or intermediary on behalf of such prospective ceding insurer or (iii) retrocessional coverage forwarded to a retrocessionaire by a prospective ceding reinsurer or by a broker or intermediary on behalf of such prospective ceding reinsurer. | ||||
| Surplus lines insurance | Any type of coverage that cannot be placed with an insurer admitted to do business in a certain jurisdiction. Risks placed in excess and surplus lines markets are often substandard in respect to adverse loss experience, unusual, or unable to be placed in conventional markets due to a shortage of capacity. | ||||
| Syndicate | A member or group of members underwriting (re)insurance business at Lloyd’s through the agency of a managing agent or substitute agent to which a syndicate number is assigned. | ||||
| Treaty | A reinsurance agreement covering a book or class of business that is automatically accepted on a bulk basis by a reinsurer. A treaty contains common contract terms along with a specific risk definition, data on limit and retention, and provisions for premium and duration. | ||||
| Underwriting | The insurer’s or reinsurer’s process of reviewing applications submitted for insurance coverage, deciding whether to accept all or part of the coverage requested and determining the applicable premiums. | ||||
35
| Underwriting capacity | The maximum amount that an insurance company can underwrite. The limit is generally determined by a company’s retained earnings and investment capital. Reinsurance serves to increase a company’s underwriting capacity by reducing its exposure from particular risks. | ||||
| Underwriting expense ratio | The ratio of the sum of the acquisition expenses and operational expenses to net premiums earned. | ||||
| Underwriting expenses | The aggregate of policy acquisition costs, including commissions, and the portion of administrative, general and other expenses attributable to underwriting operations. | ||||
| Unearned premium | The portion of premiums written representing the unexpired portions of the policies or contracts that the insurer or reinsurer has on its books as of a certain date. | ||||
AVAILABLE INFORMATION
We maintain a website at www.renre.com. The information on our website is not incorporated by reference in this Form 10-K. We make available, free of charge through our website, our Annual Reports on Form 10-K, Quarterly Reports on Form 10-Q, Current Reports on Form 8-K and amendments to those reports filed or furnished pursuant to Section 13(a) or 15(d) of the Exchange Act as soon as reasonably practicable after we electronically file such material with, or furnish such material to, the SEC. We also make available, free of charge from our website, our Audit Committee Charter, Corporate Governance and Human Capital Management Committee Charter, Corporate Governance Guidelines, and Code of Ethics. Such information is also available in print for any shareholder who sends a request to RenaissanceRe Holdings Ltd., Attn: Office of the Corporate Secretary, P.O. Box HM 2527, Hamilton, HMGX, Bermuda. The SEC maintains an internet site that contains reports, proxy and information statements, and other information regarding issuers, including the Company, that file electronically with the SEC. The address of the SEC’s website is www.sec.gov.
ITEM 1A. RISK FACTORS
Factors that could have a material impact on our results of operations or financial condition are outlined below. Additional risks not presently known to us or that we currently deem insignificant may also impair our business or results of operations as they become known or as facts and circumstances change. Any of the risks described below could cause our actual results to differ materially from those in the forward-looking statements contained in this Form 10-K and other documents we file with the SEC:
Risks Related to our (Re)insurance Business
Our exposure to natural and non-natural catastrophic events and circumstances could cause significant variance in, or adversely impact, our financial results.
We have substantial exposure to natural and non-natural catastrophic events and circumstances, such as earthquakes, hurricanes, tsunamis, winter storms, freezes, floods, fires, tornadoes, hailstorms, drought, pandemics, cyber-risks, political unrest, geopolitical uncertainty and instability, war, riots and acts of terrorism. Historically, a relatively large percentage of our coverage exposures has been concentrated in natural disasters in the U.S. Southeast or West Coast, but we have significant exposure to large catastrophic events globally. We cannot predict or eliminate our exposure to these loss events, and as a result, our operating results have historically been, and we expect will continue to be, significantly affected by the frequency and severity of such events.
The occurrence, or nonoccurrence, of catastrophic events, the frequency and severity of which are inherently unpredictable, may cause significant volatility in our quarterly and annual financial results and may materially adversely affect our financial condition, results of operations and cash flows. In addition, we believe that certain factors may continue to increase the number and severity of claims from catastrophic events in the future, including increases in the value and geographic concentration of insured property,
36
increasing risks associated with extreme weather events because of changes in climate conditions and sea-level rise, and the effects of higher-than-expected inflation.
The trend towards increasingly frequent and severe climate events could exacerbate our potential exposure to losses from natural perils.
Our largest estimated economic exposures arise from natural disasters and other catastrophes. We believe the consensus view of current scientific studies substantiates that the trend towards increased severity and frequency of weather-related natural disasters and catastrophes arises in part from climate change. In addition, we believe that climate-related change and shifting economic and demographic trends in catastrophe exposed regions may contribute to increases in the average economic value of expected losses. Further, we believe that the recent increase in catastrophic events is indicative of both permanent climate change impacts and transient climate variability.
A substantial portion of our property coverages may be adversely impacted by climate-related developments. While we have invested heavily to understand the influence of climate change on the weather and its impact on the risks that we take, we cannot predict with certainty the frequency or severity of tropical cyclones, wildfires or other natural catastrophes, and our risk assessments may not accurately reflect shifting environmental and climate-related risks. Unanticipated factors could lead to additional insured losses that exceed our current estimates, resulting in disruptions to or adverse impacts on our business, the market, or our clients. Further, some of our investments, such as catastrophe-linked securities and property catastrophe joint ventures or managed funds, could also be adversely affected by climate-related developments.
Our claims and claim expense reserves are subject to inherent uncertainties, and if actual claims exceed our reserves, our financial results could be adversely affected.
Our results of operations and financial condition depend upon our ability to accurately assess the potential losses associated with the risks that we insure and reinsure. Our claims and claim expense reserves reflect our estimates of these potential losses. We use actuarial and computer models, historical reinsurance and insurance industry loss statistics, and management’s experience and judgment to assist in the establishment of appropriate claims and claim expense reserves. See “Part I, Item 1. Business—Underwriting and Enterprise Risk Management.” We revise our estimates and judgments as additional experience and other data become available, as new or improved methodologies are developed, as loss trends and claims inflation impact future payments, or as rules and regulations change.
Due to the assumptions and estimates involved in establishing reserves, they are inherently uncertain. As information emerges and losses are paid, we expect that some of our assumptions or estimates will change, perhaps materially, and that our actual net claims and claim expenses paid and reported will differ, perhaps materially, from the reserve estimates reflected in our financial statements. For example, our significant gross and net reserves associated with the large catastrophe events of the past several years remain subject to significant uncertainty.
To the extent we determine that our claims and claim expense reserves are inadequate, we may be required to increase or decrease these reserves at the time of the determination and take charges in our consolidated statements of operations, reducing our net income and available capital. Conversely, if our reserving estimates are too conservative, it could impede our ability to grow our business. Our claims reserves are large, and a small percentage increase to those liabilities could materially adversely affect our financial condition and results of operations.
Emerging claim and coverage issues, or other litigation, could adversely affect us.
Unanticipated developments in the law as well as changes in social conditions could result in unexpected claims for coverage under our insurance and reinsurance contracts. These developments and changes may adversely affect us, perhaps materially, by, for example, imposing additional coverage obligations beyond our underwriting intent or increasing the number or size of claims to which we are subject. We believe that our underwriting results have been adversely impacted over recent periods by increasing fraud and abuses at the primary claims level, as well as other forms of social inflation, and that these trends may continue.
37
These legal and social changes and their impact may not become apparent until some time after their occurrence. Our exposure to these uncertainties could be exacerbated by social inflation trends, including increased litigation, expanded theories of liability and higher jury awards. The full effects of these and other unforeseen emerging claims and coverage issues are extremely difficult to predict. As a result, the full extent of our liability under our coverages may not be known for many years after a contract is issued. Furthermore, we expect that our exposure to this uncertainty is more pronounced in our casualty business, because in these “long-tail” lines claims can typically be made for many years, making them more susceptible to these trends than our property and specialty businesses, which are generally more “short-tail.”
We depend on a few insurance and reinsurance brokers for a preponderance of our business, and any loss of business provided by them could adversely affect us.
We market our insurance and reinsurance products worldwide through a limited number of insurance and reinsurance brokers, with three brokerage firms (Aon plc, Marsh & McLennan Companies, Inc. and Arthur J. Gallagher) accounting for 81.3% of our gross premiums written. As a result, the loss of a broker, through a merger, acquisition or otherwise, could result in the loss of a substantial portion of our business, which would reduce our premium volume and could have a material adverse effect on us. Further, due to the concentration of our brokers, they may have increased power to dictate the terms and conditions of our arrangements with them, which could have a negative impact on our business.
The (re)insurance industry is historically cyclical and the pricing and terms for our products may decline, which would affect our profitability and ability to maintain or grow premiums.
The (re)insurance industry has historically been cyclical by product and market. We are at a relatively attractive point in the cycle, characterized by price adequacy and stable terms and conditions. However, rates recently have, and may in the future, decrease in certain lines of business. If demand for our products falls or the supply of competing capacity continues to rise, our prospects for potential growth may be adversely affected. In particular, we might lose existing customers or suffer a decline in business during shifting market cycles, which we might not regain when industry conditions improve.
We believe the reinsurance industry will remain cyclical, and that we may return to soft market conditions in the future. Additionally, it is possible that increased access to capital, new technologies, including artificial intelligence, and other factors may reduce the duration or eliminate or significantly lessen the impact of any current or future hard reinsurance underwriting market. The cumulative impact of these risks could negatively impact our profitability and ability to maintain or grow premiums.
Retrocessional reinsurance may not be available to us on acceptable terms or provide the coverage we intended to obtain, or we may not be able to collect on claimed retrocessional coverage.
The retrocessional reinsurance that we purchase for our own account is generally subject to annual renewal. Even when reinsurance market conditions in general are strong, retrocessional market conditions may limit or prevent us from obtaining desired amounts of retrocessional reinsurance. For example, large catastrophe events have limited, and may in the future limit us from obtaining desired amounts of coverage on favorable terms. This could limit the amount of business we are willing to write or decrease the protection available to us following large loss events.
When we purchase reinsurance or retrocessional reinsurance for our own account, complex coverage issues or coverage disputes may impede our ability to collect amounts we believe we are owed. We have significant reinsurance recoverables, and the insolvency of any of our reinsurers, or the inability or reluctance of any of our reinsurers to make timely payments to us under the terms of our reinsurance agreements, could have a material adverse effect on us.
In addition, a large portion of our reinsurance protection is concentrated with a relatively small number of reinsurers, which could increase credit risk and may make it difficult to negotiate favorable terms and conditions. The risk of such concentration of retrocessional coverage may be increased by recent and future consolidation within the industry.
38
We are exposed to the procedures and expertise of ceding companies and delegated authority counterparties, who may fail to accurately assess the risks they underwrite, which exposes us to operational and financial risks.
We do not separately underwrite each primary risk assumed under our reinsurance contracts or pursuant to our delegated authority business. Accordingly, we are heavily dependent on the original underwriting decisions made by our ceding companies and delegated authority counterparties, who may not have adequately evaluated the risks to be reinsured. As a result, the premiums they cede to us may not properly compensate us for the risks we assume, which could materially adversely affect our financial condition. In addition, it is possible that our delegated authority counterparties or other counterparties authorized to bind and manage policies on our behalf have failed, or may in the future fail, to comply with regulatory requirements, such as those relating to sanctions, or our own standards regarding underwriting and reputational risk tolerance, which could lead to increased regulatory and operational burden, among other risks. Delegated authority counterparties may also fail to handle claims properly and in accordance with accepted claims handling practices, including regulatory standards, which may expose us to financial or reputational risks. To the extent we continue to increase the proportional coverages we offer, we will increase our aggregate exposure to risks of this nature.
A decline in our financial strength ratings may adversely impact our business, perhaps materially.
Financial strength ratings are used by ceding companies and reinsurance intermediaries to assess the financial strength and quality of reinsurers and insurers. Rating agencies evaluate us periodically and may downgrade or withdraw their financial strength ratings if we do not continue to meet their criteria. In addition, rating agencies may make changes in their capital models and rating methodologies, which could increase the amount of capital required to support our ratings.
A financial strength ratings downgrade or other negative ratings action could adversely affect our ability to compete with other reinsurers and insurers, the marketability of our product offerings, access to and cost of borrowing, and ability to write new business. We could also breach covenants under, or incur higher borrowing costs on, our credit facilities. In addition, if we are downgraded below a certain rating level, nearly all of our reinsurance contracts contain provisions permitting cedants to cancel coverage and/or requiring us to post collateral for our obligations.
For the current financial strength ratings of certain of our subsidiaries and joint ventures and additional ratings information, refer to “Part II, Item 7. Management’s Discussion and Analysis of Financial Condition and Results of Operations—Financial Condition, Liquidity and Capital Resources—Ratings.”
We operate in a highly competitive environment.
Competition and consolidation in the (re)insurance industry could adversely impact us. We face competition from a number of different sources, including insurers and reinsurers, nontraditional competitors and other entities funding reinsurance companies or using other financial products intended to compete with traditional reinsurance.
Competition for customers and access to risk has also increased and become more intense. We expect competition to continue to increase over time. Increased capital from competitors in the market has caused, and may in the future cause reductions in prices of our products or the duration or amplitude of attractive portions of the historical market cycles. Competitors may attempt to replicate all or part of our business model and provide further competition in the markets in which we participate. We could incur greater expenses relating to customer acquisition and retention, further reducing our operating margins. Government sponsored (re)insurance funds or other initiatives may also adversely affect demand for insurance and reinsurance.
Along with increased competition, there has also been significant consolidation in the (re)insurance industry, including among our competitors, customers and brokers. If competitive pressures decrease the prices for our products, we would generally expect to reduce our future underwriting activities, resulting in lower premium volume and profitability. Any of the foregoing could adversely affect our business or results of operations.
39
Large non-recurring contracts and reinstatement premiums may increase the volatility of our financial results.
Our premiums are prone to significant volatility due to factors including the timing of contract inception, as well as our differentiated strategy and capabilities which position us to pursue potentially non-recurring bespoke or large solutions for clients. In addition, after a large catastrophic event or circumstance, we may record significant amounts of reinstatement premium, which can cause quarterly, non-recurring fluctuations in both our written and earned premiums in our Property segment. These and other factors have in the past, and may in the future, increase the volatility of our financial results.
Risks Related to our Strategy and Operations
The loss of key senior members of management and the inability to attract and retain qualified personnel could adversely affect us.
Our success depends upon our ability to attract and retain our senior members of management and to attract and retain additional qualified personnel in the future. The loss of services of members of our senior management team and the uncertain transition of new members of our senior management team may strain our ability to execute our strategic initiatives, or make it more difficult to retain customers, attract or maintain our capital support, or meet other needs of our business. This risk may be particularly acute for us relative to some of our competitors because some of our senior executives work in countries where they are not citizens (such as Bermuda) and work permit and immigration issues could adversely affect the ability to retain or hire key persons.
The preparation of our consolidated financial statements requires us to make many estimates and judgments.
The preparation of our consolidated financial statements requires us to make many estimates and judgments that affect the reported amounts of assets, liabilities (including claims and claim expense reserves), shareholders’ equity, revenues and expenses, and related disclosures. On an ongoing basis, we evaluate our estimates, including those related to premiums written and earned, our net claims and claim expenses, reinsurance recoverable, fair value measurements and impairments and income taxes. We base our estimates on historical experience, where possible, and on various other assumptions we believe to be reasonable under the circumstances, which form the basis for our judgments about the carrying values of assets and liabilities that are not readily apparent from other sources. Our judgments and estimates may not reflect, and may deviate materially from, our actual results. For more details on our estimates and judgments, see “Part II, Item 7. Management’s Discussion and Analysis of Financial Condition and Results of Operations—Summary of Critical Accounting Estimates.”
We are exposed to risks in connection with our management of capital on behalf of investors in joint ventures or other entities we manage.
Certain of our subsidiaries owe legal duties and obligations (including reporting, governance and allocation obligations) to third-party investors in our joint ventures and managed funds. In addition, certain of our operating subsidiaries are registered or authorized investment funds or licensed investment managers subject to laws and regulations relating to the management of third-party capital. Complying with these obligations, laws and regulations requires significant management time and attention. Faulty judgments, simple errors or mistakes, or the failure of our personnel to adhere to established policies and procedures could result in our failure to comply with applicable obligations, laws or regulations, which could result in significant liabilities, penalties or other losses to us and seriously harm our business and results of operations. We are also subject to risks stemming from our relationship to the entities through which we manage capital on behalf of, or transform risk for, investors, and the support that we are required to, or may, provide to them.
In addition, we are exposed to the risk that we may be unable to maintain, attract, or raise new capital for our joint ventures, managed funds and other private alternative investment vehicles, which could reduce our future fee income and market capacity, and thus negatively affect our results of operations and financial condition. For example, it is possible that substantial losses ceded to the alternative capital sector over a period of years, and restraints on capital return and maintenance of collateral for prior loss periods by a
40
number of market participants, may contribute to a reduction in investor appetite to this product class in the near term.
Our third-party capital providers may, subject to restrictions, redeem their interests in our joint ventures and managed funds or we may be unable to attract and raise additional third-party capital for our existing or potential new joint ventures and managed funds. The loss, or alteration in a negative manner, of any of this capital support could cause us to forego fee income and other income-generating opportunities. Any of the foregoing could adversely affect our reputation, business or financial condition and results of operations.
We are subject to cybersecurity risks, which may harm our business or reputation, and which could have an adverse effect on our business strategy, results of operations, or financial condition.
Cybersecurity threats and incidents have increased in recent years, and we continue to be subject to heightened cyber-related risks. Our business depends on the proper functioning and availability of our information technology platforms, including communications and data processing systems and our proprietary systems. We are also required to effect electronic transmissions with third parties including brokers, clients, vendors and others with whom we do business, as well as with our Board. We cannot guarantee that the controls and procedures we or third parties have in place to protect or recover our systems and information will be effective, successful or sufficiently rapid to avoid harm to our business or reputation. We also maintain cybersecurity insurance, but such coverage may not cover all costs associated with a breach, interruption or widespread failure of our information technology systems.
Security incidents and breaches involving the systems of third parties that have our information, or our system, have in the past and may in the future occur, exposing us to a risk of loss or misuse of our information, litigation, and potential liability. In addition, cyber incidents, such as ransomware attacks, that impact the availability, reliability, speed, accuracy or other proper functioning of our systems could have a significant impact on our operations and financial results. We may not have the resources or technical sophistication to prevent, detect or stop a cyberattack. A significant cyber incident, including system failure, security breach, disruption by malware or other damage could interrupt or delay our operations, result in a violation of applicable cybersecurity and privacy and other laws, damage our reputation, cause a loss of customers or expose sensitive customer data, or give rise to monetary fines and other penalties, which could be significant. While management is not aware of any cybersecurity or information security incident or breach that has had a material effect on our operations, there can be no assurances that a cybersecurity incident that could have a material impact on us has not occurred or will not occur in the future. In addition, artificial intelligence technologies are quickly evolving and being adopted, which may increase or intensify potential cybersecurity risks.
The cybersecurity regulatory environment is evolving, in particular with respect to emerging technologies, such as artificial intelligence, and it is likely that the costs of complying with new or developing regulatory requirements will increase. In addition, we operate in a number of jurisdictions with strict data privacy and other related laws, which could be violated in the event of a significant cybersecurity incident or in the event of noncompliance by our personnel. Failure to comply with these obligations can give rise to fines and other penalties, which could be significant. We also have exposure to cybersecurity risks through coverage that we write in our cyber line of business.
See “Part I, Item 1C. Cybersecurity” for additional information related to information technology and cybersecurity.
We may from time to time modify our business and strategic plan, and these changes could adversely affect us and our financial condition.
We frequently monitor and analyze opportunities to acquire or make strategic investments in new or other businesses. The negotiation of potential acquisitions or strategic investments as well as the integration of an acquired business could be unsuccessful, result in a substantial diversion of management resources, or lead to other unanticipated risks or challenges. In addition, while our current business strategy focuses predominantly on writing reinsurance, we also write insurance business, such as excess and surplus lines insurance through delegated authority arrangements. Risks associated with implementing or changing our business strategies and initiatives, including risks related to developing or enhancing our operations, controls and other infrastructure, may not have an impact on our publicly reported results until many years
41
after implementation. Our failure to carry out our business plans may have an adverse effect on our long-term results of operations and financial condition.
The covenants in our debt agreements limit our financial and operational flexibility, which could have an adverse effect on our financial condition.
We have incurred indebtedness and may incur additional indebtedness in the future. For more details, see “Part II, Item 7. Management’s Discussion and Analysis of Financial Condition and Results of Operations—Financial Condition, Liquidity and Capital Resources—Capital Resources.”
The agreements governing our indebtedness require us and/or certain subsidiaries to comply with covenants that impose financial or operational restrictions, including requirements to maintain specific financial ratios or contain cross-default provisions to our other indebtedness. Failure to comply with these or other covenants could result in an event of default, an acceleration of repayment obligations, cross-default, or a loss of borrowing capacity if not cured or waived. Any such event could have a material adverse effect on our liquidity, financial condition, and results of operations.
The determination of impairments taken is highly subjective and could materially impact our financial condition or results of operations.
The determination of impairments taken on our investments, investments in other ventures, goodwill and other intangible assets and loans varies by type of asset and is based upon our periodic evaluation and assessment of known and inherent risks associated with the respective asset class. Such evaluations and assessments are revised as conditions change and new information becomes available. Management updates its evaluations regularly and reflects impairments in operations as such evaluations are revised. We cannot assure you that we have accurately assessed the level of impairments taken in our financial statements. Furthermore, management may determine that impairments are needed in future periods and any such impairment will be recorded in the period in which it occurs, which could materially impact our financial condition or results of operations. Historical trends may not be indicative of future impairments.
Risks Related to the Economic Environment
A decline in our investment performance could reduce our profitability and capital resources.
We have historically derived a meaningful portion of our income from our invested assets, which are principally comprised of fixed maturity securities. Accordingly, our financial results are subject to a variety of investment risks, including risks relating to general economic conditions, inflation, market volatility, interest rate fluctuations, foreign currency risk, commodity risk, liquidity risk and credit and default risk. Volatility in global financial markets has impacted, and may continue to impact, the value of our investment portfolio and our strategic investments. Additionally, some of our investments are subject to prepayment or reinvestment risk. Our investment portfolio also includes securities with longer durations, which may be more susceptible to risks such as inflation. Changes in various factors, including prevailing interest rates and credit spreads may cause fluctuations in the market value of our fixed maturity investments. While the Federal Reserve reduced the federal funds target rate in 2025, further increases in interest rates could cause the market value of our investment portfolio to decrease, which could reduce our capital resources over the near-to medium-term. Conversely, any decline in interest rates could reduce our investment yield and net investment income, which would reduce our overall profitability over the medium- to long-term. Interest rates are highly sensitive to many factors, including governmental and monetary policies, inflation levels, domestic and international economic and political conditions, and other factors beyond our control.
A portion of our investment portfolio is allocated to other classes of investments including equity securities, catastrophe bonds, commodity derivatives, and interests in alternative investment vehicles such as private equity investments, private credit investments and hedge funds. For certain investments, under stressed financial conditions, the valuation on our consolidated balance sheets may differ significantly from the values that would be used if ready markets existed for the securities representing interests in the relevant investment vehicles. If we were to sell these assets (which may be necessary if we need liquidity to pay claims), it may be at significantly lower prices than we have recorded them. Furthermore, our interests in some of the investment classes described above are subject to restrictions on redemptions and sales that limit our ability to liquidate these investments in the short term. The performance of these classes of
42
investments is also dependent on individual investment managers and investment strategies. It is possible that these investment managers managing these investments will leave, the investment strategies will become ineffective or that the managers will fail to follow our investment guidelines. Our investment portfolio may become concentrated in a limited number of issuers or have significant exposure to certain geographic areas, economic sectors or economic scenarios. Concentration of investments can increase investment risk and portfolio volatility. Any of the foregoing could result in a decline in our investment performance and capital resources, and accordingly, adversely affect our financial results.
We may be adversely impacted by inflation.
The principal markets in which we operate are susceptible to monetary inflation, which could cause loss costs to increase, impact the performance of our investment portfolio, and borrowing costs to increase. We believe the risks of inflation across our key markets are broadly balanced following a reduction in inflation in the United States and elsewhere. In particular, widespread economic factors such as government deficit spending, wage increases and supply chain disruptions have contributed to, and may continue to contribute to, significant inflationary pressures. The impact of inflation on loss costs could be more pronounced for those lines of business that are long tail in nature, as they require a relatively long period of time to finalize and settle claims. Changes in the level of inflation may also result in an increased level of uncertainty in our estimation of loss reserves, particularly for long tail lines of business, and may require us to strengthen reserves, with a corresponding reduction in our net income in the period in which the deficiency is identified. Unanticipated higher inflation could also lead to higher interest rates, which would decrease or create volatility in the value of our fixed income securities and potentially other investments. Higher inflation may lead to currency fluctuations, and we have in the past, and may in the future, experience increased volatility on foreign exchange gains and losses in our consolidated financial statements as a result. If inflation remains elevated for a prolonged period or increases further, any of the risks described above could be exacerbated, and the impact on the global economy generally and on our customers could negatively affect our business, financial condition and results of operations.
We are exposed to counterparty credit risk, which could increase our liabilities and reduce liquidity.
Counterparty credit risk typically increases during periods of economic uncertainty, and we believe our exposure has increased in recent years. In connection with the settlement of reinsurance balances, we assume a substantial degree of credit risk associated with our brokers. In accordance with industry practice, we pay virtually all amounts owed on claims under our policies to reinsurance brokers, who then forward these payments to the ceding insurers that have purchased reinsurance from us. Likewise, premiums due to us by ceding insurers are virtually all paid to brokers, who then pass the amounts to us. Many of our contracts provide that if a broker fails to make a payment to a ceding insurer, we remain liable to the ceding insurer for the deficiency. Conversely, when the ceding insurer pays premiums to brokers for payment to us, these premiums are considered to have been received by us upon receipt by the broker and the ceding insurer is no longer liable to us for those amounts, even if we have not received the premiums.
We are also exposed to the credit risk of our customers, who, pursuant to their contracts with us, frequently pay us over time. We may not collect all our premiums receivable from our ceding insurers and reinsurers, and we may not collect all our reinsurance recoverable from our own retrocessionaires. We have significant premiums receivable and reinsurance recoverable, and our failure to collect even a small portion of these amounts, or a meaningful delay in the collection of recoverables as to which our own underlying obligations are due, could negatively affect our results of operations and financial condition, perhaps materially.
We may be affected by adverse economic factors outside of our control, including a weaker macroeconomic environment, and international socio-political and geopolitical events.
A slowdown in economic activity may result from macroeconomic volatility, central bank policies, and international events involving war or civil, political, or social unrest, or energy prices or from other factors outside of our control. For example, ongoing conflicts globally may expand, which could increase our potential exposures or have far-reaching impacts on the global economy. Additionally, governmental, business and societal responses to such events, such as sanctions, trade restrictions, increased unemployment, and supply chain disruptions could worsen the impact of such events and could have an impact on our business and on our customers’ businesses. Any such events could increase our probability of losses, which may be exacerbated by our exposure to certain lines of business that we write. These
43
events could also reduce the demand for insurance and reinsurance, which would reduce our premium volume and could have a material adverse effect on our business and results of operations.
We may be adversely affected by foreign currency fluctuations.
We routinely transact business in currencies other than the U.S. dollar, our financial reporting currency. Moreover, we maintain a portion of our cash and investments in currencies other than the U.S. dollar, and certain of our subsidiaries use or have used non-U.S. dollar functional currencies. Although we generally seek to hedge significant non-U.S. dollar positions, we have experienced, and may in the future experience, losses resulting from fluctuations in the values of these foreign currencies, which could cause our consolidated earnings to decrease. In addition, failure to manage our foreign currency exposures could cause our results of operations to be more volatile. Our significant third-party capital management operations further complicates these foreign currency operational needs and risk.
We may require additional capital in the future, which may not be available or may only be available on unfavorable terms.
Our exposure to significant catastrophic events may cause significant volatility in our operating and capital needs. To the extent that our existing capital is insufficient to support our future operating requirements, we may need to raise additional funds through financings or limit our growth. Any further equity, debt or hybrid financings if available at all, may be on terms that are unfavorable to us. We are also exposed to the risk that the contingent capital facilities we have in place may not be available as expected. Changes to our credit ratings, or the capital models and rating methodologies used by ratings agencies, may also impact our ability to access capital.
Our contracts generally require us to post such security via a letter of credit, a trust account, or where applicable, utilize a multi-beneficiary reinsurance trust, with the release of such security being controlled by the ceding insurance company and/or a regulator. If we are unable to obtain adequate capital when needed, we may not be able to grow and take advantage of favorable market conditions, or we may be required to reduce the amount of business that we write, impacting our results of operations and financial condition.
Risks Related to Legal and Regulatory Matters
The regulatory systems under which we operate could restrict our ability to operate, increase our costs, or otherwise adversely impact us.
Our operating subsidiaries conduct business globally and are subject to varying degrees of regulation and supervision in multiple jurisdictions. See “Part I, Item 1. Business—Regulation.” These statutes, regulations and policies may, among other things, restrict the ability of our subsidiaries, joint ventures or managed funds to write certain business, make certain investments and distribute funds. We may not be able to comply fully with, or obtain appropriate exemptions from, these statutes and regulations, which could result in restrictions on our ability to do business or undertake activities that are regulated in these jurisdictions, which could subject us to fines and/or penalties. Our current or future business strategy could cause one or more of our subsidiaries to become subject to some form of more onerous regulation in the future. Any failure to comply with current or future applicable laws or regulations could result in restrictions on our ability to do business or undertake activities that are regulated in these jurisdictions, which could subject us to fines and other penalties. In addition, changes in the laws or regulations to which our operating subsidiaries are subject or in their interpretation could have an adverse effect on our business.
Several of our operating subsidiaries are not licensed or admitted in any jurisdiction except Bermuda, conduct business only from their offices in Bermuda and do not maintain offices in the U.S. The insurance and reinsurance regulatory framework continues to be subject to increased scrutiny in many jurisdictions, including the U.S. and Europe. If our Bermuda insurance or reinsurance operations become subject to the insurance laws of any state in the U.S., jurisdictions in the EU, or elsewhere, we could face challenges to the future operations of these companies. We could also be required to allocate considerable time and resources to comply with any new or additional regulatory requirements in any of the jurisdictions in which we operate, and any such requirements could impact the operations of our insurance and/or non-insurance subsidiaries, result in increased costs for us and impact our financial condition.
44
The International Association of Insurance Supervisors has adopted a Common Framework for the Supervision of Internationally Active Insurance Groups, which is focused on both quantitative and qualitative measures that are expected to enhance the group-wide supervision of IAIGs. As part of ComFrame, the IAIS developed global risk-based insurance capital standards that, if applied to us, could increase our prescribed capital requirement, the level of regulatory scrutiny on the level of capital we maintain, limit intercompany capital transactions, suspend debt repayments, and significantly increase our cost of regulatory compliance. The BMA embedded the ComFrame group supervision requirements, including the risk-based insurance capital standards, in the Insurance Act and related regulations in December 2025.
It is possible that individual jurisdiction or cross border regulatory developments could adversely differentiate Bermuda, the jurisdiction in which we are subject to group supervision, or could exclude Bermuda-based companies from benefits such as market access, mutual recognition or reciprocal rights made available to other jurisdictions, which could adversely impact us. Any such development could significantly and negatively affect our operations.
We face risks related to changes in Bermuda law and regulations, and the political environment in Bermuda.
We are incorporated in Bermuda and many of our operating companies are domiciled in Bermuda. Therefore, changes in Bermuda law and regulation may have an adverse impact on our operations, such as increased regulatory supervision or the imposition of corporate income tax. The Corporate Income Tax Act 2023, discussed below, is an example of a material change in Bermuda law.
In addition, we are subject to changes in the political environment in Bermuda, which could make it difficult to operate in, or attract talent to, Bermuda. In addition, Bermuda, which is currently an overseas territory of the U.K., may consider changes to its relationship with the U.K. in the future. These changes could adversely affect Bermuda or the international reinsurance market focused there, either of which could adversely impact us commercially.
Political, regulatory and industry initiatives by state and international authorities could adversely affect our business.
The insurance and reinsurance regulatory framework is subject to heavy scrutiny by the U.S. and individual state governments, as well as a number of international authorities, and we believe it is likely this will continue into the foreseeable future.
We could also be adversely affected by proposals or enacted legislation that provide for reinsurance capacity in markets and to consumers that we target, expand the scope of coverage under existing policies for perils such as hurricanes or earthquakes or for a pandemic disease outbreak, mandate the terms of insurance and reinsurance policies, or establish a new federal insurance regulator or otherwise revise laws, regulations, or contracts under which we operate, which may disproportionately benefit the companies of one country over those of another. Moreover, government-backed entities may represent competition for the coverages we provide, either directly or by competing for the business of our customers, thereby reducing the potential amount of third-party private protection our clients may need or desire.
Bermuda is also subject to increasing scrutiny by political bodies outside of Bermuda, including the EU Code of Conduct Group. Due to this increased legislative and regulatory scrutiny of the reinsurance industry and Bermuda, our cost of compliance with applicable laws may increase, which could result in a decrease to our profitability. Further, as we continue to expand our business operations outside of Bermuda, we are increasingly subject to new and additional regulations, including, for example, laws relating to anti-corruption and anti-bribery.
Our business is subject to certain laws and regulations relating to sanctions and foreign corrupt practices, the violation of which could adversely affect our operations.
We must comply with all applicable economic sanctions and anti-bribery laws and regulations of the U.S. and other jurisdictions. U.S. laws and regulations that may be applicable to us include economic trade sanctions laws and regulations administered by OFAC as well as certain laws administered by the U.S. Department of State. The sanctions laws and regulations of non-U.S. jurisdictions in which we operate may differ from those of the U.S. and these differences may also expose us to sanctions violations.
45
In addition, we are subject to the Foreign Corrupt Practices Act and other anti-bribery laws that generally prohibit corrupt payments or improper gifts to non-U.S. governments or officials. It is possible that an employee or intermediary could fail to comply with applicable laws and regulations. In such event, we could be exposed to civil penalties, criminal penalties and other sanctions, including fines or other punitive actions, which could damage our business and reputation, and could adversely affect our financial condition and results of operations.
Our business may be affected by governmental and societal responses to climate-related matters.
In addition to the potential impacts that environmental events may have on our business, there are also risks to our business related to a transition to a lower carbon economy, including increased governmental and regulatory scrutiny related to climate-related risk and greenhouse gas emissions. Our investment assets may be affected by market shifts away from carbon-intensive sectors, increased costs of greenhouse gases, and reduced profitability in sectors that produce or rely on carbon-based fuels, or by societal or market shifts related to these trends. Additionally, demand for insurance coverage could be negatively impacted to the extent that carbon-intensive businesses are impacted by this transition, and claims and losses related to those industries could increase, either of which could have a material negative effect on our business and results of operations.
Climate-related concerns have led, and may continue to lead, to new regulatory responses. New laws and regulations relating to sustainability and climate-related matters have been adopted and continue to be considered in various jurisdictions. These laws and regulations include specific disclosure requirements or obligations, that may result in additional investments and implementation of new practices and reporting processes, all entailing additional compliance costs and risk. For example, various jurisdictions are in the process of implementing the International Sustainability Standards Board requirements which requires enhanced disclosure of climate and sustainability-related risks, opportunities and impacts. This directive, along with other current or proposed regulations, could significantly increase compliance burdens and associated regulatory costs and complexity.
Risks Related to Taxation
Our Bermuda subsidiaries may be subject to U.S. corporate income tax.
We conduct a significant amount of business through Bermuda subsidiaries that we believe are not subject to U.S. corporate income tax as they are not engaged in a trade or business in the U.S. Since there is considerable uncertainty, however, as to the activities that constitute being engaged in a trade or business within the U.S., we cannot be certain that the U.S. Internal Revenue Service will not contend successfully that any of our non-U.S. companies is engaged in a trade or business in the U.S. Were this to occur, such company could be subject to U.S. corporate income tax and additional branch profits taxes on the portion of its earnings effectively connected to such U.S. trade or business. If we or one or more of our Bermuda subsidiaries were ultimately held to be subject to U.S. taxation, our earnings would correspondingly decline.
Certain U.S. tax provisions could reduce our access to capital, decrease demand for our products, impact our shareholders or investors in our joint ventures or other entities we manage or otherwise adversely affect us.
U.S. persons may be subject to adverse U.S. federal income tax treatment with respect to an investment in our shares under the “controlled foreign corporation,” “related person insurance income,” or PFIC provisions of the U.S. Internal Revenue Code of 1986, as amended. Such provisions may apply to a U.S. person who owns (or is considered to own under applicable tax rules) 10% or more of our shares if RenaissanceRe or any of our non-U.S. subsidiaries is considered a controlled foreign corporation in any year, and to a U.S. person who owns any of our shares if RenaissanceRe is considered a PFIC or any of our non-U.S. subsidiaries generates gross related person insurance income that constitutes 20% or more of its gross insurance income in any year. RenaissanceRe and certain of our non-U.S. subsidiaries may be controlled foreign corporations for these purposes. Further, we believe that RenaissanceRe should not be characterized as a PFIC and currently anticipate that the gross related person insurance income of each of our non-U.S. insurance subsidiaries will constitute less than 20% of its gross insurance income for any taxable year in the foreseeable future. However, the application of these provisions is complex, subject to legal uncertainties and dependent on facts that may change from time to time and of which we may have
46
limited knowledge. Accordingly, we can provide no assurances that any of these provisions will not apply for any taxable year.
In addition, on January 25, 2022, proposed regulations were published that could, if finalized in their current form, substantially expand the definition of related person insurance income to include all insurance income of our non-U.S. subsidiaries related to affiliate reinsurance transactions if U.S. persons own (or are considered to own under applicable tax rules) more than 50% of our shares. These regulations are proposed to apply to taxable years beginning after the date the regulations are finalized. Although we cannot predict whether, when or in what form the proposed regulations might be finalized, if they are finalized in their current form, we may decide not to undertake affiliate reinsurance transactions that would otherwise be undertaken for non-tax business reasons in the future and there may be an increased risk that gross related person insurance income constitutes 20% or more of the gross insurance income of one or more of our non-U.S. insurance subsidiaries in any year.
These tax provisions could adversely impact our shareholders and reduce the attractiveness of an investment in our shares and thus our access to capital. Joint venture entities or other entities managed by us may be subject to similar tax risks, which could make these entities less attractive to investors and reduce our fee income.
Further, we or our shareholders may be the subject of future changes in tax laws, which could reduce our access to capital, decrease demand for our products, impact our shareholders or investors in our joint ventures or other entities we manage or otherwise adversely affect us.
The OECD and the jurisdictions in which we operate may pursue measures that might increase our taxes and reduce our net income and increase our reporting requirements.
The OECD has published reports and launched a global dialog among member and non-member countries on measures to limit harmful tax competition. These measures are largely directed at counteracting the effects of jurisdictions perceived by the OECD to be tax havens or offering preferential tax regimes. In the past, Bermuda has been temporarily added to the EU “blacklist” of non-cooperative jurisdictions for tax purposes, as well as the “greylist” of jurisdictions that have made sufficient commitments to reform their tax policies but remain subject to close monitoring while they are executing on their commitments.
In addition, in December 2021, the OECD/G20 Inclusive Framework on BEPS approved global anti-base erosion model rules (the “GloBE Rules”) that generally would require large multinational groups to calculate the effective tax rate in each of the jurisdictions in which they operate and pay an additional top-up tax where the group’s effective tax rate in a jurisdiction is below 15%. The OECD has issued and is expected to continue to issue commentary and administrative guidance interpreting and expanding the GloBE Rules. Certain jurisdictions where we operate have brought into effect laws implementing all or a portion of the Pillar II Rules or other changes in response to the Pillar II Rules, or are in the process of doing so, and other jurisdictions may do so in the future.
Further, in response to the Pillar II Rules, Bermuda adopted the Corporate Income Tax Act 2023, the “CIT” on December 27, 2023. Effective January 1, 2025, the CIT generally imposes a 15% income tax on our profits generated in Bermuda (except for profits earned by our joint ventures and managed funds), notwithstanding any assurances that may have been provided pursuant to the Exempted Undertakings Tax Protection Act 1966. We generally expect that the profits generated in Bermuda on or after January 1, 2025 by our consolidated joint ventures and managed funds, except to the extent those profits are attributable to redeemable noncontrolling interests, will also be taxed at 15% as a result of the enactment or expected enactment of the Pillar II Rules by many of the jurisdictions in which we operate.
On January 15, 2025, the OECD issued administrative guidance on Article 9.1 of the Pillar II Rules. This guidance, if incorporated into the laws of the jurisdictions in which we operate, could cause additional top-up taxes pursuant to the Pillar II Rules to the extent the net deferred tax asset we established upon enactment of the CIT in 2023 pursuant to the economic transition adjustment (approximately $640 million as of December 31, 2025) reverses after 2026. It is uncertain whether Bermuda or the other jurisdictions in which we operate will amend their laws as a result of this guidance. To the extent the jurisdictions in which we operate incorporate this guidance into their own laws, our future cash tax savings from the reversal of the deferred tax asset could be limited to the portion of the deferred tax asset that is expected to reverse in 2026.
47
Our tax liabilities and reporting obligations have increased and may continue to increase as a result of the implementation of the CIT in Bermuda and the Pillar II Rules in other jurisdictions where we operate. These and any other changes in tax laws, tax treaties or tax regulations or the interpretation or enforcement thereof by taxation authorities in the jurisdictions in which we operate may materially adversely affect our results of operations.
Risks Related to the Ownership of our Securities
Because we are a holding company, we are dependent on capital distributions from our subsidiaries.
As a holding company with no direct operations, we rely on our investment income, cash dividends and other permitted payments from our subsidiaries to make principal and interest payments on our debt and to pay dividends to our shareholders. From time to time, we may not have sufficient liquid assets to meet these obligations. Regulatory restrictions on capital distributions under Bermuda law, Swiss law and various U.S. laws regulate the ability of our subsidiaries to pay dividends or otherwise distribute capital. If our subsidiaries are restricted from distributing capital to us, we may be unable to pay dividends to our shareholders or to repay our indebtedness.
Some aspects of our corporate structure may discourage third-party takeovers and other transactions or prevent the removal of our current board of directors and management.
Some provisions of our bye-laws may discourage third parties from making unsolicited takeover bids or prevent the removal of our current board of directors and management. In particular, our bye-laws prohibit transfers of our capital shares if the transfer would result in a person owning or controlling shares that constitute 9.9% or more of any class or series of our shares, unless otherwise waived at the discretion of the Board. In addition, our bye-laws reduce the total voting power of any shareholder owning, directly or indirectly, beneficially or otherwise, more than 9.9% of our common shares to not more than 9.9% of the total voting power of our shares unless otherwise waived at the discretion of the Board. These provisions may make it more difficult to acquire control of us by means of a tender offer, open market purchase, proxy contest or otherwise and could discourage a prospective acquirer from making a tender offer or otherwise attempting to obtain control of us, even if our shareholders might deem such transactions to be in their best interests. As a result, these provisions could limit the ability of shareholders to realize takeover premiums for their shares or depress the market price of the shares.
In addition, our bye-laws provide for, among other things:
•a classified Board, whose size is generally fixed and whose members may be removed by the shareholders only for cause upon a 66 2/3% vote;
•restrictions on the ability of shareholders to nominate persons to serve as directors, submit resolutions to a shareholder vote and requisition special general meetings;
•a large number of authorized but unissued shares which may be issued by the Board without further shareholder action; and
•a 66 2/3% shareholder vote to amend, repeal or adopt any provision inconsistent with several provisions of the bye-laws.
Some jurisdictions in which our insurance and reinsurance subsidiaries operate have laws and regulations that require regulatory approval of a change in control of an insurer or an insurer’s holding company. Where such laws apply to us and our subsidiaries, there can be no effective change in our control unless the person seeking to acquire control has filed a statement with the regulators and has obtained prior approval for the proposed change from such regulators. Under these laws, control is typically presumed when a person acquires, directly or indirectly, 10% or more of the voting power of the insurance company or its parent, although this presumption is rebuttable.
Investors may have difficulty in serving process or enforcing judgments against us in the U.S.
We are a Bermuda company. In addition, many of our officers and directors reside in countries outside the U.S. All or a substantial portion of our assets and the assets of these officers and directors may be located
48
outside the U.S. Investors may have difficulty effecting service of process within the U.S. on our directors and officers who reside outside the U.S. or recovering against us or these directors and officers on judgments of U.S. courts based on civil liabilities provisions of the U.S. federal securities laws whether or not we appoint an agent in the U.S. to receive service of process.
ITEM 1B. UNRESOLVED STAFF COMMENTS
None.
ITEM 1C. CYBERSECURITY
INFORMATION TECHNOLOGY AND CYBERSECURITY
Our business and support functions utilize information systems that provide critical services to both our employees and our customers. We have an integrated team of professionals who manage and support our communication platforms, transaction-management systems, and analytics and reporting capabilities, including the development of proprietary solutions like REMS©. We use both cloud-based platforms and services and off-site, secure data centers in North America and Europe for our core applications.
Information security and privacy are important concerns, with an escalating cyber-threat environment and evolving regulatory requirements driving continued investment in this area. Our information security program is designed to meet or exceed industry best practices and is integrated into our broader ERM framework. We are subject to a number of cybersecurity and data privacy laws and regulations, such as those promulgated by the BMA, Office of the Privacy Commission, NYDFS, MIA, and the EU. Pursuant to applicable regulations, we have established and maintain a cybersecurity program designed to protect our information technology systems and data. Our program is designed to comply with all applicable cybersecurity regulatory requirements, including disclosure requirements, and we continue to evaluate and assess our compliance in the changing regulatory environment. It is likely that we will be subject to new regulations that could adversely affect our operations or ability to write business profitably in one or more jurisdictions. We cannot predict what, if any, regulatory actions may be taken with regard to “big data” or emerging technologies, such as artificial intelligence, but any actions could have a material impact on our business, business processes, financial condition, and results of operations. In addition, we have at times obtained certain cybersecurity certifications, supported by independent third-party assessments.
Our Board is responsible for overseeing enterprise-wide risk management and is actively involved in the monitoring of risks that could affect us, including cybersecurity risks. Pursuant to its charter, one of the key responsibilities of the Audit Committee of our Board is oversight of our information and cybersecurity programs and it receives regular reports on cybersecurity, information technology and other related matters and risks. The Audit Committee regularly briefs the Board on matters relating to its information technology and cybersecurity risk oversight.
Our Board and its Audit Committee are supported in their oversight of information technology and cybersecurity matters and risks by two management committees, the Operational Risk and Resilience Committee and the Information Security Steering Committee (the “ISSC”), both of which regularly report to the Audit Committee. Our management team typically reports to the Board on cybersecurity matters on a quarterly basis. The ISSC is responsible for providing management oversight for our cybersecurity risk management program, and its membership includes our Chief Technology Officer and Chief Information
49
We have implemented incident response and business continuity and resilience plans for our operations, which are regularly tested with respect to our business-critical infrastructure and systems. We employ data backup procedures that seek to ensure that our key business systems and data are regularly backed up, and can be restored promptly if, and as needed. In addition, we generally store backup information at off-site locations, in order to seek to minimize our risk of loss of key data in the event of a disaster. Our recovery plans involve arrangements with our off-site, secure data centers and cloud infrastructure. We believe we will be able to utilize these plans to efficiently recover key system functionality in the event that our primary systems are unavailable due to various scenarios, such as natural disasters.
ITEM 2. PROPERTIES
We lease office space in Bermuda, which houses our headquarters and principal executive offices, as well as in other locations throughout the U.S. and in the U.K., Australia, Canada, Ireland, Singapore and Switzerland. We believe that our current office space is sufficient for us to conduct our operations, although our needs may change in the future. To date, the cost of acquiring and maintaining our office space has not been material to us as a whole.
ITEM 3. LEGAL PROCEEDINGS
The information required by this Item relating to legal proceedings is incorporated herein by reference to information included in “Note 20. Commitments, Contingencies and Other Items” in our “Notes to the Consolidated Financial Statements.”
ITEM 4. MINE SAFETY DISCLOSURES
Not applicable.
50
PART II
ITEM 5. MARKET FOR REGISTRANT’S COMMON EQUITY, RELATED SHAREHOLDER MATTERS AND ISSUER REPURCHASES OF EQUITY SECURITIES
MARKET INFORMATION AND NUMBER OF HOLDERS
Our common shares are listed on the NYSE under the symbol “RNR.” On February 6, 2026, there were 97 holders of record of our common shares.
DIVIDENDS
On February 11, 2026, RenaissanceRe’s Board approved a quarterly dividend of $0.41 per common share on its common shares. The dividend is payable on March 31, 2026, to shareholders of record on March 13, 2026. The declaration and payment of future dividends is at the sole discretion of our Board after taking into account various factors, including our financial condition, settlement indemnifications, operating results, available cash and current and anticipated cash needs.
PERFORMANCE GRAPH
The following graph compares the cumulative return on our common shares, including reinvestment of our dividends on our common shares, to such return for the S&P 500 Index and the S&P Composite 1500 Property & Casualty Insurance Index for the five-year period commencing December 31, 2020 and ending December 31, 2025, assuming $100 was invested on December 31, 2020. Each measurement point on the graph below represents the cumulative shareholder return as measured by the last sale price at the end of each calendar year during the period from January 1, 2021 through December 31, 2025. As depicted in the graph below, during this period, the cumulative return was (1) 76.4% on our common shares; (2) 96.2% for the S&P 500 Index; and (3) 121.7% for the S&P Composite 1500 Property & Casualty Insurance Industry Index.
COMPARISON OF FIVE YEAR CUMULATIVE TOTAL RETURN
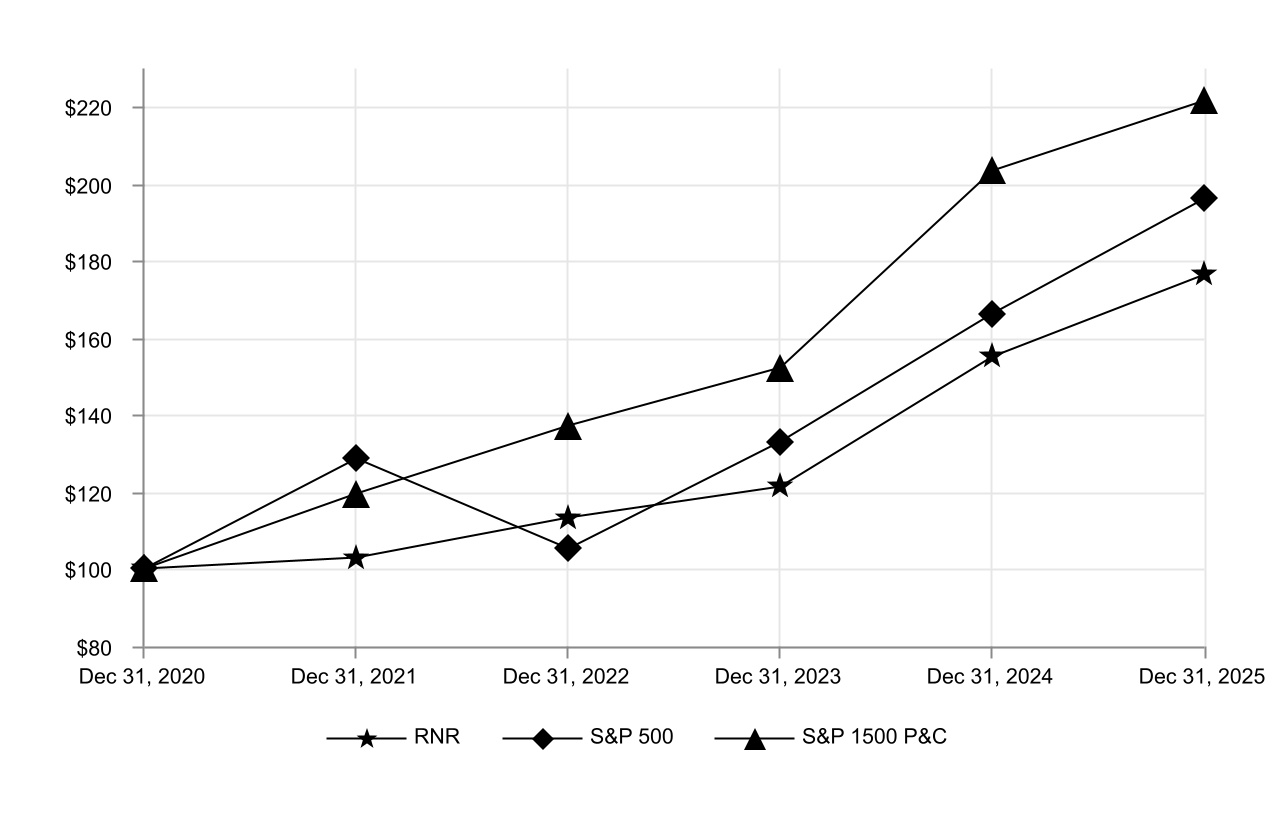
51
ISSUER REPURCHASES OF EQUITY SECURITIES
Our share repurchase program may be effected from time to time, depending on market conditions and other factors, through open market purchases and privately negotiated transactions. Our Board has authorized a share repurchase program, which was renewed in an aggregate amount of up to $750.0 million on November 5, 2025 and again on February 11, 2026. Unless terminated earlier by our Board, the program will expire when we have repurchased the full value of the shares authorized.
The table below details the repurchases that were made under the program during the fourth quarter of 2025, and also includes other shares purchased, which represents common shares surrendered by employees in respect of withholding tax obligations on the vesting of restricted stock.
| Total Shares Purchased | Other Shares Purchased | Shares Purchased Under Repurchase Program | Dollar Amount Still Available Under Repurchase Program | ||||||||||||||||||||||||||||||||||||||||||||
| Shares Purchased | Average Price per Share | Shares Purchased | Average Price per Share | Shares Purchased | Average Price per Share | ||||||||||||||||||||||||||||||||||||||||||
(in thousands) | |||||||||||||||||||||||||||||||||||||||||||||||
Beginning dollar amount available to be repurchased | $ | 615,002 | |||||||||||||||||||||||||||||||||||||||||||||
| October 1 - 31, 2025 | 1,627,646 | $ | 250.16 | — | $ | — | 1,627,646 | $ | 250.16 | $ | 207,832 | ||||||||||||||||||||||||||||||||||||
November 1 - 30, 2025 (1) | 519,595 | $ | 263.34 | 7,568 | $ | 254.09 | 512,027 | $ | 263.48 | $ | 648,093 | ||||||||||||||||||||||||||||||||||||
| December 1 - 31, 2025 | 396,672 | $ | 273.28 | 12 | $ | 263.96 | 396,660 | $ | 273.28 | $ | 539,694 | ||||||||||||||||||||||||||||||||||||
| Total | 2,543,913 | $ | 256.46 | 7,580 | $ | 254.11 | 2,536,333 | $ | 256.46 | $ | 539,694 | ||||||||||||||||||||||||||||||||||||
(1)On November 5, 2025, our Board approved a renewal of our authorized share repurchase program to an aggregate amount of up to $750.0 million.
During 2025, we repurchased 6,434,503 common shares at an aggregate cost of $1.6 billion and an average price of $247.62 per common share. At December 31, 2025, $539.7 million remained available for repurchase under the share repurchase program. Subsequent to December 31, 2025 and through the period ended February 6, 2026, we repurchased 470,930 common shares at an aggregate cost of $130.0 million and an average price of $276.04 per common share. In the future, we may authorize additional purchase activities under the currently authorized share repurchase program, increase the amount authorized under the share repurchase program, or adopt additional trading plans. Our decision to repurchase common shares will depend on, among other matters, the market price of the common shares and our capital requirements.
ITEM 6. [RESERVED]
52
ITEM 7. MANAGEMENT’S DISCUSSION AND ANALYSIS OF FINANCIAL CONDITION AND RESULTS OF OPERATIONS
The following is a discussion and analysis of our results of operations for 2025 compared to 2024, as well as our liquidity and capital resources at December 31, 2025. This discussion and analysis should be read in conjunction with the audited consolidated financial statements and notes thereto included in this filing. This filing contains forward-looking statements that involve risks and uncertainties. Actual results may differ materially from the results described or implied by these forward-looking statements. See “Note on Forward-Looking Statements.” For a discussion and analysis of our results of operations for 2024 compared to 2023, please refer to the disclosures set forth under the heading “Management’s Discussion and Analysis of Financial Condition and Results of Operations” on pages 51-99 of our Annual Report on Form 10-K for the year ended December 31, 2024, filed with the SEC on February 12, 2025.
In this Form 10-K, references to “RenaissanceRe” refer to RenaissanceRe Holdings Ltd. (the parent company) and references to “we,” “us,” “our” and the “Company” refer to RenaissanceRe Holdings Ltd. together with its subsidiaries, unless the context requires otherwise. Defined terms used throughout this Form 10-K are included in the “Glossary of Defined Terms” at the end of “Part I, Item 1. Business” of this Form 10-K.
All dollar amounts referred to in this Form 10-K are in U.S. dollars unless otherwise indicated.
Due to rounding, numbers presented in the tables included in this Form 10-K may not add up precisely to the totals provided.
53
INDEX TO MANAGEMENT’S DISCUSSION AND ANALYSIS OF FINANCIAL CONDITION AND RESULTS OF OPERATIONS
| Page | |||||
54
OVERVIEW
RenaissanceRe is a global provider of reinsurance and insurance. We provide property, casualty and specialty reinsurance and certain insurance solutions to customers, principally through intermediaries. Established in 1993, we have offices in Bermuda, Australia, Canada, Ireland, Singapore, Switzerland, the U.K., and the U.S.
Our mission is to match desirable risk with efficient capital, and our vision is to be the best underwriter. We believe that this will allow us to produce superior returns for our shareholders over the long term, and enable our purpose to protect communities and enable prosperity. We seek to accomplish these goals by delivering a value proposition composed of leadership, expertise and partnership, through our operation as an integrated system of three competitive advantages: superior risk selection, superior customer relationships and superior capital management.
Our current business strategy focuses predominantly on writing reinsurance. We apply our reinsurance lens of approaching risks as a portfolio to the insurance business that we write, primarily though delegated authority arrangements. Through our Capital Partners unit we create and manage innovative joint ventures and managed funds, which provide access to the portfolios our underwriters build. Additionally, we pursue several other opportunities, such as executing customized reinsurance transactions to assume or cede risk, and managing certain strategic investments. We continually explore appropriate and efficient ways to address the risk management needs of our clients and the impact of various regulatory and legislative changes on our operations. From time to time, we consider diversification into new opportunities, either through organic growth, the formation of new joint ventures or managed funds, or the acquisition of, or investment in, other companies or books of business of other companies.
Our business consists of the following reportable segments: (1) Property, which is comprised of catastrophe and other property (re)insurance, and (2) Casualty and Specialty, which is comprised of general casualty, professional liability, credit and other specialty (re)insurance. The underwriting results of our consolidated operating subsidiaries and underwriting platforms are included in our Property and Casualty and Specialty segment results as appropriate.
We have three principal drivers of profit that generate diversified earnings streams for our business: underwriting income, fee income, and investment income. Underwriting income is the income that we earn from our core underwriting business. By matching desirable risk with efficient capital and accepting the volatility that this business brings, we believe that we can generate superior returns over the long-term. Fee income is the income that we earn primarily from managing third-party capital in our Capital Partners unit and is composed of management fee income and performance fee income. Investment income is income derived from the investment portfolio that we maintain to support our business. We take a disciplined approach in building a relatively conservative, well-structured investment portfolio, with a focus on fixed income investments. Compared to underwriting income, we view fee income, especially management fee income, and investment income, as being relatively less volatile and as diversifying sources of income.
We principally measure our financial success through long-term growth in tangible book value per common share plus the change in accumulated dividends. We believe this metric is the most appropriate measure of our financial performance, and in respect of which we believe we have delivered superior performance over time.
Revenues and Expenses
Our revenues are principally derived from three sources: (1) net premiums earned from the reinsurance and insurance policies we sell; (2) net investment income and net realized and unrealized gains from the investment of our capital funds and the investment of the cash we receive on the policies which we sell; and (3) fees received from our joint ventures, managed funds and structured reinsurance products, which are primarily reflected in redeemable noncontrolling interest or as an offset to acquisition or operational expenses.
Our expenses primarily consist of: (1) net claims and claim expenses incurred on the policies of reinsurance and insurance we sell; (2) acquisition costs, which typically represent a percentage of the premiums we write; (3) operational expenses, which primarily consist of personnel expenses, rent and other expenses; (4) corporate expenses, which include certain executive, legal and consulting expenses, costs for research and
55
development, transaction and integration-related expenses, and other miscellaneous costs, including those associated with operating as a publicly traded company; (5) interest and dividends related to our debt, preference shares and common shares; and (6) income taxes. Historically, the majority of our income has been earned in Bermuda, which did not have a corporate income tax, so the tax impact to our operations has been minimal. On December 27, 2023, the Government of Bermuda announced the implementation of a 15% CIT, which became effective on January 1, 2025. Therefore, our profits generated on or after January 1, 2025 in Bermuda (except for profits earned by our joint ventures and managed funds) are subject to a 15% corporate income tax. We generally expect that the profits generated in Bermuda on or after January 1, 2025 by our consolidated joint ventures and managed funds, except to the extent those profits are attributable to redeemable noncontrolling interests, will also be taxed at 15% as a result of the enactment Pillar II Rules by many of the jurisdictions in which we operate. We believe that the flexible global operating model that we have utilized will continue to prove resilient.
The underwriting results of an insurance or reinsurance company are discussed frequently by reference to its net claims and claim expense ratio, underwriting expense ratio, and combined ratio. The net claims and claim expense ratio is calculated by dividing net claims and claim expenses incurred by net premiums earned. The underwriting expense ratio is calculated by dividing underwriting expenses (acquisition expenses and operational expenses) by net premiums earned. The combined ratio is the sum of the net claims and claim expense ratio and the underwriting expense ratio. A combined ratio below 100% indicates profitable underwriting prior to the consideration of investment income. A combined ratio over 100% indicates unprofitable underwriting prior to the consideration of investment income. We also discuss our net claims and claim expense ratio on a current accident year basis and a prior accident years basis. The current accident year net claims and claim expense ratio is calculated by taking current accident year net claims and claim expenses incurred, divided by net premiums earned. The prior accident years net claims and claim expense ratio is calculated by taking prior accident years net claims and claim expenses incurred, divided by net premiums earned.
Impact of Redeemable Noncontrolling Interest in our Results
We manage several entities - DaVinci, Fontana, Medici, and Vermeer - where we control the decision making authority through ownership of the voting interests but do not own all of the economic interest. As a result of our control, we include the full financial results of these entities in our consolidated financial statements. However, since we do not own all of the economic interest in these entities, we do not ultimately retain all of the economic outcomes they generate. Rather, portions of these entities’ economic outcomes are due to third-party investors who hold noncontrolling interests in these entities and are ultimately allocated to such third-party investors.
These entities’ economic outcomes may include underwriting results, investment results, and foreign exchange impacts, among other items. For example, if one of these entities realizes a financial gain or loss from its underwriting or investment activities, the full amount of such gain or loss is shown in net income (loss) on our consolidated statements of operations. But only the portion of such gain or loss that represents our investment in such entity is reflected in net income (loss) attributable to RenaissanceRe. The remainder, which is ultimately allocated to such third-party investors in those entities, is shown separately in net (income) loss attributable to redeemable noncontrolling interests.
Refer to “Note 10. Noncontrolling Interests” in our “Notes to the Consolidated Financial Statements” for additional information regarding our redeemable noncontrolling interests and how this accounting treatment impacts our financial results.
Effects of Inflation
General economic inflation has increased over the past few years compared to recent historical norms, and there is a risk of inflation remaining elevated for an extended period, which could cause claims and claims related expenses to increase, impact the performance of our investment portfolio, or have other adverse effects. This risk may be exacerbated by geopolitical factors and global supply chain issues or tariffs, among other factors, from time to time. Central bank policy and changes to interest rates may also increase the risk of inflationary pressures. The actual effects of the current and potential future increase in inflation on our results cannot be accurately known until, among other items, claims are ultimately settled. The duration and severity of an inflationary period cannot be estimated with precision. We consider the
56
anticipated effects of inflation on us in our catastrophe loss models and on our investment portfolio. Our estimates of the potential effects of inflation are also considered in pricing and in estimating reserves for unpaid claims and claim expenses. The potential exists, after a catastrophe loss, for the development of inflationary pressures in a local economy.
Launch of Medici UCITS
In March 2025 we launched Medici UCITS, a new Irish domiciled property catastrophe bond fund, a sub-fund of RenaissanceRe Medici ICAV. Medici UCITS is purpose-built to provide European and other global investors with access to RenaissanceRe’s catastrophe bond investment strategy through a dedicated European-regulated UCITS structure. Medici UCITS launched with $341.5 million in total capital, made up of a combination of primarily existing partner capital, new partner capital and a $140.0 million co-investment from the Company. At launch, Medici UCITS was seeded by a transfer in kind of catastrophe bonds of Medici. Medici UCITS is intended to complement our existing catastrophe bond fund, Medici, and both Medici UCITS and Medici share substantially similar investment guidelines and risk appetites. Medici is consolidated within our results, whereas Medici UCITS is not controlled by us, and is therefore not consolidated within our results. RenaissanceRe’s investment in Medici UCITS appears as a fund investment and is accounted for at fair value. The transactions related to the launch of Medici UCITS appear in our financial statements as a reduction in the overall net asset value of Medici of $316.5 million at December 31, 2025, and our investment in Medici UCITS appears as a fund investment of $154.5 million at December 31, 2025. Refer to “Note 5. Investments” in our “Notes to the Consolidated Financial Statements” for additional information related to our investment in Medici UCITS.
57
SELECTED CONSOLIDATED FINANCIAL DATA
The following tables set forth our selected consolidated financial data and other financial information at the end of and for each of the years in the five-year period ended December 31, 2025. The results of Validus are included in our consolidated financial data from November 1, 2023. The selected consolidated financial data should be read in conjunction with our consolidated financial statements and related notes thereto and the other information in this “Part II, Item 7. Management’s Discussion and Analysis of Financial Condition and Results of Operations” of this Form 10-K.
| Year ended December 31, | 2025 | 2024 | 2023 | 2022 | 2021 | ||||||||||||||||||||||||||||||
(in thousands, except share and per share data and percentages) | |||||||||||||||||||||||||||||||||||
| Statements of Operations Data: | |||||||||||||||||||||||||||||||||||
Gross premiums written | $ | 11,738,420 | $ | 11,733,066 | $ | 8,862,366 | $ | 9,213,540 | $ | 7,833,798 | |||||||||||||||||||||||||
Net premiums written | 9,870,200 | 9,952,216 | 7,467,813 | 7,196,160 | 5,939,375 | ||||||||||||||||||||||||||||||
Net premiums earned | 9,901,182 | 10,095,760 | 7,471,133 | 6,333,989 | 5,194,181 | ||||||||||||||||||||||||||||||
| Net investment income | 1,703,475 | 1,654,289 | 1,253,110 | 559,932 | 319,479 | ||||||||||||||||||||||||||||||
Net realized and unrealized gains (losses) on investments | 1,181,268 | (27,840) | 414,522 | (1,800,485) | (218,134) | ||||||||||||||||||||||||||||||
Net claims and claim expenses incurred | 5,615,839 | 5,332,981 | 3,573,509 | 4,338,840 | 3,876,087 | ||||||||||||||||||||||||||||||
Acquisition expenses | 2,550,823 | 2,643,867 | 1,875,034 | 1,568,606 | 1,214,858 | ||||||||||||||||||||||||||||||
Operational expenses | 464,477 | 496,588 | 375,182 | 276,691 | 212,184 | ||||||||||||||||||||||||||||||
| Underwriting income (loss) | 1,270,043 | 1,622,324 | 1,647,408 | 149,852 | (108,948) | ||||||||||||||||||||||||||||||
Net income (loss) | 3,617,743 | 2,960,532 | 3,620,127 | (1,159,816) | (103,440) | ||||||||||||||||||||||||||||||
Net income (loss) available (attributable) to RenaissanceRe common shareholders | 2,646,959 | 1,834,985 | 2,525,757 | (1,096,578) | (73,421) | ||||||||||||||||||||||||||||||
Net income (loss) available (attributable) to RenaissanceRe common shareholders per common share – diluted | 56.03 | 35.21 | 52.27 | (25.50) | (1.57) | ||||||||||||||||||||||||||||||
Dividends per common share | 1.60 | 1.56 | 1.52 | 1.48 | 1.44 | ||||||||||||||||||||||||||||||
Weighted average common shares outstanding – diluted | 46,483 | 51,339 | 47,607 | 43,040 | 47,171 | ||||||||||||||||||||||||||||||
Return on average common equity | 25.9 | % | 19.3 | % | 40.5 | % | (22.0) | % | (1.1) | % | |||||||||||||||||||||||||
Combined ratio | 87.2 | % | 83.9 | % | 77.9 | % | 97.7 | % | 102.1 | % | |||||||||||||||||||||||||
| At December 31, | 2025 | 2024 | 2023 | 2022 | 2021 | ||||||||||||||||||||||||||||||
| Balance Sheet Data: | |||||||||||||||||||||||||||||||||||
Total investments | $ | 36,073,209 | $ | 32,639,456 | $ | 29,216,143 | $ | 22,220,436 | $ | 21,442,659 | |||||||||||||||||||||||||
Total assets | 53,800,390 | 50,707,550 | 49,007,105 | 36,552,878 | 33,959,502 | ||||||||||||||||||||||||||||||
Reserve for claims and claim expenses | 22,302,345 | 21,303,491 | 20,486,869 | 15,892,573 | 13,294,630 | ||||||||||||||||||||||||||||||
Unearned premiums | 6,028,174 | 5,950,415 | 6,136,135 | 4,559,107 | 3,531,213 | ||||||||||||||||||||||||||||||
Debt | 2,329,201 | 1,886,689 | 1,958,655 | 1,170,442 | 1,168,353 | ||||||||||||||||||||||||||||||
Capital leases | 20,426 | 21,010 | 21,540 | 22,020 | 22,459 | ||||||||||||||||||||||||||||||
Preference shares | 750,000 | 750,000 | 750,000 | 750,000 | 750,000 | ||||||||||||||||||||||||||||||
Total shareholders’ equity attributable to RenaissanceRe | 11,608,657 | 10,574,012 | 9,454,958 | 5,325,274 | 6,624,281 | ||||||||||||||||||||||||||||||
Common shares outstanding | 43,962 | 50,181 | 52,694 | 43,718 | 44,445 | ||||||||||||||||||||||||||||||
Book value per common share | $ | 247.00 | $ | 195.77 | $ | 165.20 | $ | 104.65 | $ | 132.17 | |||||||||||||||||||||||||
Accumulated dividends | 29.68 | 28.08 | 26.52 | 25.00 | 23.52 | ||||||||||||||||||||||||||||||
Book value per common share plus accumulated dividends | $ | 276.68 | $ | 223.85 | $ | 191.72 | $ | 129.65 | $ | 155.69 | |||||||||||||||||||||||||
Change in book value per common share plus change in accumulated dividends | 27.0 | % | 19.4 | % | 59.3 | % | (19.7) | % | (3.5) | % | |||||||||||||||||||||||||
58
SUMMARY OF CRITICAL ACCOUNTING ESTIMATES
Claims and Claim Expense Reserves
We believe the most significant accounting judgment made by management is our estimate of claims and claim expense reserves. Claims and claim expense reserves represent estimates, including actuarial and statistical projections at a given point in time, of the ultimate settlement and administration costs for unpaid claims and claim expenses arising from the insurance and reinsurance contracts we sell. Our reserve for claims and claim expense is a combination of case reserves, ACR, and incurred but not reported losses and incurred but not enough reported losses, collectively referred to as IBNR. Case reserves are losses reported to us by insureds and ceding companies, but which have not yet been paid. If deemed necessary and in certain situations, either we establish, or our clients report, ACR. Client reported ACR represents their estimate of additional contract specific claims in excess of the case reserves they have reported to us. ACR established by us represents our estimates for claims related to specific contracts which we believe may not be adequately estimated by the client as of that date or is not within the IBNR. We establish IBNR using actuarial techniques and expert judgment to represent the anticipated cost of claims which have not been reported to us yet or where we anticipate increased reporting. Our reserving committee, which includes members of our senior management, reviews, discusses, and assesses the reasonableness and adequacy of the reserving estimates included in our audited consolidated financial statements.
The following table summarizes our reserve for claims and claim expenses by segment, allocated between case reserves, ACR and IBNR:
| At December 31, 2025 | Case Reserves | ACR | IBNR | Total | |||||||||||||||||||||||||
| (in thousands) | |||||||||||||||||||||||||||||
| Property | $ | 1,797,427 | $ | 1,679,848 | $ | 2,208,709 | $ | 5,685,984 | |||||||||||||||||||||
| Casualty and Specialty | 3,393,451 | 327,941 | 12,894,969 | 16,616,361 | |||||||||||||||||||||||||
Total | $ | 5,190,878 | $ | 2,007,789 | $ | 15,103,678 | $ | 22,302,345 | |||||||||||||||||||||
| At December 31, 2024 | |||||||||||||||||||||||||||||
| (in thousands) | |||||||||||||||||||||||||||||
Property | $ | 1,845,228 | $ | 1,905,553 | $ | 2,821,958 | $ | 6,572,739 | |||||||||||||||||||||
Casualty and Specialty | 3,081,081 | 295,074 | 11,354,597 | 14,730,752 | |||||||||||||||||||||||||
Total | $ | 4,926,309 | $ | 2,200,627 | $ | 14,176,555 | $ | 21,303,491 | |||||||||||||||||||||
59
Activity in the reserve for claims and claim expenses is summarized as follows:
| Year ended December 31, | 2025 | 2024 | |||||||||||||||
| (in thousands) | |||||||||||||||||
Reserve for claims and claim expenses, net of reinsurance recoverable, beginning of period | $ | 16,822,101 | $ | 15,142,583 | |||||||||||||
| Net incurred related to: | |||||||||||||||||
| Current year | 6,706,772 | 6,184,315 | |||||||||||||||
| Prior years | (1,090,933) | (851,334) | |||||||||||||||
| Total net incurred | 5,615,839 | 5,332,981 | |||||||||||||||
| Net paid related to: | |||||||||||||||||
| Current year | 969,151 | 488,450 | |||||||||||||||
| Prior years | 3,359,634 | 3,109,360 | |||||||||||||||
| Total net paid | 4,328,785 | 3,597,810 | |||||||||||||||
Foreign exchange and other (1) | 293,277 | (55,653) | |||||||||||||||
Reserve for claims and claim expenses, net of reinsurance recoverable, end of period | 18,402,432 | 16,822,101 | |||||||||||||||
Reinsurance recoverable, end of period | 3,899,913 | 4,481,390 | |||||||||||||||
Reserve for claims and claim expenses, end of period | $ | 22,302,345 | $ | 21,303,491 | |||||||||||||
(1)Reflects the impact of the foreign exchange revaluation of the reserve for claims and claim expenses, net of reinsurance recoverable, denominated in non-U.S. dollars as at the balance sheet date, as well as reinsurance transactions accounted for under retroactive reinsurance accounting.
The following table details our net (favorable) adverse development of prior accident years net claims and claim expenses by segment:
| Year ended December 31, | 2025 | 2024 | |||||||||||||||
| (in thousands) | |||||||||||||||||
| Property | $ | (1,089,196) | $ | (818,852) | |||||||||||||
| Casualty and Specialty | (1,737) | (32,482) | |||||||||||||||
Total net (favorable) adverse development of prior accident years net claims and claim expenses | $ | (1,090,933) | $ | (851,334) | |||||||||||||
Our reserving methodology for each line of business uses a loss reserving process that calculates a point estimate for our ultimate settlement and administration costs for claims and claim expenses. We do not calculate a range of estimates and do not discount any of our reserves for claims and claim expenses. We use this point estimate, along with paid claims and case reserves, to record our best estimate of ACR and IBNR in our consolidated financial statements. Under GAAP, we are not permitted to establish estimates for catastrophe claims and claim expense reserves until an event occurs that gives rise to a loss.
Reserving for our claims involves other uncertainties, such as the dependence on information from ceding companies, the time lag inherent in reporting information from the primary insurer to us or to our ceding companies, and different reserving practices among ceding companies. The information received from ceding companies is typically in the form of bordereaux, broker notifications of loss and/or discussions with ceding companies or their brokers. This information may be received on a monthly, quarterly or transactional basis and normally includes paid claims and estimates of case reserves. We may also receive an estimate or provision for IBNR from certain ceding companies. This information is often updated and adjusted from time to time during the loss settlement period as new data or facts in respect of initial claims, client accounts, industry or event trends may be reported or emerge in addition to changes in applicable statutory and case laws.
Our estimates of large losses are based on factors including currently available information derived from claims information from certain customers and brokers, industry assessments of losses, proprietary models, historical reinsurance and insurance loss experience and statistics, management’s experience and judgment to assist the establishment of appropriate claims and claim expense reserves, and the terms and
60
conditions of our contracts. The uncertainty of our estimates for large losses is also impacted by the preliminary nature of the information available, the magnitude and relative infrequency of the loss, the expected duration of the respective claims development period, inadequacies in the data provided to the relevant date by industry participants, the potential for further reporting lags or insufficiencies and, in certain cases, the form of the claims and legal issues under the relevant terms of insurance and reinsurance contracts. In addition, a significant portion of the net claims and claim expenses associated with certain large losses can be concentrated with a few large clients and therefore the loss estimates for these losses may vary significantly based on the claims experience of those clients. The contingent nature of business interruption and other exposures will also impact losses in a meaningful way, which we believe may give rise to significant complexity in respect of claims handling, claims adjustment and other coverage issues, over time. Given the magnitude of certain losses, there can be meaningful uncertainty regarding total covered losses for the insurance industry and, accordingly, several of the key assumptions underlying our loss estimates. Loss reserve estimation in respect of our retrocessional contracts poses further challenges compared to directly assumed reinsurance. In addition, our actual net losses may increase if our reinsurers or other obligors fail to meet their obligations.
Because of the inherent uncertainties discussed above, we have developed a reserving philosophy which attempts to incorporate prudent assumptions and estimates, and we have generally experienced favorable development on prior accident years net claims and claim expenses in the last several years. However, there is no assurance that this favorable development on prior accident years net claims and claim expenses will occur in future periods.
Our reserving techniques, assumptions and processes differ among our Property and Casualty and Specialty segments. Refer to “Note 8. Reserve for Claims and Claim Expenses” in our “Notes to the Consolidated Financial Statements” for more information on the risks we insure and reinsure, the reserving techniques, assumptions and processes we follow to estimate our claims and claim expense reserves, prior year development of the reserve for claims and claim expenses, analysis of our incurred and paid claims development and claims duration information for each of our Property and Casualty and Specialty segments.
Property Segment
Actual Results vs. Initial Estimates
As discussed above, the key assumption in estimating reserves for our Property segment is our estimate of incurred claims and claim expenses. The table below shows our initial estimates of incurred claims and claim expenses for each accident year and how these initial estimates have developed over time. The initial estimate of accident year incurred claims and claim expenses represents our estimate of the ultimate settlement and administration costs for claims incurred in our Property segment occurring during a particular accident year, and as reported as of December 31 of that year. The re-estimated incurred claims and claim expenses as of December 31 of subsequent years, represent our revised estimates as reported as of those dates. Our most recent estimates as reported at December 31, 2025 differ from our initial accident year estimates and demonstrate that our most recent estimate of incurred claims and claim expenses are reasonably likely to vary from our initial estimate, perhaps significantly. Changes in this estimate will be recorded in the period in which they occur. In accident years where our current estimates are lower than our initial estimates, we have experienced favorable development, in comparison, for accident years where our current estimates are higher than our original estimates we have experienced adverse development. The table is presented on a net basis and, therefore, includes the benefit of reinsurance recoveries. In addition, we have included historical incurred claims and claim expenses development information related to Platinum, TMR and Validus in the table below. For incurred accident year claims and claim expenses denominated in currencies other than USD, we have used the current year-end balance sheet foreign exchange rate for all periods provided, thereby eliminating the effects of changes in foreign currency translation rates from the incurred accident year claims development information included in the table below.
61
The following table details our Property segment incurred claims and claim expenses, net of reinsurance, as of December 31, 2025.
| Incurred Claims and Claim Expenses, Net of Reinsurance | ||||||||||||||||||||||||||||||||||||||||||||||||||||||||||||||||||||
| (in thousands) | For the year ended December 31, | |||||||||||||||||||||||||||||||||||||||||||||||||||||||||||||||||||
| Accident Year | 2016 | 2017 | 2018 | 2019 | 2020 | 2021 | 2022 | 2023 | 2024 | 2025 | ||||||||||||||||||||||||||||||||||||||||||||||||||||||||||
| 2016 | $ | 586,563 | $ | 605,891 | $ | 576,554 | $ | 552,931 | $ | 524,648 | $ | 519,806 | $ | 537,039 | $ | 521,120 | $ | 520,790 | $ | 523,815 | ||||||||||||||||||||||||||||||||||||||||||||||||
| 2017 | — | 1,964,244 | 1,826,456 | 1,699,976 | 1,682,099 | 1,619,508 | 1,576,459 | 1,544,122 | 1,520,082 | 1,483,791 | ||||||||||||||||||||||||||||||||||||||||||||||||||||||||||
| 2018 | — | — | 1,283,450 | 1,360,270 | 1,299,592 | 1,179,090 | 1,160,168 | 1,109,124 | 1,081,446 | 1,064,747 | ||||||||||||||||||||||||||||||||||||||||||||||||||||||||||
| 2019 | — | — | — | 1,188,587 | 1,167,401 | 1,068,259 | 1,007,367 | 949,443 | 954,719 | 946,725 | ||||||||||||||||||||||||||||||||||||||||||||||||||||||||||
| 2020 | — | — | — | — | 1,987,549 | 2,104,982 | 2,117,618 | 2,050,640 | 2,015,930 | 1,975,495 | ||||||||||||||||||||||||||||||||||||||||||||||||||||||||||
| 2021 | — | — | — | — | — | 2,854,523 | 2,887,782 | 2,787,188 | 2,563,026 | 2,498,844 | ||||||||||||||||||||||||||||||||||||||||||||||||||||||||||
| 2022 | — | — | — | — | — | — | 2,588,892 | 2,487,486 | 2,096,906 | 1,878,473 | ||||||||||||||||||||||||||||||||||||||||||||||||||||||||||
| 2023 | — | — | — | — | — | — | — | 1,481,513 | 1,391,373 | 1,127,806 | ||||||||||||||||||||||||||||||||||||||||||||||||||||||||||
| 2024 | — | — | — | — | — | — | — | — | 1,968,337 | 1,499,782 | ||||||||||||||||||||||||||||||||||||||||||||||||||||||||||
| 2025 | — | — | — | — | — | — | — | — | — | 2,530,317 | ||||||||||||||||||||||||||||||||||||||||||||||||||||||||||
| Total | $ | 15,529,795 | ||||||||||||||||||||||||||||||||||||||||||||||||||||||||||||||||||
Our initial and subsequent estimates of incurred claims and claim expenses, net of reinsurance, are impacted by available information derived from claims information from customers and brokers, industry assessments of losses, proprietary models, historical reinsurance and insurance loss experience and statistics, management’s experience and judgment to assist the establishment of appropriate claims and claim expense reserves, and the terms and conditions of our contracts. As described above, given the complexity in reserving for claims and claims expenses associated with property losses, and catastrophe excess of loss reinsurance contracts in particular, which make up a significant proportion of our Property segment, we have experienced development, both favorable and unfavorable, in any given accident year.
In accident years with a low level of insured catastrophe losses, our other property lines of business contribute a greater proportion of our overall incurred claims and claim expenses within our Property segment, compared to years with a high level of insured catastrophe losses. We expect that certain of our other property lines of business will tend to generate less volatility in future calendar years and, as such, we would expect to see a slower more stable increase or decrease in estimated incurred net claims and claim expenses over time in such business. Certain of our other property contracts are also exposed to catastrophe events, resulting in increased volatility of incurred claims and claim expenses driven by the occurrence of catastrophe events. In addition, volatility in the initial estimate associated with large catastrophe losses and the speed at which we settle claims can vary significantly based on the type of event.
Sensitivity Analysis
The table below shows the impact on our reserve for claims and claim expenses, net income (loss) and shareholders’ equity as of and for the year ended December 31, 2025 of a reasonable range of possible outcomes associated with our estimates of gross ultimate losses for claims and claim expenses incurred within our Property segment. The reasonable range of possible outcomes is based on a distribution of outcomes of our ultimate incurred claims and claim expenses from large losses. In addition, we adjust the loss ratios and development curves in our other property lines of business in a similar fashion to the sensitivity analysis performed for our Casualty and Specialty segment, discussed in greater detail below. In general, our reserve for claims and claim expenses for more recent losses are subject to greater uncertainty and, therefore, greater variability and are likely to experience material changes from one period to the next. This is due to uncertainty with respect to the size of the industry losses, which contracts have been exposed to the loss and the magnitude of claims incurred by our clients. As our claims age, more information becomes available and we believe our estimates become more certain, although there is no assurance this trend will continue in the future. As a result, the sensitivity analysis below is based on the age of each accident year, our current estimated incurred claims and claim expenses for the losses occurring in each accident year, and a reasonable range of possible outcomes of our current estimates of claims and claim expenses by accident year. The impact on net income (loss) and shareholders’ equity assumes no increase
62
or decrease in reinsurance recoveries, loss related premium or profit commission, income tax benefit (expense), or redeemable noncontrolling interest.
| (in thousands, except percentages) | Reserve for Claims and Claim Expenses at December 31, 2025 | $ Impact of Change Reserve for Claims and Claim Expenses at December 31, 2025 | % Impact of Change on Reserve for Claims and Claim Expenses at December 31, 2025 | % Impact of Change on Net Income (Loss) for the Year Ended December 31, 2025 | % Impact of Change on Shareholders’ Equity at December 31, 2025 | ||||||||||||||||||||||||||||||
| Higher | $ | 6,184,837 | $ | 498,853 | 2.2 | % | (13.8) | % | (4.3) | % | |||||||||||||||||||||||||
| Recorded | $ | 5,685,984 | $ | — | — | % | — | % | — | % | |||||||||||||||||||||||||
| Lower | $ | 5,345,243 | $ | (340,741) | (1.5) | % | 9.4 | % | 2.9 | % | |||||||||||||||||||||||||
We believe the changes we made to our estimated incurred claims and claim expenses represent a reasonable range of possible outcomes based on our experience to date and our future expectations. While we believe these are a reasonable range of possible outcomes, we do not believe the above sensitivity analysis should be considered an actuarial reserve range. In addition, the sensitivity analysis only reflects a reasonable range of possible outcomes in our underlying assumptions. It is possible that our estimated incurred claims and claim expenses could be significantly higher or lower than the sensitivity analysis described above. For example, we could be liable for exposures we do not currently believe are covered under our policies. These changes could result in significantly larger changes to our estimated incurred claims and claim expenses, net income (loss) and shareholders’ equity than those noted above, and could be recorded across multiple periods. The inflationary outlook is also highly uncertain and could result in larger changes than those depicted above. We continue to monitor the inflationary environment and reflect our view within our best estimate reserves. We also caution that the above sensitivity analysis is not used by management in developing our reserve estimates and is also not used by management in managing the business.
Casualty and Specialty Segment
Actual Results vs. Initial Estimates
As discussed above, the key assumption in estimating reserves for our Casualty and Specialty segment is our estimate of incurred claims and claim expenses. Standard actuarial techniques are used to calculate the ultimate claims and claim expenses. The key assumptions in the determination of ultimate claims and claim expenses include the estimated incurred claims and claim expenses ratio and the estimated loss reporting patterns. The table below shows our initial estimates of incurred claims and claim expenses for each accident year and how these initial estimates have developed over time. The initial estimate of accident year incurred claims and claim expenses represents our estimate of the ultimate settlement and administration costs for claims incurred in our Casualty and Specialty segment occurring during a particular accident year, and as reported as of December 31 of that year. The re-estimated incurred claims and claim expenses as of December 31 of subsequent years, represent our revised estimates as reported as of those dates. Our most recent estimates as reported at December 31, 2025 differ from our initial accident year estimates and demonstrates that our initial estimate of incurred claims and claim expenses are reasonably likely to vary from our most recent estimate, perhaps significantly. Changes in this estimate will be recorded in the period in which they occur. In accident years where our current estimates are lower than our initial estimates, we have experienced favorable development while accident years where our current estimates are higher than our original estimates indicate adverse development. The table is presented on a net basis and, therefore, includes the benefit of reinsurance recoverable. In addition, we have included historical incurred claims and claim expenses development information related to Platinum, TMR and Validus in the table below. For incurred accident year claims denominated in currencies other than USD, we have used the current year-end balance sheet foreign exchange rate for all periods provided, thereby eliminating the effects of changes in foreign currency translation rates from the incurred accident year claims development information included in the table below.
63
The following table details our Casualty and Specialty segment incurred claims and claim expenses, net of reinsurance, as of December 31, 2025.
| Incurred Claims and Claim Expenses, Net of Reinsurance | ||||||||||||||||||||||||||||||||||||||||||||||||||||||||||||||||||||
| (in thousands) | For the year ended December 31, | |||||||||||||||||||||||||||||||||||||||||||||||||||||||||||||||||||
| Accident Year | 2016 | 2017 | 2018 | 2019 | 2020 | 2021 | 2022 | 2023 | 2024 | 2025 | ||||||||||||||||||||||||||||||||||||||||||||||||||||||||||
| 2016 | $ | 1,317,279 | $ | 1,308,376 | $ | 1,297,204 | $ | 1,291,085 | $ | 1,239,494 | $ | 1,257,200 | $ | 1,270,683 | $ | 1,256,933 | $ | 1,262,553 | $ | 1,272,131 | ||||||||||||||||||||||||||||||||||||||||||||||||
| 2017 | — | 1,681,048 | 1,635,048 | 1,680,274 | 1,616,593 | 1,644,987 | 1,650,790 | 1,671,292 | 1,706,972 | 1,719,436 | ||||||||||||||||||||||||||||||||||||||||||||||||||||||||||
| 2018 | — | — | 1,669,048 | 1,815,006 | 1,810,237 | 1,808,702 | 1,809,309 | 1,893,904 | 1,931,984 | 1,970,296 | ||||||||||||||||||||||||||||||||||||||||||||||||||||||||||
| 2019 | — | — | — | 1,554,582 | 1,562,038 | 1,568,162 | 1,602,189 | 1,683,829 | 1,747,576 | 1,808,556 | ||||||||||||||||||||||||||||||||||||||||||||||||||||||||||
| 2020 | — | — | — | — | 2,445,460 | 2,335,016 | 2,335,202 | 2,382,073 | 2,349,355 | 2,332,324 | ||||||||||||||||||||||||||||||||||||||||||||||||||||||||||
| 2021 | — | — | — | — | — | 2,807,592 | 2,670,614 | 2,573,363 | 2,524,016 | 2,523,431 | ||||||||||||||||||||||||||||||||||||||||||||||||||||||||||
| 2022 | — | — | — | — | — | — | 3,391,205 | 3,243,085 | 3,112,166 | 3,131,988 | ||||||||||||||||||||||||||||||||||||||||||||||||||||||||||
| 2023 | — | — | — | — | — | — | — | 3,810,310 | 3,830,464 | 3,751,187 | ||||||||||||||||||||||||||||||||||||||||||||||||||||||||||
| 2024 | — | — | — | — | — | — | — | — | 4,210,408 | 4,132,698 | ||||||||||||||||||||||||||||||||||||||||||||||||||||||||||
| 2025 | — | — | — | — | — | — | — | — | — | 4,187,547 | ||||||||||||||||||||||||||||||||||||||||||||||||||||||||||
| Total | $ | 26,829,594 | ||||||||||||||||||||||||||||||||||||||||||||||||||||||||||||||||||
The reserving methodology for our Casualty and Specialty segment is weighted more heavily to our initial estimate in the early periods immediately following the contracts’ inception through the use of the expected loss ratio method. The expected loss ratio method estimates the incurred losses by multiplying the initial expected loss ratio by the earned premium. Under the expected loss ratio method, no reliance is placed on the development of claims and claim expenses. The determination of when reported losses are sufficient and credible to warrant selection of an ultimate loss ratio different from the initial expected loss ratio also requires judgment. We generally make adjustments for reported loss experience indicating unfavorable variances from the initial expected loss ratio sooner than reported loss experience indicating favorable variances as reporting of losses in excess of expectations tends to have greater credibility than an absence of, or lower than expected level of, reported losses. Over time, as a greater number of claims are reported and the credibility of reported losses improves, actuarial estimates of IBNR are typically based on the Bornhuetter-Ferguson actuarial method. The Bornhuetter-Ferguson actuarial method places weight on claims and claim expenses development experience. If there is adverse development of prior accident years claims and claim expenses, we generally select the Bornhuetter-Ferguson actuarial method to ensure the claim experience is considered in the determination of our estimated claims and claim expenses with the associated business. If we believe we lack the claims experience in the early stages of development of a line of business, we may not select the Bornhuetter-Ferguson actuarial method until such time as we believe there is greater credibility in the level of reported losses. As development experience for claims and claim expenses on prior accident years becomes credible, the Bornhuetter-Ferguson actuarial method is generally selected which places greater weight on this reported experience as it develops. The Bornhuetter-Ferguson actuarial method estimates our expected ultimate claims and claim expenses by applying our initial estimated loss ratio to our undeveloped premium, and adding the reported losses to the estimate.
Sensitivity Analysis
The table below shows the impact on our Casualty and Specialty segment reserve for claims and claim expenses, net income (loss) and shareholders’ equity as of and for the year ended December 31, 2025, of a reasonable range of possible outcomes associated with a variety of reasonable actuarial assumptions for our estimates of gross ultimate claims and claim expense ratios and loss reporting patterns. The impact on net income (loss) and shareholders’ equity assumes no increase or decrease in reinsurance recoveries, loss related premium or profit commission, income tax benefit (expense), or redeemable noncontrolling interest.
64
| (in thousands, except percentages) | Estimated Loss Reporting Pattern | $ Impact of Change on Reserve for Claims and Claim Expenses at December 31, 2025 | % Impact of Change on Reserve for Claims and Claim Expenses at December 31, 2025 | % Impact of Change on Net Income (Loss) for the Year Ended December 31, 2025 | % Impact of Change on Shareholders’ Equity at December 31, 2025 | ||||||||||||||||||||||||||||||
Increase expected claims and claim expense ratio by 10% | Slower reporting | $ | 2,712,908 | 12.2 | % | (75.0) | % | (23.4) | % | ||||||||||||||||||||||||||
Increase expected claims and claim expense ratio by 10% | Expected reporting | $ | 1,628,436 | 7.3 | % | (45.0) | % | (14.0) | % | ||||||||||||||||||||||||||
Increase expected claims and claim expense ratio by 10% | Faster reporting | $ | 689,962 | 3.1 | % | (19.1) | % | (5.9) | % | ||||||||||||||||||||||||||
Expected claims and claim expense ratio | Slower reporting | $ | 988,480 | 4.4 | % | (27.3) | % | (8.5) | % | ||||||||||||||||||||||||||
Expected claims and claim expense ratio | Expected reporting | $ | — | — | % | — | % | — | % | ||||||||||||||||||||||||||
Expected claims and claim expense ratio | Faster reporting | $ | (855,267) | (3.8) | % | 23.6 | % | 7.4 | % | ||||||||||||||||||||||||||
Decrease expected claims and claim expense ratio by 10% | Slower reporting | $ | (691,464) | (3.1) | % | 19.1 | % | 6.0 | % | ||||||||||||||||||||||||||
Decrease expected claims and claim expense ratio by 10% | Expected reporting | $ | (1,583,953) | (7.1) | % | 43.8 | % | 13.6 | % | ||||||||||||||||||||||||||
Decrease expected claims and claim expense ratio by 10% | Faster reporting | $ | (2,356,013) | (10.6) | % | 65.1 | % | 20.3 | % | ||||||||||||||||||||||||||
We believe that ultimate claims and claim expense ratios 10.0 percentage points above or below our estimated assumptions constitute a reasonable range of possible outcomes based on our experience to date and our future expectations. In addition, we believe that the adjustments we made to speed up or slow down our estimated loss reporting patterns represent a reasonable range of possible outcomes. While we believe these are a reasonable range of possible outcomes, we do not believe the above sensitivity analysis should be considered an actuarial reserve range. In addition, the sensitivity analysis only reflects a reasonable range of possible outcomes in our underlying assumptions. It is possible that our initial estimated claims and claim expense ratios and loss reporting patterns could be significantly different from the sensitivity analysis described above. For example, we could be liable for exposures we do not currently believe are covered under our contracts. These changes could result in significantly larger changes to our reserves for claims and claim expenses, net income (loss) and shareholders’ equity than those noted above, and could be recorded across multiple periods. The inflationary outlook is also highly uncertain and could result in larger changes than those depicted above. We continue to monitor the inflationary environment and reflect our view within our best estimate reserves. We also caution that the above sensitivity analysis is not used by management in developing our reserve estimates and is also not used by management in managing the business.
Premiums and Related Expenses
Premiums are recognized as income, net of any applicable reinsurance or retrocessional coverage purchased, over the terms of the related contracts and policies. Premiums written are based on contract and policy terms and include estimates based on information received from both insureds and ceding companies. Subsequent revisions to premium estimates are recorded in the period in which they are determined. Unearned premiums represents the portion of premiums written that relate to the unexpired terms of contracts and policies in force. Amounts are computed by pro rata methods based on statistical data or reports received from ceding companies. Reinstatement premiums are estimated after the occurrence of a significant loss and are recorded in accordance with the contract terms. Reinstatement premiums are earned when written.
Due to the nature of reinsurance, ceding companies routinely report and remit premiums to us subsequent to the contract coverage period. Consequently, premiums written and receivable include amounts reported
65
by the ceding companies, supplemented by our estimates of premiums that are written but not reported. The estimation of written premiums may be affected by early cancellation, election of contract provisions for cut-off and return of unearned premiums or other contract disruptions. The time lag involved in the process of reporting premiums is typically shorter than the lag in reporting losses. In addition to estimating premiums written, we estimate the earned portion of premiums written which is subject to judgment and uncertainty. Any adjustments to written and earned premiums, and the related losses and acquisition expenses, are accounted for as changes in estimates and are reflected in the results of operations in the period in which they are made.
Lines of business that are similar in both the nature of their business and estimation process may be grouped for purposes of estimating premiums. Premiums are estimated based on ceding company estimates and our own judgment after considering factors such as: (1) the ceding company’s historical premium versus projected premium, (2) the ceding company’s history of providing accurate estimates, (3) anticipated changes in the marketplace and the ceding company’s competitive position therein, (4) reported premiums to date and (5) the anticipated impact of proposed underwriting changes. Estimates of premiums written and earned are based on the selected ultimate premium estimate, the terms and conditions of the reinsurance contracts and the remaining exposure from the underlying policies. We evaluate the appropriateness of these estimates in light of the actual premium reported by the ceding companies, information obtained during audits and other information received from ceding companies.
We estimate our provision for current expected credit losses by applying specific percentages against each premiums receivable based on the counterparty’s credit ratings. The percentages applied are based on information received from both insureds and ceding companies and are then adjusted by us based on industry knowledge and our judgment and estimates. We then evaluate the overall adequacy of the provision for current expected credit losses based on other qualitative and judgmental factors. At December 31, 2025, our premiums receivable balance was $7.3 billion (2024 - $7.3 billion). Of this amount, the majority are receivables from highly rated counterparties. At December 31, 2025, the provision for current expected credit losses on premiums receivable was $3.2 million (2024 - $4.6 million).
Refer to “Note 7. Reinsurance,” in our “Notes to the Consolidated Financial Statements” for additional information on premiums receivable.
Reinsurance Recoverable
We enter into retrocessional reinsurance agreements in order to help reduce our exposure to large losses and to help manage our risk portfolio. Amounts recoverable from reinsurers are estimated in a manner consistent with the claims and claim expense reserves associated with the related assumed (re)insurance. For multi-year retrospectively rated contracts, we accrue amounts (either assets or liabilities) that are due to or from our retrocessionaires based on estimated contract experience. If we determine that adjustments to earlier estimates are appropriate, such adjustments are recorded in the period in which they are determined.
The estimate of reinsurance recoverable can be more subjective than estimating the underlying claims and claim expense reserves as discussed under the heading “Claims and Claim Expense Reserves” above. In particular, reinsurance recoverable may be affected by deemed inuring reinsurance, frequency and timing of industry losses reported by various statistical reporting services, loss development, loss buffer tables and various other factors. Reinsurance recoverable on dual trigger reinsurance contracts require us to estimate our ultimate losses applicable to these contracts as well as estimate the ultimate amount of insured industry losses that will be reported by the applicable statistical reporting agency, as per the contract terms. In addition, the level of our ACR and IBNR reserves has a significant impact on reinsurance recoverable. These factors can impact the amount and timing of the reinsurance recoverable to be recorded.
The majority of the balance we have accrued as recoverable will not be due for collection until some point in the future. The amounts recoverable that will ultimately be collected are subject to uncertainty due to the ultimate ability and willingness of reinsurers to pay our claims at a future point in time, for reasons including insolvency or elective run-off, contractual dispute and various other reasons. In addition, because the majority of the balances recoverable will not be collected for some time, economic conditions, as well as the financial and operational performance of a particular reinsurer may change, and these changes may affect the reinsurer’s willingness and ability to meet their contractual obligations to us on uncollateralized
66
recoverable balances. To reflect these uncertainties, we estimate and record a provision for current expected credit losses for potential uncollectible reinsurance recoverable which reduces reinsurance recoverable and net income.
We estimate our provision for current expected credit losses by applying specific percentages against each reinsurance recoverable based on our counterparty’s credit rating. The percentages applied are based on historical industry default statistics developed by major rating agencies and are then adjusted by us based on industry knowledge and our judgment and estimates. We then evaluate the overall adequacy of the provision for current expected credit losses based on other qualitative and judgmental factors. At December 31, 2025, our reinsurance recoverable balance was $3.9 billion (2024 - $4.5 billion). Of this amount, 46.9% is fully collateralized by our reinsurers, 51.5% is recoverable from reinsurers rated A- or higher by major rating agencies and 1.6% is recoverable from reinsurers rated lower than A- by major rating agencies (2024 - 55.7%, 43.2% and 1.0%, respectively). The reinsurers with the three largest balances accounted for 12.6%, 10.1% and 7.0%, respectively, of our reinsurance recoverable balance at December 31, 2025 (2024 - 12.6%, 11.0% and 8.3%, respectively). The provision for current expected credit losses recorded against reinsurance recoverable was $13.2 million at December 31, 2025 (2024 - $11.7 million). The three largest company-specific components of the provision for current expected credit losses represented 20.4%, 17.2% and 4.8%, respectively, of our total provision for current expected credit losses at December 31, 2025 (2024 - 23.9%, 7.2% and 5.9%, respectively).
Refer to “Note 7. Reinsurance,” in our “Notes to the Consolidated Financial Statements” for additional information on reinsurance recoverable.
Fair Value Measurements and Impairments
Fair Value Measurements
The use of fair value to measure certain assets and liabilities with resulting unrealized gains or losses is pervasive within our consolidated financial statements. Fair value is defined under accounting guidance currently applicable to us as the price that would be received upon the sale of an asset or paid to transfer a liability in an orderly transaction between open market participants at the measurement date. We recognize the change in unrealized gains and losses arising from changes in fair value in our consolidated statements of operations.
FASB ASC Topic 820, Fair Value Measurement prescribes a fair value hierarchy that prioritizes the inputs to the respective valuation techniques used to measure fair value. The hierarchy gives the highest priority to unadjusted quoted prices in active markets for identical assets or liabilities (Level 1) and the lowest priority to valuation techniques that use at least one significant input that is unobservable (Level 3).
In certain cases, the inputs used to measure fair value may fall into different levels of the fair value hierarchy. In such cases, the level in the fair value hierarchy within which the fair value measurement in its entirety falls has been determined based on the lowest level input that is significant to the fair value measurement of the asset or liability. Our assessment of the significance of a particular input to the fair value measurement in its entirety requires judgment, and we consider factors specific to the asset or liability.
In order to determine if a market is active or inactive for a security, we consider a number of factors, including, but not limited to, the spread between what a seller is asking for a security and what a buyer is bidding for the same security, the volume of trading activity for the security in question, the price of the security compared to its par value (for fixed maturity investments), and other factors that may be indicative of market activity.
At December 31, 2025, we classified $182.1 million and $0.1 million of our assets and liabilities, respectively, at fair value on a recurring basis using Level 3 inputs (2024 - $45.8 million and $2.4 million, respectively). This represented 0.3% and 0.0% of our total assets and liabilities, respectively (2024 - 0.1% and 0.0%, respectively). Level 3 fair value measurements are based on valuation techniques that use at least one significant input that is unobservable. These measurements are made under circumstances in which there is little, if any, market activity for the asset or liability. We use valuation models or other pricing techniques that require a variety of inputs including contractual terms, market prices and rates, yield curves, credit curves, measures of volatility including credit spreads and projected cash flows, prepayment rates
67
and correlations of such inputs, some of which may be unobservable, to value these Level 3 assets and liabilities.
Refer to “Note 6. Fair Value Measurements” in our “Notes to the Consolidated Financial Statements” for additional information about fair value measurements.
Impairments
The amount and timing of asset impairment is subject to significant estimation techniques and is a critical accounting estimate for us. The significant impairment reviews we complete are for our goodwill and other intangible assets and equity method investments, as described in more detail below.
Goodwill and Other Intangible Assets
Goodwill and other intangible assets acquired are initially recorded at fair value, the assessment of which requires significant judgments, assumptions and estimates which are inherently subjective. As discussed above, the measurement of fair values is a critical accounting estimate, and involves numerous inputs into the assessment, including a range of reasonable judgments that impact the determination of fair value. Subsequent to initial recognition, finite lived other intangible assets are amortized over their estimated useful life, subject to impairment, and goodwill and indefinite lived other intangible assets are carried at the lower of cost or fair value, subject to impairment. If goodwill or other intangible assets are impaired, they are written down to their estimated fair values with a corresponding expense reflected in our consolidated statements of operations.
We assess goodwill and other intangible assets for impairment in the second half of each year, or more frequently if events or changes in circumstances indicate that the carrying amount may not be recoverable. For purposes of the annual impairment evaluation, we assess qualitative factors to determine if events or circumstances exist that would lead us to conclude that it is more likely than not that the fair value of a reporting unit is less than its carrying amount. If we determine that it is not more likely than not that the fair value of a reporting unit is less than its carrying amount, then we do not perform a quantitative evaluation. Should we determine that a quantitative analysis is required, we will first determine the fair value of the reporting unit and compare that with the carrying value, including goodwill. If the fair value of the reporting unit exceeds its carrying amount, then goodwill is not considered impaired and no further analysis is required. If the carrying amount of a reporting unit exceeds its fair value, we then proceed to determine the amount of the impairment charge, if any. There are many assumptions and estimates underlying the fair value calculation. Principally, we identify the reporting unit or business entity that the goodwill or other intangible asset is attributed to, and review historical and forecasted operating and financial performance and other underlying factors affecting such analysis, including market conditions. Other assumptions used could produce significantly different results which may result in a change in the value of goodwill or our other intangible assets and a related charge in our consolidated statements of operations. An impairment charge could be recognized in the event of a significant decline in the implied fair value of those operations where the goodwill or other intangible assets are applicable. In the event we determine that the value of goodwill has become impaired, an accounting charge will be taken in the fiscal quarter in which such determination is made, which could have a material adverse effect on our results of operations in the period in which the impairment charge is recorded.
As a result of our impairment assessment performed during the second half of 2025, the Company determined that there was no impairment during 2025, and therefore the Company recorded no intangible asset impairment or goodwill charge during the year ended December 31, 2025. Refer to “Note 4. Goodwill and Other Intangible Assets” in our “Notes to the Consolidated Financial Statements” for additional information.
As at December 31, 2025, excluding the amounts recorded in investments in other ventures, under the equity method, as noted below, our consolidated balance sheets include $300.5 million of goodwill (2024 - $300.5 million) and $332.6 million of other intangible assets (2024 - $403.6 million). Impairment charges related to these balances were $Nil during 2025 (2024 - $13.8 million). Refer to “Note 3. Acquisition of Validus” in our “Notes to the Consolidated Financial Statements” for additional information with respect to goodwill and intangible assets acquired in connection with the Validus Acquisition. In the future, it is possible we will hold more goodwill and intangible assets, which would increase the degree of judgment and
68
uncertainty embedded in our financial statements, and potentially increase the volatility of our reported results.
Investments in Other Ventures, Under Equity Method
Investments in which we have significant influence over the operating and financial policies of the investee are classified as investments in other ventures, under equity method, and are accounted for under the equity method of accounting. Under this method, we record our proportionate share of income or loss from such investments in our results for the period. Any decline in the value of investments in other ventures, under equity method, including goodwill and other intangible assets arising upon acquisition of the investee, considered by management to be other-than-temporary, is reflected in our consolidated statements of operations in the period in which it is determined. As of December 31, 2025, we had $121.9 million (2024 - $102.8 million) in investments in other ventures, under equity method on our consolidated balance sheets, including $8.7 million of goodwill and $0.2 million of other intangible assets (2024 - $8.7 million and $0.2 million). The carrying value of our investments in other ventures, under equity method, individually or in the aggregate, may, and likely will, differ from the realized value we may ultimately attain, perhaps significantly so.
In determining whether an equity method investment is impaired, we take into consideration a variety of factors including the operating and financial performance of the investee, the investee’s future business plans and projections, recent transactions and market valuations of publicly traded companies where available, discussions with the investee’s management, and our intent and ability to hold the investment until it recovers in value. Accordingly, we make assumptions and estimates in assessing whether an impairment has occurred and if, in the future, our assumptions and estimates made in assessing the fair value of these investments change, this could result in a material decrease in the carrying value of these investments. This would cause us to write-down the carrying value of these investments and could have a material adverse effect on our results of operations in the period the impairment charge is taken. We do not have any current plans to dispose of these investments, and cannot assure you we will consummate future transactions in which we realize the value at which these holdings are reflected in our financial statements. During 2025, we recorded no impairment charge associated with our investments in other ventures, under equity method (2024 - $9.1 million).
Income Taxes
Income taxes have been determined in accordance with the provisions of FASB ASC Topic 740, Income Taxes. Deferred tax assets and liabilities result from temporary differences between the amounts recorded in our consolidated financial statements and the tax basis of our assets and liabilities. Such temporary differences are primarily due to net operating loss and capital loss carryforwards and GAAP versus tax basis accounting differences relating to insurance-related assets and liabilities, investments, and deferred revenues and expenses, among others. The effect on deferred tax assets and liabilities of a change in tax laws or tax rates is recognized in income in the period in which the change is enacted. A valuation allowance against net deferred tax assets is recorded if it is more likely than not that all, or some portion, of the benefits related to net deferred tax assets will not be realized. Significant judgments, assumptions and estimates which are inherently subjective are required in determining income tax expense, temporary differences, the deferred tax impact of a change in law, and valuation allowances. Refer to “Note 15. Taxation” in our “Notes to the Consolidated Financial Statements” for additional information.
Deferred Tax Assets and Liabilities
At December 31, 2025, our net deferred tax asset before valuation allowance and valuation allowance were $747.0 million and $80.1 million, respectively (2024 - $822.6 million and $147.1 million, respectively). At each balance sheet date, we assess the need to establish a valuation allowance that reduces the net deferred tax asset when it is more likely than not that all, or some portion, of the net deferred tax assets will not be realized. The valuation allowance assessment is performed separately in each taxable jurisdiction based on all available information including projections of future GAAP taxable income from each tax-paying component in each tax jurisdiction.
69
Unrecognized Tax Benefits
We have unrecognized tax benefits of $Nil as of December 31, 2025 (2024 - $Nil). Interest and penalties related to unrecognized tax benefits would be recognized in income tax expense. At December 31, 2025, interest and penalties accrued on unrecognized tax benefits were $Nil (2024 - $Nil).
70
SUMMARY OF RESULTS OF OPERATIONS
Below is a discussion of the results of operations for 2025, compared to 2024.
| Year ended December 31, | 2025 | 2024 | Change | ||||||||||||||||||||
| (in thousands, except per share amounts and percentages) | |||||||||||||||||||||||
| Statements of Operations Highlights | |||||||||||||||||||||||
Gross premiums written | $ | 11,738,420 | $ | 11,733,066 | $ | 5,354 | |||||||||||||||||
Net premiums written | $ | 9,870,200 | $ | 9,952,216 | $ | (82,016) | |||||||||||||||||
Net premiums earned | $ | 9,901,182 | $ | 10,095,760 | $ | (194,578) | |||||||||||||||||
Net claims and claim expenses incurred | 5,615,839 | 5,332,981 | 282,858 | ||||||||||||||||||||
Acquisition expenses | 2,550,823 | 2,643,867 | (93,044) | ||||||||||||||||||||
Operational expenses | 464,477 | 496,588 | (32,111) | ||||||||||||||||||||
| Underwriting income (loss) | $ | 1,270,043 | $ | 1,622,324 | $ | (352,281) | |||||||||||||||||
| Net investment income | $ | 1,703,475 | $ | 1,654,289 | $ | 49,186 | |||||||||||||||||
Equity in earnings (losses) of other ventures (1) | 71,332 | 47,087 | 24,245 | ||||||||||||||||||||
Net realized and unrealized gains (losses) on investments | 1,181,268 | (27,840) | 1,209,108 | ||||||||||||||||||||
Total investment result (1) | $ | 2,956,075 | $ | 1,673,536 | $ | 1,282,539 | |||||||||||||||||
| Net income (loss) | $ | 3,617,743 | $ | 2,960,532 | $ | 657,211 | |||||||||||||||||
| Net income (loss) available (attributable) to RenaissanceRe common shareholders | $ | 2,646,959 | $ | 1,834,985 | $ | 811,974 | |||||||||||||||||
| Net income (loss) available (attributable) to RenaissanceRe common shareholders per common share – diluted | $ | 56.03 | $ | 35.21 | $ | 20.82 | |||||||||||||||||
Dividends per common share | $ | 1.60 | $ | 1.56 | $ | 0.04 | |||||||||||||||||
| Key Ratios | |||||||||||||||||||||||
Net claims and claim expense ratio – current accident year | 67.7 | % | 61.3 | % | 6.4 | pts | |||||||||||||||||
Net claims and claim expense ratio – prior accident years | (11.0) | % | (8.5) | % | (2.5) | pts | |||||||||||||||||
| Net claims and claim expense ratio – calendar year | 56.7 | % | 52.8 | % | 3.9 | pts | |||||||||||||||||
| Underwriting expense ratio | 30.5 | % | 31.1 | % | (0.6) | pts | |||||||||||||||||
| Combined ratio | 87.2 | % | 83.9 | % | 3.3 | pts | |||||||||||||||||
| Return on average common equity | 25.9 | % | 19.3 | % | 6.6 | pts | |||||||||||||||||
| Book Value | December 31, 2025 | December 31, 2024 | Change | ||||||||||||||||||||
Book value per common share | $ | 247.00 | $ | 195.77 | $ | 51.23 | |||||||||||||||||
Accumulated dividends per common share | 29.68 | 28.08 | 1.60 | ||||||||||||||||||||
Book value per common share plus accumulated dividends | $ | 276.68 | $ | 223.85 | $ | 52.83 | |||||||||||||||||
| Year to date change in book value per common share | 26.2 | % | |||||||||||||||||||||
| Year to date change in book value per common share plus change in accumulated dividends | 27.0 | % | |||||||||||||||||||||
(1)In 2025, the Company revised its presentation of “total investment result” to include equity in earnings (losses) of other ventures. Comparative information for the prior periods presented have been updated to conform to the current presentation.
71
Net income available to RenaissanceRe common shareholders was $2.6 billion in 2025, compared to $1.8 billion in 2024. As a result, in 2025 we generated an annualized return on average common equity of 25.9% and our book value per common share increased from $195.77 at December 31, 2024 to $247.00 at December 31, 2025, an 26.2% increase, or an 27.0% increase, after considering the change in accumulated dividends paid to our common shareholders.
The most significant items affecting our financial performance during 2025, on a comparative basis to 2024, include:
•Underwriting Results
–underwriting income of $1.3 billion, a decrease of $352.3 million, and an increase in the combined ratio of 3.3 percentage points, driven primarily by:
–a $785.7 million net negative impact on net income available to RenaissanceRe common shareholders from the 2025 Large Loss Events, compared to $660.5 million from the 2024 Large Loss Events; partially offset by
–higher prior accident year net favorable development, driven by the Property segment.
•Investment Results
–total investment result increased by $1.3 billion, primarily driven by:
–an increase of $1.2 billion in net realized and unrealized gains on investments; and
–an increase in net investment income of $49.2 million.
–net investment income of $1.7 billion included $519.5 million attributable to redeemable noncontrolling interests which was allocated to third-party investors and not retained by us.
•Fee Income
–income of $328.9 million, increased by $2.1 million primarily due to:
–an increase of $14.4 million in performance fees; and
–a decrease of $12.4 million in management fees.
–included $250.1 million of fee income recorded in net income (loss) attributable to redeemable noncontrolling interest, which is not included in our underwriting income (loss).
•Net Income (Loss) Attributable to Redeemable Noncontrolling Interests
–income of $935.4 million, which represents the portion of our net income (loss) that is allocated to third-party investors and not retained by us.
–decreased by $154.8 million, primarily due to the increased impact of the large losses in 2025 as compared to 2024, despite strong underwriting results.
•Income Tax Benefit (Expense)
–expense of $396.3 million, an increase of $363.7 million, primarily driven by strong profitability across our operating jurisdictions, including Bermuda.
72
Net Negative Impact
Net negative impact on underwriting result includes the sum of (1) net claims and claim expenses incurred, (2) assumed and ceded reinstatement premiums earned and (3) earned and lost profit commissions. Net negative impact on net income (loss) available (attributable) to RenaissanceRe common shareholders is the sum of (1) net negative impact on underwriting result, (2) redeemable noncontrolling interest and (3) income tax benefit (expense) beginning in the first quarter of 2025. Prior to January 1, 2025, net negative impact on net income (loss) available (attributable) to RenaissanceRe common shareholders did not include any related income tax benefit (expense) as it was not meaningful prior to the implementation of the Bermuda CIT effective January 1, 2025.
Our estimates of net negative impact are based on a review of our potential exposures, preliminary discussions with certain counterparties and actuarial modeling techniques. Our actual net negative impact, both individually and in the aggregate, may vary from these estimates, perhaps materially. Changes in these estimates will be recorded in the period in which they occur.
Meaningful uncertainty remains regarding the estimates and the nature and extent of the losses from these catastrophe events, driven by the magnitude and recent nature of the events, the geographic areas impacted by the events, relatively limited claims data received to date, the contingent nature of business interruption and other exposures, potential uncertainties relating to reinsurance recoveries and other factors inherent in loss estimation, among other things.
2025 Net Negative Impact
The financial data below provides additional information detailing the net negative impact of the 2025 Large Loss Events on our segment underwriting results and consolidated combined ratio for 2025.
| Year ended December 31, 2025 | California Wildfires (1) | Hurricane Melissa | Other 2025 Large Loss Events (2) | 2025 Large Loss Events (3) | |||||||||||||||||||||||||
| (in thousands, except percentages) | |||||||||||||||||||||||||||||
| Net negative impact on Property segment underwriting result | $ | (1,094,657) | $ | (86,558) | $ | (2,060) | $ | (1,183,275) | |||||||||||||||||||||
| Net negative impact on Casualty and Specialty segment underwriting result | (40,442) | (2,006) | (188,139) | (230,587) | |||||||||||||||||||||||||
| Net negative impact on underwriting result | $ | (1,135,099) | $ | (88,564) | $ | (190,199) | $ | (1,413,862) | |||||||||||||||||||||
| Percentage point impact on consolidated combined ratio | 12.3 | 0.9 | 2.1 | 15.3 | |||||||||||||||||||||||||
The financial data below provides additional information detailing the net negative impact of the 2025 Large Loss Events on our consolidated financial statements for 2025.
| Year ended December 31, 2025 | California Wildfires (1) | Hurricane Melissa | Other 2025 Large Loss Events (2) | 2025 Large Loss Events (3) | |||||||||||||||||||||||||
| (in thousands) | |||||||||||||||||||||||||||||
Net claims and claim expenses incurred | $ | (1,470,746) | $ | (100,426) | $ | (204,823) | $ | (1,775,995) | |||||||||||||||||||||
| Assumed reinstatement premiums earned | 332,733 | 12,215 | 28,307 | 373,255 | |||||||||||||||||||||||||
| Ceded reinstatement premiums earned | (20,983) | (133) | (13,683) | (34,799) | |||||||||||||||||||||||||
| Earned (lost) profit commissions | 23,897 | (220) | — | 23,677 | |||||||||||||||||||||||||
| Net negative impact on underwriting result | (1,135,099) | (88,564) | (190,199) | (1,413,862) | |||||||||||||||||||||||||
| Redeemable noncontrolling interest | 432,891 | 20,373 | 35,973 | 489,237 | |||||||||||||||||||||||||
| Income tax benefit (expense) | 107,776 | 9,071 | 22,050 | 138,897 | |||||||||||||||||||||||||
| Net negative impact on net income (loss) available (attributable) to RenaissanceRe common shareholders | $ | (594,432) | $ | (59,120) | $ | (132,176) | $ | (785,728) | |||||||||||||||||||||
(1)The “California Wildfires” were a series of wildfires that burned throughout southern California in January 2025.
(2)“Other 2025 Large Loss Events” represents: the crash of American Airlines flight 5342, certain refinery fires in the first quarter of 2025, the crash of UPS Airlines flight 2976, and the Grasberg mine landslide.
(3)“2025 Large Loss Events” includes the California Wildfires, Hurricane Melissa and the Other 2025 Large Loss Events.
73
2024 Net Negative Impact
The financial data below provides additional information detailing the net negative impact of the 2024 Large Loss Events on our segment underwriting results and consolidated financial statements for 2024.
| Year ended December 31, 2024 | Hurricane Milton | Hurricane Helene | Other 2024 Large Loss Events (1) | 2024 Large Loss Events (2) | |||||||||||||||||||||||||
| (in thousands, except percentages) | |||||||||||||||||||||||||||||
| Net negative impact on Property segment underwriting result | $ | (332,710) | $ | (179,618) | $ | (267,513) | $ | (779,841) | |||||||||||||||||||||
| Net negative impact on Casualty and Specialty segment underwriting result | — | (605) | (66,907) | (67,512) | |||||||||||||||||||||||||
| Net negative impact on underwriting result | $ | (332,710) | $ | (180,223) | $ | (334,420) | $ | (847,353) | |||||||||||||||||||||
| Percentage point impact on consolidated combined ratio | 3.4 | 1.8 | 3.6 | 8.8 | |||||||||||||||||||||||||
The financial data below provides additional information detailing the net negative impact of the 2024 Large Loss Events on our consolidated financial statements for 2024.
| Year ended December 31, 2024 | Hurricane Milton | Hurricane Helene | Other 2024 Large Loss Events (1) | 2024 Large Loss Events (2) | |||||||||||||||||||||||||
| (in thousands) | |||||||||||||||||||||||||||||
Net claims and claim expenses incurred | $ | (406,878) | $ | (217,767) | $ | (381,330) | $ | (1,005,975) | |||||||||||||||||||||
| Assumed reinstatement premiums earned | 86,128 | 40,655 | 53,159 | 179,942 | |||||||||||||||||||||||||
| Ceded reinstatement premiums earned | (2,158) | (931) | (9,971) | (13,060) | |||||||||||||||||||||||||
| Earned (lost) profit commissions | (9,802) | (2,180) | 3,722 | (8,260) | |||||||||||||||||||||||||
| Net negative impact on underwriting result | (332,710) | (180,223) | (334,420) | (847,353) | |||||||||||||||||||||||||
| Redeemable noncontrolling interest | 62,229 | 36,969 | 87,625 | 186,823 | |||||||||||||||||||||||||
| Net negative impact on net income (loss) available (attributable) to RenaissanceRe common shareholders | $ | (270,481) | $ | (143,254) | $ | (246,795) | $ | (660,530) | |||||||||||||||||||||
(1)“Other 2024 Large Loss Events” includes: the Baltimore Bridge Collapse; a series of severe convective storms that impacted the Southern and Midwest United States; the Hualien earthquake which impacted Taiwan in April 2024; a severe hailstorm which impacted Calgary in August 2024, Hurricanes Debby and Beryl, and certain aggregate loss contracts triggered during 2024.
(2)“2024 Large Loss Events” includes: Hurricanes Milton and Helene, and the “Other 2024 Large Loss Events.”
74
Underwriting Results by Segment
Property Segment
Below is a summary of the underwriting results and ratios for our Property segment:
| Year ended December 31, | 2025 | 2024 | Change | ||||||||||||||||||||
| (in thousands, except percentages) | |||||||||||||||||||||||
| Gross premiums written | $ | 4,942,141 | $ | 4,823,731 | $ | 118,410 | |||||||||||||||||
| Net premiums written | $ | 4,043,996 | $ | 3,833,636 | $ | 210,360 | |||||||||||||||||
| Net premiums earned | $ | 3,971,669 | $ | 3,850,352 | $ | 121,317 | |||||||||||||||||
| Net claims and claim expenses incurred | 1,426,015 | 1,141,726 | 284,289 | ||||||||||||||||||||
| Acquisition expenses | 714,852 | 758,554 | (43,702) | ||||||||||||||||||||
| Operational expenses | 297,481 | 302,360 | (4,879) | ||||||||||||||||||||
| Underwriting income (loss) | $ | 1,533,321 | $ | 1,647,712 | $ | (114,391) | |||||||||||||||||
Net claims and claim expenses incurred – current accident year | $ | 2,515,211 | $ | 1,960,578 | $ | 554,633 | |||||||||||||||||
Net claims and claim expenses incurred – prior accident years | (1,089,196) | (818,852) | (270,344) | ||||||||||||||||||||
Net claims and claim expenses incurred – total | $ | 1,426,015 | $ | 1,141,726 | $ | 284,289 | |||||||||||||||||
Net claims and claim expense ratio – current accident year | 63.3 | % | 50.9 | % | 12.4 | pts | |||||||||||||||||
Net claims and claim expense ratio – prior accident years | (27.4) | % | (21.2) | % | (6.2) | pts | |||||||||||||||||
Net claims and claim expense ratio – calendar year | 35.9 | % | 29.7 | % | 6.2 | pts | |||||||||||||||||
Underwriting expense ratio | 25.5 | % | 27.5 | % | (2.0) | pts | |||||||||||||||||
Combined ratio | 61.4 | % | 57.2 | % | 4.2 | pts | |||||||||||||||||
Property Gross Premiums Written
•Gross premiums written increased by $118.4 million, or 2.5%, driven by:
–an increase in the catastrophe class of $321.3 million, or 10.7%, and included:
–an increase of $145.8 million, or 5.0%, without the impact of reinstatement premiums, driven by strong mid-year renewals with growth on existing clients as well as new underwriting opportunities, including U.S. catastrophe exposed business; and
–an increase in reinstatement premiums of $175.5 million, due to the increased impact of the large losses in 2025 as compared to 2024; partially offset by
–a decrease of $202.9 million, or 11.1%, in the other property class, primarily reflecting premium adjustments, in part due to rate decreases in the excess and surplus business.
Property Ceded Premiums Written
| Year ended December 31, | 2025 | 2024 | Change | ||||||||||||||||||||
| (in thousands) | |||||||||||||||||||||||
| Ceded premiums written | $ | 898,145 | $ | 990,095 | $ | (91,950) | |||||||||||||||||
Due to the potential volatility of the reinsurance contracts which we sell, we purchase reinsurance to reduce our exposure to large losses and to help manage our risk portfolio. To the extent that appropriately priced coverage is available, we anticipate continued use of retrocessional reinsurance to reduce the impact of large losses on our financial results and to manage our portfolio of risk; however, the buying of ceded
75
reinsurance in our Property segment is based on market opportunities and is not based on placing a specific reinsurance program each year.
•Ceded premiums written decreased by $92.0 million, or 9.3%, as part of our gross-to-net strategy, driven by:
–reduced utilization of Upsilon, which was not deployed at the January 1 renewals and with reduced deployment at the mid-year renewals;
–reduced ceded spend and limit purchased within our other property class; and
–a reduction in ceded reinstatement premiums, largely driven by the increase in prior accident year favorable development; partially offset by
–an increase in ceded spend and limit purchased in our catastrophe class, including additional limit purchased in response to the California Wildfires and growth in the assumed catastrophe portfolio.
Property Net Premiums Earned
•Net premiums earned increased by $121.3 million, or 3.2%, driven by:
–$290.3 million of net reinstatement premiums, primarily from the 2025 Large Loss Events; partially offset by
–a decrease in gross premiums written within the other property class.
Property Underwriting Results
•Net claims and claim expense ratio increased by 6.2 percentage points, driven by:
–a 12.4 percentage point increase in the current accident year net claims and claim expense ratio, which consisted of a 36.1 percentage point impact from the 2025 Large Loss Events, compared to 23.0 percentage points from the 2024 Large Loss Events in 2024, and included:
–a 25.3 percentage point increase in the catastrophe class, which included a 53.2 percentage point impact from the 2025 Large Loss Events, compared to the 2024 Large Loss Events, which added 28.6 percentage points in 2024; partially offset by
–a 6.8 percentage point improvement in the other property class due to lower catastrophe losses in 2025, which included a 9.6 percentage point impact from the 2025 Large Loss Events, compared to a 16.7 percentage point impact in 2024 from the 2024 Large Loss Events.
–net favorable development of 27.4% in the prior accident years net claims and claim expense ratio, and included:
–net favorable development of $613.4 million in the catastrophe class, primarily from the large loss events across the 2021 to 2024 accident years; and
–net favorable development of $475.8 million in the other property class, primarily due to reported losses coming in lower than expected from large loss events in 2022 and 2024, and attritional loss experience.
•Underwriting expense ratio improved by 2.0 percentage points, driven by:
–a 1.6 percentage point improvement in the acquisition expense ratio, due to:
–a 0.7 percentage point improvement from the increase in net reinstatement premiums primarily related to the 2025 Large Loss Events; and
–a 0.9 percentage point improvement primarily reflecting an increase in profit commissions from Upsilon, driven by strong current underwriting year results as well as prior accident year favorable development.
76
–a 0.4 percentage point improvement in the operating expense ratio, due to:
–an increase in net reinstatement premiums primarily related to the 2025 Large Loss Events; and
–the Bermuda tax credits which were enacted in the fourth quarter of 2025; partially offset by
–an increase in compensation expenses in addition to a reduction in operating expenses recorded through underwriting income (loss).
•Combined ratio of 61.4%, which included a 35.7 percentage points impact from the 2025 Large Loss Events, partially offset by an increase in prior accident year net favorable development.
•Net negative impact on the Property segment underwriting result of $1.2 billion from the 2025 Large Loss Events,
–compared to the 2024 Large Loss Events, which had a $779.8 million net negative impact on the Property segment underwriting result and added 23.0 percentage points to the combined ratio in 2024.
Refer to “Part II, Item 7. Management’s Discussion and Analysis of Financial Condition and Results of Operations—Summary of Critical Accounting Estimates—Claims and Claim Expense Reserves” and “Note 8. Reserve for Claims and Claim Expenses” in our “Notes to the Consolidated Financial Statements” for additional discussion of our reserving techniques and prior year development of net claims and claim expenses.
Casualty and Specialty Segment
Below is a summary of the underwriting results and ratios for our Casualty and Specialty segment:
| Year ended December 31, | 2025 | 2024 | Change | ||||||||||||||||||||
| (in thousands, except percentages) | |||||||||||||||||||||||
| Gross premiums written | $ | 6,796,279 | $ | 6,909,335 | $ | (113,056) | |||||||||||||||||
| Net premiums written | $ | 5,826,204 | $ | 6,118,580 | $ | (292,376) | |||||||||||||||||
| Net premiums earned | $ | 5,929,513 | $ | 6,245,408 | $ | (315,895) | |||||||||||||||||
| Net claims and claim expenses incurred | 4,189,824 | 4,191,255 | (1,431) | ||||||||||||||||||||
| Acquisition expenses | 1,835,971 | 1,885,313 | (49,342) | ||||||||||||||||||||
| Operational expenses | 166,996 | 194,228 | (27,232) | ||||||||||||||||||||
| Underwriting income (loss) | $ | (263,278) | $ | (25,388) | $ | (237,890) | |||||||||||||||||
Net claims and claim expenses incurred – current accident year | $ | 4,191,561 | $ | 4,223,737 | $ | (32,176) | |||||||||||||||||
Net claims and claim expenses incurred – prior accident years | (1,737) | (32,482) | 30,745 | ||||||||||||||||||||
Net claims and claim expenses incurred – total | $ | 4,189,824 | $ | 4,191,255 | $ | (1,431) | |||||||||||||||||
Net claims and claim expense ratio – current accident year | 70.7 | % | 67.6 | % | 3.1 | pts | |||||||||||||||||
Net claims and claim expense ratio – prior accident years | — | % | (0.5) | % | 0.5 | pts | |||||||||||||||||
Net claims and claim expense ratio – calendar year | 70.7 | % | 67.1 | % | 3.6 | pts | |||||||||||||||||
Underwriting expense ratio | 33.7 | % | 33.3 | % | 0.4 | pts | |||||||||||||||||
Combined ratio | 104.4 | % | 100.4 | % | 4.0 | pts | |||||||||||||||||
77
Casualty and Specialty Gross Premiums Written
•Gross premiums written decreased by $113.1 million, or 1.6%, driven by:
–decreases in the professional liability, general casualty and other specialty classes of 11.2%, 5.9% and 6.6%, respectively, principally due to exposure reductions in the casualty lines of business and changes in premium estimates on business underwritten in prior years in the other specialty class, largely from rate pressure in cyber; partially offset by
–an increase of 35.8% in the credit class, primarily due to growth in our existing mortgage book of business.
Casualty and Specialty Ceded Premiums Written
| Year ended December 31, | 2025 | 2024 | Change | ||||||||||||||||||||
| (in thousands) | |||||||||||||||||||||||
| Ceded premiums written | $ | 970,075 | $ | 790,755 | $ | 179,320 | |||||||||||||||||
We purchase reinsurance to reduce our exposure to large losses and to help manage our risk portfolio. To the extent that appropriately priced coverage is available, we anticipate continued use of retrocessional reinsurance to reduce the impact of large losses on our financial results and to manage our portfolio of risk. As in our Property segment, the buying of ceded reinsurance in our Casualty and Specialty segment is based on market opportunities and is not based on placing a specific reinsurance program each year.
•Ceded premiums written increased by $179.3 million, or 22.7%, driven by:
–an increase in the amount of quota share retrocessional coverage purchased.
Casualty and Specialty Net Premiums Written
•Net premiums written decreased by $292.4 million, or 4.8%, consistent with the changes in gross premiums written and quota share retrocessional coverage purchased.
Casualty and Specialty Underwriting Results
•Underwriting loss of $263.3 million, included:
–a $230.6 million impact from the 2025 Large Loss Events; and
–$119.1 million from purchase accounting related adjustments principally related to the Validus Acquisition.
•Net claims and claim expense ratio increased by 3.6 percentage points, and included:
–a 3.1 percentage point increase in the current accident year net claims and claim expense ratio, principally driven by:
–the 2025 Large Loss Events, which contributed 4.1 percentage points to the current accident year claims and claim expense ratio; and
–higher attritional losses, primarily within the casualty lines of business.
–net favorable development of $1.7 million in the prior accident year net claims and claim expense ratio, principally driven by:
–reported losses generally coming in lower than expected on attritional net claims and claim expenses from the other specialty, credit, and professional liability classes; partially offset by
–adverse development from the general liability line of business; and
–an adverse impact of 0.5 percentage points from purchase accounting adjustments.
78
•Underwriting expense ratio increased by 0.4 percentage points, principally driven by:
–changes in mix of business from increased mortgage premium, which carries higher acquisition costs; partially offset by
–the Bermuda tax credits which were enacted in the fourth quarter of 2025.
•Combined ratio of 104.4%, which included a 3.8 percentage point impact from the 2025 Large Loss Events.
Refer to “Part II, Item 7. Management’s Discussion and Analysis of Financial Condition and Results of Operations—Summary of Critical Accounting Estimates—Claims and Claim Expense Reserves” and “Note 8. Reserve for Claims and Claim Expenses” in our “Notes to the Consolidated Financial Statements” for additional discussion of our reserving techniques and prior year development of net claims and claim expenses.
Our relative mix of business between proportional business and excess of loss business has fluctuated in the past and will likely continue to do so in the future. Proportional business, which represents the majority of our Casualty and Specialty segment business, typically has a higher expense ratio and tends to be exposed to more attritional and frequent losses, while being subject to lower expected severity compared to traditional excess of loss business.
Fee Income
The table below shows the total fee income we earned from third-party capital management activities, including various joint ventures and managed funds, and certain structured reinsurance products.
Management fees are fees that we receive for the day-to-day management and oversight of our joint venture vehicles, managed funds and certain structured reinsurance products. Performance fees are based on the performance of the individual vehicles or products and may be zero or negative in a particular period. For example, large losses could potentially result in no performance fees or the reversal of previously accrued performance fees.
| Year ended December 31, | 2025 | 2024 | Change | ||||||||||||||||||||
| (in thousands) | |||||||||||||||||||||||
| Management Fee Income | |||||||||||||||||||||||
Joint ventures (1) | $ | 150,823 | $ | 157,427 | $ | (6,604) | |||||||||||||||||
Managed funds (2) | 26,338 | 33,228 | (6,890) | ||||||||||||||||||||
Structured reinsurance products and other (3) | 30,323 | 29,205 | 1,118 | ||||||||||||||||||||
Total management fee income | 207,484 | 219,860 | (12,376) | ||||||||||||||||||||
Performance Fee Income (Loss) | |||||||||||||||||||||||
Joint ventures (1) | 70,721 | 74,903 | (4,182) | ||||||||||||||||||||
Managed funds (2) | 26,944 | 10,785 | 16,159 | ||||||||||||||||||||
Structured reinsurance products and other (3) | 23,703 | 21,248 | 2,455 | ||||||||||||||||||||
Total performance fee income (loss) | 121,368 | 106,936 | 14,432 | ||||||||||||||||||||
Total fee income | $ | 328,852 | $ | 326,796 | $ | 2,056 | |||||||||||||||||
(1)Joint ventures include DaVinci, Top Layer, Vermeer, and Fontana.
(2)Managed funds include Upsilon Fund, Medici and Medici UCITS, as well as certain third-party capital vehicles we manage through AlphaCat Managers.
(3)Structured reinsurance products and other includes certain reinsurance agreements and other vehicles through which we transfer risk to third-party capital.
79
•Total fee income increased by $2.1 million, due to:
–an increase in performance fees of $14.4 million, driven by strong current year underwriting results in DaVinci and Upsilon, and higher prior accident years net favorable development, primarily in Upsilon; partially offset by
–a decrease in management fee income of $12.4 million, driven by:
–a reduction in management fees from DaVinci as a result of the recapture of previously deferred management fees during 2024 that related to prior years, compared to no recapture related to prior years in 2025; and
–a decrease in management fees from AlphaCat Managers due to the continued release of trapped collateral to investors.
•Total fee income included $250.1 million of fee income recorded in net income (loss) attributable to redeemable noncontrolling interest, which is not included in our underwriting income (loss).
The fee income we earned from third-party capital management activities and certain structured reinsurance products is recorded in multiple line items in our financial statements. The table below summarizes the impact of fee income on the financial statements. Fee income recorded in net income (loss) attributable to redeemable noncontrolling interest is not included in underwriting income (loss).
| Year ended December 31 | 2025 | 2024 | Change | ||||||||||||||||||||
| (in thousands) | |||||||||||||||||||||||
Fee income recorded in net income (loss) attributable to redeemable noncontrolling interest | $ | 250,089 | $ | 283,873 | $ | (33,784) | |||||||||||||||||
Fee income recorded in underwriting income (loss) (1) | 78,763 | 42,923 | 35,840 | ||||||||||||||||||||
| Total fee income | $ | 328,852 | $ | 326,796 | $ | 2,056 | |||||||||||||||||
(1)Reflects total fee income earned from third-party capital management activities and certain structured reinsurance products which is recorded through underwriting income (loss) as a decrease (increase) to operational expenses or acquisition expenses. During 2025, $46.3 million of management fee income was recorded as a reduction to operational expenses (2024 - $51.0 million) and $32.4 million of performance fee income was recorded as a reduction to acquisition expenses (2024 - increase to acquisition expenses of $8.1 million).
Investment Results
Net Investment Income
| Year ended December 31, | 2025 | 2024 | Change | ||||||||||||||||||||
| (in thousands) | |||||||||||||||||||||||
| Fixed maturity investments trading | $ | 1,144,271 | $ | 1,116,649 | $ | 27,622 | |||||||||||||||||
| Short term investments | 190,549 | 183,153 | 7,396 | ||||||||||||||||||||
| Equity investments | |||||||||||||||||||||||
Fixed income exchange traded funds | 48,897 | — | 48,897 | ||||||||||||||||||||
Common stock (1) | 2,671 | 2,460 | 211 | ||||||||||||||||||||
| Other investments | |||||||||||||||||||||||
| Catastrophe bonds | 200,465 | 238,844 | (38,379) | ||||||||||||||||||||
Fund and direct private equity investments (2) | 96,629 | 82,457 | 14,172 | ||||||||||||||||||||
| Cash and cash equivalents | 47,379 | 54,241 | (6,862) | ||||||||||||||||||||
| 1,730,861 | 1,677,804 | 53,057 | |||||||||||||||||||||
| Investment expenses | (27,386) | (23,515) | (3,871) | ||||||||||||||||||||
| Net investment income | $ | 1,703,475 | $ | 1,654,289 | $ | 49,186 | |||||||||||||||||
(1)In 2025, we revised the description of our “other equity investments” to “common stock.”
(2)In 2025, we revised the description of our “other investments - other” to “other investments - fund and direct private equity investments.”
80
•Net investment income remained consistently strong, with an increase of $49.2 million, primarily due to:
–higher average invested assets in the fixed maturity investments portfolio; partially offset by
–decreases in market yields.
•Net investment income included $519.5 million of income attributable to redeemable noncontrolling interests, which was ultimately allocated to third-party investors and not retained by us.
Equity in Earnings (Losses) of Other Ventures
| Year ended December 31, | 2025 | 2024 | Change | ||||||||||||||||||||
| (in thousands) | |||||||||||||||||||||||
Equity in earnings (losses) of other ventures | $ | 71,332 | $ | 47,087 | $ | 24,245 | |||||||||||||||||
Equity in earnings (losses) of other ventures represents our pro-rata share of the net income from our investments in a select group of insurance and insurance-related companies, including the Tower Hill Companies and Top Layer. Except for Top Layer, which is recorded on a current quarter basis, equity in earnings (losses) of other ventures is recorded one quarter in arrears. The carrying value of these investments on our consolidated balance sheets, individually or in the aggregate, may differ from the realized value we may ultimately attain, perhaps significantly so.
•Equity in earnings of other ventures increased by $24.2 million, driven by:
–increased profitability of our equity investments during 2025, as certain insurance and insurance-related companies reported higher revenues and net income compared to 2024.
Net Realized and Unrealized Gains (Losses) on Investments
| Year ended December 31, | 2025 | 2024 | Change | ||||||||||||||||||||
| (in thousands) | |||||||||||||||||||||||
Fixed maturity-related investments (1) (2) | $ | 504,000 | $ | (382,580) | $ | 886,580 | |||||||||||||||||
Equity related-investments (1) (3) | 188,270 | 13,309 | 174,961 | ||||||||||||||||||||
Commodity-related investments (1) (4) | 415,495 | 76,545 | 338,950 | ||||||||||||||||||||
| Other investments | |||||||||||||||||||||||
Catastrophe bonds | (10,978) | 62,353 | (73,331) | ||||||||||||||||||||
Fund and direct private equity investments (5) | 84,481 | 202,533 | (118,052) | ||||||||||||||||||||
| Net realized and unrealized gains (losses) on investments | $ | 1,181,268 | $ | (27,840) | $ | 1,209,108 | |||||||||||||||||
(1)Refer to “Note 19. Derivative Instruments” in our “Notes to Consolidated Financial Statements” for additional information on investment-related derivatives.
(2)Includes fixed maturity investments and investment-related derivatives, which includes interest rate futures, credit default swaps and interest rate swaps.
(3)Includes equity investments and investment-related derivatives, which includes equity futures and warrants.
(4)Represents commodity-related derivatives, which includes commodity futures and commodity options.
(5)In 2025, we revised the description of our “other investments - other” to “other investments - fund and direct private equity investments.”
We structure our investment portfolio to emphasize the preservation of capital and the availability of liquidity to meet our claims obligations, to be well diversified across market sectors, and to generate relatively attractive returns on a risk-adjusted basis over time. As part of this strategy, we may use investment-related derivatives to obtain exposure to a particular financial market or to hedge portfolio risk. A large majority of our investments are invested in the fixed income markets and, therefore, our realized and unrealized holding gains and losses on investments are highly correlated to fluctuations in interest rates. As interest rates decline, we will tend to have realized and unrealized gains from our investment portfolio, and as interest rates rise, we will tend to have realized and unrealized losses from our investment portfolio.
81
•Net realized and unrealized gains on investments were driven by:
–$504.0 million of net realized and unrealized gains on fixed maturity-related investments, due to market yields decreasing during 2025, including net gains on interest rate futures;
–$415.5 million of net gains on commodity-related investments, principally gold futures; and
–$188.3 million of net realized and unrealized gains on equity-related investments, primarily due to increased exposure to equity futures and favorable price movements through 2025.
•Net realized and unrealized gains on investments increased by $1.2 billion, primarily driven by:
–an increase in net realized and unrealized gains on our fixed maturity-related investments of $886.6 million, primarily due to:
–$666.3 million of net realized and unrealized gains on our fixed maturity investments trading, driven by decreases in market yields in 2025, compared to increases in long term market yields in 2024;
–$220.3 million of net gains on interest rate futures and credit default swaps, due to the impact of the market yield movements in each period.
–an increase in net realized and unrealized gains on our equity-related investments of $175.0 million, primarily due to:
–increased exposure to equity futures and favorable price movements through 2025;
–an increase in net realized and unrealized gains on commodity-related investments of $339.0 million, primarily as a result of:
–increased exposure to gold futures and favorable price movements through 2025; partially offset by
–a decrease in net realized and unrealized gains on fund and direct private equity investments of $118.1 million, primarily due to TWFG Inc.’s initial public offering in 2024.
Refer to “Part II, Item 7A. Quantitative and Qualitative Disclosures About Market Risk” for additional information related to our exposure to market risk. In addition, refer to “Note 5. Investments” and “Note 19. Derivative Instruments” in our “Notes to the Consolidated Financial Statements” for additional information regarding our investments and derivatives we have entered into.
Net Foreign Exchange Gains (Losses)
| Year ended December 31, | 2025 | 2024 | Change | ||||||||||||||||||||
| (in thousands) | |||||||||||||||||||||||
| Net foreign exchange gains (losses) | $ | (13,504) | $ | (76,076) | $ | 62,572 | |||||||||||||||||
Our functional currency is the U.S. dollar. We routinely write a portion of our business in currencies other than U.S. dollars and invest a portion of our cash and investment portfolio in those currencies. We are primarily impacted by foreign currency exposures associated with our underwriting operations and our investment portfolio, and may, from time to time, enter into foreign currency forward and option contracts to minimize the effect of fluctuating foreign currencies on the value of non-U.S. dollar denominated assets and liabilities.
•Net foreign exchange losses decreased by $62.6 million, driven by:
–gains attributable to third-party investors in Medici, which are allocated through net income (loss) attributable to redeemable noncontrolling interest in 2025, compared to losses attributable to third-party investors in Medici in 2024; partially offset by
–a decrease in losses on certain foreign exchange exposures related to our underwriting activities.
Refer to “Part II, Item 7A. Quantitative and Qualitative Disclosures About Market Risk” for additional information related to our exposure to foreign currency risk and “Note 19. Derivative Instruments” in our
82
“Notes to the Consolidated Financial Statements” for additional information related to the foreign currency derivatives we have entered into.
Corporate Expenses
| Year ended December 31, | 2025 | 2024 | Change | ||||||||||||||||||||
| (in thousands) | |||||||||||||||||||||||
| Corporate expenses | $ | 82,008 | $ | 134,784 | $ | (52,776) | |||||||||||||||||
Corporate expenses include certain executive, director, legal and consulting expenses, costs for research and development, and other miscellaneous costs, including those associated with operating as a publicly traded company, as well as costs incurred in connection with the acquisition of Validus. From time to time, we may revise the allocation of certain expenses between corporate and operational expenses to better reflect the characteristic of the underlying expense.
•Corporate expenses decreased by $52.8 million, primarily driven by:
–lower expenses associated with the Validus Acquisition, with $5.4 million in 2025, compared to $61.9 million in 2024; and
–the Bermuda tax credits which were enacted in the fourth quarter of 2025; partially offset by
–increased compensation expenses.
Interest Expense and Preference Share Dividends
| Year ended December 31, | 2025 | 2024 | Change | ||||||||||||||||||||
| (in thousands) | |||||||||||||||||||||||
| Interest Expense | |||||||||||||||||||||||
7.003% Senior Notes due 2035 (Fontana) (1) | $ | 1,167 | $ | — | $ | 1,167 | |||||||||||||||||
5.950% Senior Notes due 2035 (DaVinci) (2) | 14,726 | — | 14,726 | ||||||||||||||||||||
5.800% Senior Notes due 2035 | 24,489 | — | 24,489 | ||||||||||||||||||||
5.750% Senior Notes due 2033 | 43,125 | 43,125 | — | ||||||||||||||||||||
3.600% Senior Notes due 2029 | 14,400 | 14,400 | — | ||||||||||||||||||||
3.450% Senior Notes due 2027 | 10,350 | 10,350 | — | ||||||||||||||||||||
3.700% Senior Notes due 2025 (3) | 2,775 | 11,100 | (8,325) | ||||||||||||||||||||
4.750% Senior Notes due 2025 (DaVinci) (2) (4) | 2,375 | 7,125 | (4,750) | ||||||||||||||||||||
Medici Revolving Credit Facility (5) | 1,826 | 2,502 | (676) | ||||||||||||||||||||
| Other | 5,619 | 5,166 | 453 | ||||||||||||||||||||
| Total interest expense | 120,852 | 93,768 | 27,084 | ||||||||||||||||||||
| Preference Share Dividends | |||||||||||||||||||||||
5.750% Series F Preference Shares | 14,375 | 14,375 | — | ||||||||||||||||||||
4.20% Series G Preference Shares | 21,000 | 21,000 | — | ||||||||||||||||||||
| Total preference share dividends | 35,375 | 35,375 | — | ||||||||||||||||||||
| Total interest expense and preference share dividends | $ | 156,227 | $ | 129,143 | $ | 27,084 | |||||||||||||||||
(1)RenaissanceRe owns a noncontrolling economic interest in its joint venture Fontana. Because RenaissanceRe controls a majority of Fontana’s issued voting shares, the consolidated financial statements of Fontana are included in the consolidated financial statements of RenaissanceRe. RenaissanceRe has not provided any financial or other support to Fontana that it was not contractually required to provide. RenaissanceRe’s financial exposure to Fontana is limited to its investment in Fontana’s shares and counterparty credit risk arising from reinsurance transactions.
(2)RenaissanceRe owns a noncontrolling economic interest in its joint venture DaVinci. Because RenaissanceRe controls a majority of DaVinci’s issued voting shares, the consolidated financial statements of DaVinci are included in the consolidated financial statements of RenaissanceRe. However, RenaissanceRe does not guarantee or provide credit support for DaVinci and RenaissanceRe’s financial exposure to DaVinci is limited to its investment in DaVinci’s shares and counterparty credit risk arising from reinsurance transactions.
(3)The 3.700% Senior Notes due 2025 were repaid in full at maturity on April 1, 2025.
83
(4)The 4.750% Senior Notes due 2025 (DaVinci) were repaid in full at maturity on May 1, 2025.
(5)RenaissanceRe owns a noncontrolling economic interest in Medici. Because RenaissanceRe controls all of Medici’s issued voting shares, the financial statements of Medici are included in RenaissanceRe’s consolidated financial statements. On December 18, 2025, the Medici Revolving Credit Facility was terminated.
•Interest expense increased $27.1 million, primarily driven by:
–additional interest expense resulting from the issuance of the 5.800% Senior Notes due 2035 and the 5.950% Senior Notes due 2035 (DaVinci); partially offset by
–a decrease in interest expense resulting from the maturity of the 3.700% Senior Notes due 2025 and the 4.750% Senior Notes due 2025 (DaVinci) in 2025.
Income Tax Benefit (Expense)
| Year ended December 31, | 2025 | 2024 | Change | ||||||||||||||||||||
| (in thousands) | |||||||||||||||||||||||
| Income tax benefit (expense) | $ | (396,332) | $ | (32,628) | $ | (363,704) | |||||||||||||||||
•Income tax expense increased by $363.7 million, primarily driven by:
–strong profitability across our operating jurisdictions, including Bermuda, which became subject to the CIT in 2025.
We are subject to income taxes in the jurisdictions in which we operate. Through December 31, 2024, we were not subject to any income taxes or capital gains taxes in Bermuda. The CIT became effective on January 1, 2025. As a result, our profits generated on or after January 1, 2025 in Bermuda (except for profits earned by joint ventures and managed funds) are subject to a 15% corporate income tax. Furthermore, the profits generated in Bermuda on or after January 1, 2025 by our consolidated joint ventures and managed funds, except to the extent those profits are attributable to redeemable noncontrolling interests, are also generally taxed at 15% as a result of the enactment of Pillar II Rules by many of the jurisdictions in which we operate. Our consolidated effective tax rate has increased in 2025 as a result of these changes. Our effective tax rate, which is based upon the expected annual effective tax rate, may fluctuate from period to period based on the relative mix of income or loss reported by jurisdiction and the varying tax rates in each jurisdiction.
Net Income (Loss) Attributable to Redeemable Noncontrolling Interests
| Year ended December 31, | 2025 | 2024 | Change | ||||||||||||||||||||
| (in thousands) | |||||||||||||||||||||||
| Redeemable noncontrolling interest - DaVinci | $ | 596,851 | $ | 627,055 | $ | (30,204) | |||||||||||||||||
| Redeemable noncontrolling interest - Medici | 162,676 | 202,941 | (40,265) | ||||||||||||||||||||
| Redeemable noncontrolling interest - Vermeer | 122,574 | 244,560 | (121,986) | ||||||||||||||||||||
| Redeemable noncontrolling interest - Fontana | 53,308 | 15,616 | 37,692 | ||||||||||||||||||||
| Net income (loss) attributable to redeemable noncontrolling interests | $ | 935,409 | $ | 1,090,172 | $ | (154,763) | |||||||||||||||||
•Net income attributable to redeemable noncontrolling interests decreased by $154.8 million, primarily driven by:
–DaVinci and Vermeer, which had lower net income in 2025 compared to 2024, primarily as a result of losses associated with the 2025 Large Loss Events; partially offset by
–higher net investment income and net realized and unrealized gains on investments in DaVinci and Fontana in 2025, compared to net investment income and net realized and unrealized losses on investments in 2024; and
–a decrease in management and performance fee income recorded in noncontrolling interests as a result of the recapture of previously deferred management fees during 2024
84
that related to prior years, compared to no recapture related to prior years in 2025, and lower underwriting income in 2025 compared to 2024.
•Net income attributable to redeemable noncontrolling interests of $935.4 million included $519.5 million of net investment income, partially offset by $250.1 million in management and performance fee income.
Refer to “Note 10. Noncontrolling Interests” in our “Notes to Consolidated Financial Statements” for additional information regarding our redeemable noncontrolling interests.
FINANCIAL CONDITION, LIQUIDITY AND CAPITAL RESOURCES
Financial Condition
As a Bermuda-domiciled holding company, RenaissanceRe has limited operations of its own. Its assets consist primarily of investments in subsidiaries and cash and securities in amounts which fluctuate over time. We therefore rely on dividends and distributions (and other statutorily permissible payments) from our subsidiaries, investment income and fee income to meet our liquidity requirements, which primarily include making principal and interest payments on our debt and dividend payments to our preference and common shareholders.
The payment of dividends by our subsidiaries is, under certain circumstances, limited by the applicable laws and regulations in the various jurisdictions in which our subsidiaries operate. In addition, insurance laws require our insurance subsidiaries to maintain certain measures of solvency and liquidity. We believe that each of our insurance subsidiaries and branches exceeded the minimum solvency, capital and surplus requirements in their applicable jurisdictions at December 31, 2025. Certain of our subsidiaries and branches are required to file FCRs with their regulators, which provide details on solvency and financial performance. Where required, these FCRs will be posted on our website. The regulations governing our and our principal operating subsidiaries’ ability to pay dividends and to maintain certain measures of solvency and liquidity, and requirements to file FCRs are discussed in detail in “Part I, Item 1. Business—Regulation” and “Note 18. Statutory Requirements” in our “Notes to the Consolidated Financial Statements.”
Liquidity and Cash Flows
Holding Company Liquidity
RenaissanceRe’s principal uses of liquidity are: (1) common share related transactions including dividend payments to our common shareholders and common share repurchases, (2) preference share related transactions including dividend payments to our preference shareholders and preference share redemptions, (3) interest and principal payments on debt, (4) capital investments in our subsidiaries, (5) acquisition of, or investments in, new or existing companies or books of business of other companies, such as the Validus Acquisition, and (6) certain corporate and operational expenses.
We attempt to structure our organization in a way that facilitates efficient capital movements between RenaissanceRe and our operating subsidiaries and to ensure that adequate liquidity is available when required, giving consideration to applicable laws and regulations, and the domiciliary location of sources of liquidity and related obligations. For example, our internal investment structures and cash pooling arrangements among RenaissanceRe and certain of our subsidiaries help to efficiently facilitate capital and liquidity movements.
In the aggregate, our principal operating subsidiaries have historically produced sufficient cash flows to meet their expected claims payments and operational expenses and to provide dividend payments to us. In addition, our subsidiaries maintain a concentration of investments in high quality liquid securities, which management believes will provide additional liquidity for extraordinary claims payments should the need arise. In 2024 and 2025, we received significant distributions of capital from many of our principal operating subsidiaries, including Renaissance Reinsurance and RREAG, from earnings in the ordinary course and in connection with the integration of Validus and streamlining of our corporate structure.
However, in some circumstances, RenaissanceRe may determine it is necessary or advisable to contribute capital to our subsidiaries, or may be contractually required to contribute capital to our subsidiaries, joint ventures or managed funds. For example, in 2024, RenaissanceRe contributed capital to RenaissanceRe
85
Specialty U.S. to support growth in premiums. In addition, from time to time we invest in new managed joint ventures or managed funds, increase our investments in certain of our managed joint ventures or managed funds and contribute cash or assets to these entities, such as in connection with the launch of Medici UCITS in 2025. Examples of our contractual requirements to make capital contributions to our subsidiaries or joint ventures or managed funds include our net worth maintenance agreements with certain operating subsidiaries, and Renaissance Reinsurance’s obligation to make a mandatory capital contribution of up to $50.0 million in the event that a loss reduces Top Layer’s capital below a specified level.
Sources of Liquidity
Historically, cash receipts from operations, consisting primarily of premiums, investment income and fee income, have provided sufficient funds to pay the losses and operational expenses incurred by our subsidiaries and to fund dividends and distributions to RenaissanceRe. Other potential sources of liquidity include borrowings under our credit facilities and issuances of securities.
The premiums received by our operating subsidiaries are generally received months or even years before losses are paid under the policies related to such premiums. Premiums and acquisition expenses generally are received within the first two years of inception of a contract, while operational expenses are generally paid within a year of being incurred. It generally takes much longer for net claims and claim expenses incurred to be reported and ultimately settled, requiring the establishment of reserves for claims and claim expenses and reinsurance recoverable. Therefore, the amount of net claims paid in any one year is not necessarily related to the amount of net claims and claim expenses incurred in that year, as reported in the consolidated statements of operations.
We expect that our liquidity needs for the next 12 months will be met by our cash receipts from operations. However, as a result of a combination of market conditions, turnover of our investment portfolios and changes in investment yields, and the nature of our business where a large portion of the coverages we provide can produce losses of high severity and low frequency, future cash flows from operating activities cannot be accurately predicted and may fluctuate significantly between individual quarters and years. In addition, due to the magnitude and complexity of certain large loss events, meaningful uncertainty remains regarding losses from these events and our actual ultimate net losses from these events may vary materially from preliminary estimates, which would impact our cash flows from operations.
Our “shelf” registration statement on Form S-3 under the Securities Act allows for the public offering of various types of securities, including common shares, preference shares and debt securities, which provides a source of liquidity. Because we are a “well-known seasoned issuer” as defined by the rules promulgated under the Securities Act, we are also eligible to file additional automatically effective registration statements on Form S-3 in the future for the potential offering and sale of additional debt and equity securities. From time to time, we raise capital through public offerings pursuant to our registration statements. For example, in February 2025, we completed an offering of $500.0 million of 5.800% Senior Notes due April 2035 for net proceeds of $493.5 million.
Credit Facilities, Trusts and Other Collateral Arrangements
We also maintain various other arrangements that allow us to access liquidity and satisfy collateral requirements, including revolving credit facilities, letter of credit facilities, and regulatory trusts, as well as other types of trust and collateral arrangements. Regulatory and other requirements to post collateral to support our reinsurance obligations could impact our liquidity. For example, many jurisdictions in the U.S. do not permit insurance companies to take credit for reinsurance obtained from unlicensed or non-admitted insurers on their statutory financial statements unless security is posted, so our contracts generally require us to post a letter of credit or provide other security (such as through a multi-beneficiary reinsurance trust). However, certain of our subsidiaries qualify as certified reinsurers or reciprocal reinsurers in one or more U.S. states, which has, and may continue to, reduce the amount of collateral that we are required to post. In addition, if we were to fail to comply with certain covenants in our debt agreements, we may have to pledge additional collateral.
86
Letter of Credit and Revolving Credit Facilities
We and certain of our subsidiaries, joint ventures, and managed funds maintain secured and unsecured revolving credit facilities and letter of credit facilities that provide liquidity and allow us to satisfy certain collateral requirements. The outstanding amounts issued or drawn under each of our significant credit facilities are set forth below:
| At December 31, 2025 | Issued or Drawn | ||||||||||
| (in thousands) | |||||||||||
Revolving Credit Facility (1) | $ | — | |||||||||
Medici Revolving Credit Facility (2) | — | ||||||||||
Bilateral Letter of Credit Facilities | |||||||||||
Secured | 206,515 | ||||||||||
Unsecured | 322,271 | ||||||||||
| $ | 528,786 | ||||||||||
(1)At December 31, 2025, no amounts were issued or drawn under this facility.
(2)RenaissanceRe owns a noncontrolling economic interest in Medici. Because RenaissanceRe controls all of Medici’s issued voting shares, the financial statements of Medici are included in RenaissanceRe’s consolidated financial statements. On December 18, 2025, the Medici Revolving Credit Facility was terminated.
Refer to “Note 9. Debt and Credit Facilities” in our “Notes to the Consolidated Financial Statements” for additional information related to our debt and credit facilities.
Funds at Lloyd’s
As a member of Lloyd’s, the underwriting capacity, or stamp capacity, of Syndicate 1458 is required to be supported by providing a deposit, the FAL, in the form of cash, securities or letters of credit. At December 31, 2025, the FAL required to support the underwriting activities at Lloyd’s through Syndicate 1458 was £577.8 million (2024 - £714.8 million). Actual FAL posted for Syndicate 1458 at December 31, 2025 by RenaissanceRe CCL was $912.0 million (2024 - $952.3 million), supported by a deposit of cash and fixed maturity securities.
Multi-Beneficiary Reinsurance Trusts, Multi-Beneficiary Reduced Collateral Reinsurance Trusts
Renaissance Reinsurance, DaVinci Reinsurance and RREAG use multi-beneficiary reinsurance trusts and/or multi-beneficiary reduced collateral reinsurance trusts to collateralize reinsurance liabilities. As of December 31, 2025, all of these trusts were funded in accordance with the relevant regulatory thresholds. However, assets held in these trusts have in the past, and may in the future, exceed the amount required under U.S. state regulations.
Refer to “Note 18. Statutory Requirements” in our “Notes to the Consolidated Financial Statements” for additional information on our multi-beneficiary reinsurance trusts and multi-beneficiary reduced collateral reinsurance trusts.
Contractual Obligations
In assessing our liquidity requirements and cash needs, we also consider contractual obligations to which we are a party. In certain circumstances, our contractual obligations may be accelerated due to defaults under the agreements governing those obligations (including pursuant to cross-default provisions in such agreements) or in connection with certain changes in control of the Company, for example. In addition, in certain circumstances, in the event of a default these obligations may bear an increased interest rate or be subject to penalties.
87
The table below shows certain of our current and long-term contractual obligations:
At December 31, 2025 | Total | Less Than 1 Year | 1-3 Years | 3-5 Years | More Than 5 Years | ||||||||||||||||||||||||||||||
| (in thousands) | |||||||||||||||||||||||||||||||||||
Long term debt obligations (1) | |||||||||||||||||||||||||||||||||||
7.003% Senior Notes due 2035 (Fontana) (2) | $ | 168,863 | $ | 7,003 | $ | 14,006 | $ | 14,006 | $ | 133,848 | |||||||||||||||||||||||||
5.950% Senior Notes due 2035 (DaVinci) (3) | 465,856 | 17,850 | 35,700 | 35,700 | 376,606 | ||||||||||||||||||||||||||||||
5.800% Senior Notes due 2035 | 768,250 | 29,000 | 58,000 | 58,000 | 623,250 | ||||||||||||||||||||||||||||||
| 5.750% Senior Notes due 2033 | 1,070,443 | 43,125 | 86,250 | 86,250 | 854,818 | ||||||||||||||||||||||||||||||
| 3.600% Senior Notes due 2029 | 447,400 | 14,400 | 28,800 | 404,200 | — | ||||||||||||||||||||||||||||||
| 3.450% Senior Notes due 2027 | 315,525 | 10,350 | 305,175 | — | — | ||||||||||||||||||||||||||||||
| Total long term debt obligations | 3,236,337 | 121,728 | 527,931 | 598,156 | 1,988,522 | ||||||||||||||||||||||||||||||
Investment commitments (4) | 3,918,485 | 3,918,485 | — | — | — | ||||||||||||||||||||||||||||||
| Operating lease obligations | 168,822 | 17,619 | 36,991 | 34,693 | 79,519 | ||||||||||||||||||||||||||||||
| Capital lease obligations | 7,468 | 2,661 | 4,807 | — | — | ||||||||||||||||||||||||||||||
| Payable for investments purchased | 533,101 | 533,101 | — | — | — | ||||||||||||||||||||||||||||||
Reserve for claims and claim expenses (5) | 22,302,345 | 5,176,696 | 7,354,355 | 4,144,359 | 5,626,935 | ||||||||||||||||||||||||||||||
| Total contractual obligations | $ | 30,166,558 | $ | 9,770,290 | $ | 7,924,084 | $ | 4,777,208 | $ | 7,694,976 | |||||||||||||||||||||||||
(1)Includes contractual interest payments.
(2)RenaissanceRe owns a noncontrolling economic interest in its joint venture Fontana. Because RenaissanceRe controls a majority of Fontana’s issued voting shares, the consolidated financial statements of Fontana are included in the consolidated financial statements of RenaissanceRe. RenaissanceRe has not provided any financial or other support to Fontana that it was not contractually required to provide. RenaissanceRe’s financial exposure to Fontana is limited to its investment in Fontana’s shares and counterparty credit risk arising from reinsurance transactions.
(3)RenaissanceRe owns a noncontrolling economic interest in its joint venture DaVinci. Because RenaissanceRe controls a majority of DaVinci’s issued voting shares, the consolidated financial statements of DaVinci are included in the consolidated financial statements of RenaissanceRe. However, RenaissanceRe does not guarantee or provide credit support for DaVinci and RenaissanceRe’s financial exposure to DaVinci is limited to its investment in DaVinci’s shares and counterparty credit risk arising from reinsurance transactions.
(4)The investment commitments do not have a defined contractual commitment date and we have therefore included them in the less than one year category.
(5)The amount and timing of the cash flows associated with our policy liabilities are highly uncertain. Refer to “Note 8. Reserve for Claims and Claim Expenses” in our “Notes to the Consolidated Financial Statements” for more information on our estimate of claims and claim expense reserves.
Cash Flows
| Year ended December 31, | 2025 | 2024 | |||||||||||||||
| (in thousands) | |||||||||||||||||
| Net cash provided by (used in) operating activities | $ | 3,693,107 | $ | 4,164,822 | |||||||||||||
| Net cash provided by (used in) investing activities | (2,215,809) | (3,060,856) | |||||||||||||||
| Net cash provided by (used in) financing activities | (1,410,503) | (1,287,515) | |||||||||||||||
| Effect of exchange rate changes on foreign currency cash | (12,218) | (17,365) | |||||||||||||||
| Net increase (decrease) in cash and cash equivalents | 54,577 | (200,914) | |||||||||||||||
| Cash and cash equivalents, beginning of period | 1,676,604 | 1,877,518 | |||||||||||||||
| Cash and cash equivalents, end of period | $ | 1,731,181 | $ | 1,676,604 | |||||||||||||
2025
During 2025, our cash and cash equivalents increased by $54.6 million compared to December 31, 2024.
88
Cash flows provided by operating activities
Cash flows provided by operating activities during 2025 were $3.7 billion and were primarily the result of certain adjustments to reconcile our net income of $3.6 billion to net cash provided by operating activities, including:
•an increase in reserve for claims and claim expenses of $1.0 billion, principally due to:
–an increase in our Casualty and Specialty segment, largely driven by additional earned premiums, resulting in a corresponding increase in attritional loss reserves; and
–a decrease in our Property segment, primarily due to favorable development of prior accident years;
•a decrease in reinsurance recoverable of $581.5 million, primarily due to favorable development of prior accident years in the Property segment; partly offset by
•net realized and unrealized gains on investments of $1.2 billion, primarily driven by:
–$504.0 million of net realized and unrealized gains on fixed maturity-related investments resulting from decreases in market yields in 2025;
–$415.5 million of net gains on commodity-related investments, principally gold futures; and
–$188.3 million of net realized and unrealized gains on equity-related investments, primarily due to increased exposure to equity futures and favorable price movements through 2025.
Cash flows used in investing activities
During 2025, our cash flows used in investing activities were $2.2 billion, principally reflecting net purchases of equity investments of $1.6 billion, which were predominantly in fixed income exchange traded funds, net purchases of fixed maturity investments trading of $616.9 million and net purchases of other investments of $464.5 million, partially offset by net settlements of derivatives of $564.3 million. The net purchases of fixed income exchange traded funds, fixed maturity investments trading and other investments were primarily funded by cash flows provided by operating activities.
Cash flows used in financing activities
Our cash flows used in financing activities in 2025 were $1.4 billion, and were principally the result of:
•common share repurchases of $1.6 billion;
•net outflows of $116.2 million related to net third-party redeemable noncontrolling interest share and capital transactions in Medici, Fontana and DaVinci;
•raising capital of $889.1 million through the issuance of 5.950% Senior Notes due 2035 of DaVinci and 5.800% Senior Notes due 2035 of RenaissanceRe; and partially offset by
•repayment of debt of $450.0 million, consisting of $300.0 million of 3.700% Senior Notes due 2025, and $150.0 million of DaVinci Senior Notes.
2024
During 2024, our cash and cash equivalents decreased by $200.9 million, to $1.7 billion at December 31, 2024, compared to $1.9 billion at December 31, 2023.
Cash flows provided by operating activities
Cash flows provided by operating activities during 2024 were $4.2 billion, compared to $1.9 billion during 2023. Cash flows provided by operating activities during 2024 were primarily the result of certain adjustments to reconcile our net income of $3.0 billion to net cash provided by operating activities, including:
•a decrease in reinsurance recoverable of $862.9 million due to prior year favorable development across the 2017 through 2022 accident years, in addition to paid recoveries;
•an increase in reserve for claims and claim expenses of $816.6 million, primarily resulting from an increase in reserves in our Casualty and Specialty segment, largely driven by an increase in earned
89
premiums due to the renewal of business acquired in the Validus Acquisition and organic growth, resulting in additional attritional reserves, partially offset by a decrease in reserves in our Property segment primarily due to paid losses and prior year favorable development; partially offset by
•a decrease in reinsurance balances payable of $381.8 million, principally driven by the redemption of capital from Upsilon RFO and the timing of payments related to underwriting activity
Cash flows used in investing activities
During 2024, our cash flows used in investing activities were $3.1 billion, principally reflecting net purchases of fixed maturity investments trading of $2.8 billion and other investments of $358.2 million, partially offset by cash flows from net sales of short term investments of $174.5 million. The net purchases of fixed maturity investments trading and other investments was primarily funded by cash flows provided by operating activities, as described above.
Cash flows used in financing activities
Our cash flows used in financing activities in 2024 were $1.3 billion, and were principally the result of:
•net outflows of $405.8 million, primarily related to net third-party redeemable noncontrolling interest share transactions in DaVinci, Medici and Vermeer;
•common share repurchases of $666.9 million; and
•repayment of debt of $150.0 million related to the Medici Revolving Credit Facility.
Capital Resources
We monitor our capital adequacy on a regular basis and seek to adjust our capital according to the needs of our business. In particular, we require capital sufficient to meet or exceed the capital adequacy ratios established by rating agencies for maintenance of appropriate financial strength ratings, the capital adequacy tests performed by regulatory authorities and the capital requirements under our credit facilities. From time to time, rating agencies may make changes in their capital models and rating methodologies, which could increase the amount of capital required to support our ratings. We may seek to raise additional capital or return capital to our shareholders through common share repurchases and cash dividends (or a combination of such methods). In the normal course of our operations, we may from time to time evaluate additional share or debt issuances given prevailing market conditions and capital management strategies, including for our operating subsidiaries, joint ventures and managed funds. In addition, as noted above, we enter into agreements with financial institutions to obtain letter of credit facilities for the benefit of our operating subsidiaries and certain of our joint ventures and managed funds in their reinsurance and insurance business.
90
Our total shareholders’ equity attributable to RenaissanceRe and total debt was as follows:
| At December 31, | 2025 | 2024 | Change | ||||||||||||||||||||
| (in thousands) | |||||||||||||||||||||||
| Common shareholders’ equity | $ | 10,858,657 | $ | 9,824,012 | $ | 1,034,645 | |||||||||||||||||
| Preference shares | 750,000 | 750,000 | — | ||||||||||||||||||||
| Total shareholders’ equity attributable to RenaissanceRe | $ | 11,608,657 | $ | 10,574,012 | $ | 1,034,645 | |||||||||||||||||
7.003% Senior Notes due 2035 (Fontana) (1) | $ | 99,224 | $ | — | $ | 99,224 | |||||||||||||||||
5.950% Senior Notes due 2035 (DaVinci) (2) | 296,972 | — | 296,972 | ||||||||||||||||||||
| 5.800% Senior Notes due 2035 | 493,770 | — | 493,770 | ||||||||||||||||||||
| 5.750% Senior Notes due 2033 | 743,009 | 742,068 | 941 | ||||||||||||||||||||
| 3.600% Senior Notes due 2029 | 396,966 | 396,051 | 915 | ||||||||||||||||||||
| 3.450% Senior Notes due 2027 | 299,260 | 298,765 | 495 | ||||||||||||||||||||
3.700% Senior Notes due 2025 (3) | — | 299,908 | (299,908) | ||||||||||||||||||||
4.750% Senior Notes due 2025 (DaVinci) (2)(4) | — | 149,897 | (149,897) | ||||||||||||||||||||
| Total senior notes | 2,329,201 | 1,886,689 | 442,512 | ||||||||||||||||||||
Medici Revolving Credit Facility (5) | — | — | — | ||||||||||||||||||||
Total debt | $ | 2,329,201 | $ | 1,886,689 | $ | 442,512 | |||||||||||||||||
(1) RenaissanceRe owns a noncontrolling economic interest in its joint venture Fontana. Because RenaissanceRe controls a majority of Fontana’s issued voting shares, the consolidated financial statements of Fontana are included in the consolidated financial statements of RenaissanceRe. RenaissanceRe has not provided any financial or other support to Fontana that it was not contractually required to provide. RenaissanceRe’s financial exposure to Fontana is limited to its investment in Fontana’s shares and counterparty credit risk arising from reinsurance transactions.
(2) RenaissanceRe owns a noncontrolling economic interest in its joint venture DaVinci. Because RenaissanceRe controls a majority of DaVinci’s issued voting shares, the consolidated financial statements of DaVinci are included in the consolidated financial statements of RenaissanceRe. However, RenaissanceRe does not guarantee or provide credit support for DaVinci and RenaissanceRe’s financial exposure to DaVinci is limited to its investment in DaVinci’s shares and counterparty credit risk arising from reinsurance transactions.
(3) The 3.700% Senior Notes due 2025 were repaid in full at maturity on April 1, 2025.
(4) The 4.750% Senior Notes due 2025 (DaVinci) were repaid in full at maturity on May 1, 2025.
(5) RenaissanceRe owns a noncontrolling economic interest in Medici. Because RenaissanceRe controls all of Medici’s issued voting shares, the financial statements of Medici are included in RenaissanceRe’s consolidated financial statements. On December 18, 2025, the Medici Revolving Credit Facility was terminated.
Our total shareholders’ equity attributable to RenaissanceRe increased $1.0 billion during 2025 principally as a result of:
•our comprehensive income attributable to RenaissanceRe of $2.7 billion; partially offset by
•the repurchase of our common shares at an aggregate cost of $1.6 billion; and
•$74.8 million of dividends on our common shares and $35.4 million of dividends on our preference shares.
For additional information related to the terms of our debt and significant credit facilities, see “Note 9. Debt and Credit Facilities” in our “Notes to the Consolidated Financial Statements.” See “Note 12. Shareholders’ Equity” in our “Notes to the Consolidated Financial Statements” for additional information related to our common and preference shares.
Reserve for Claims and Claim Expenses
We believe the most significant accounting judgment made by management is our estimate of claims and claim expense reserves. Claims and claim expense reserves represent estimates, including actuarial and statistical projections at a given point in time, of the ultimate settlement and administration costs for unpaid claims and claim expenses arising from the insurance and reinsurance contracts we sell. Our actual net
91
claims and claim expenses paid will differ, perhaps materially, from the estimates reflected in our financial statements, which may adversely impact our financial condition, liquidity and capital resources.
Refer to “Note 8. Reserve for Claims and Claim Expenses” in our “Notes to the Consolidated Financial Statements” for more information on the risks we insure and reinsure, the reserving techniques, assumptions and processes we follow to estimate our claims and claim expense reserves, prior year development of the reserve for claims and claim expenses, analysis of our incurred and paid claims development and claims duration information for each of our Property and Casualty and Specialty segments. In addition, refer to “Part II, Item 7. Management’s Discussion and Analysis of Financial Condition and Results of Operations—Summary of Critical Accounting Estimates—Claims and Claim Expense Reserves” for more information on the reserving techniques, assumptions and processes we follow to estimate our claims and claim expense reserves, our actual results versus our initial estimates of our claims reserves, and sensitivity analysis for each of our Property and Casualty and Specialty segments.
Investments
The table below shows our invested assets:
| At December 31, | 2025 | 2024 | Change | ||||||||||||||||||||||||||||||||
| (in thousands, except percentages) | |||||||||||||||||||||||||||||||||||
| U.S. treasuries | $ | 10,641,503 | 29.7 | % | $ | 11,001,893 | 33.7 | % | $ | (360,390) | |||||||||||||||||||||||||
Corporate | 8,528,828 | 23.6 | % | 7,862,423 | 24.1 | % | 666,405 | ||||||||||||||||||||||||||||
| Residential mortgage-backed | 2,606,882 | 7.2 | % | 1,707,056 | 5.2 | % | 899,826 | ||||||||||||||||||||||||||||
| Asset-backed | 1,606,790 | 4.5 | % | 1,422,393 | 4.4 | % | 184,397 | ||||||||||||||||||||||||||||
| Non-U.S. government | 691,912 | 1.9 | % | 618,809 | 1.9 | % | 73,103 | ||||||||||||||||||||||||||||
| Agencies | 486,817 | 1.3 | % | 623,489 | 1.9 | % | (136,672) | ||||||||||||||||||||||||||||
| Commercial mortgage-backed | 321,591 | 0.9 | % | 326,451 | 1.0 | % | (4,860) | ||||||||||||||||||||||||||||
Total fixed maturity investments trading, at fair value | 24,884,323 | 69.1 | % | 23,562,514 | 72.2 | % | 1,321,809 | ||||||||||||||||||||||||||||
| Short term investments, at fair value | 4,759,811 | 13.2 | % | 4,531,655 | 13.9 | % | 228,156 | ||||||||||||||||||||||||||||
Fixed income exchange traded funds | 1,582,811 | 4.4 | % | — | — | % | 1,582,811 | ||||||||||||||||||||||||||||
Common stock (1) | 150,179 | 0.4 | % | 117,756 | 0.4 | % | 32,423 | ||||||||||||||||||||||||||||
Total equity investments, at fair value | 1,732,990 | 4.8 | % | 117,756 | 0.4 | % | 1,615,234 | ||||||||||||||||||||||||||||
| Fund investments | 2,775,499 | 7.6 | % | 2,128,499 | 6.5 | % | 647,000 | ||||||||||||||||||||||||||||
| Catastrophe bonds | 1,613,710 | 4.5 | % | 1,984,396 | 6.1 | % | (370,686) | ||||||||||||||||||||||||||||
| Direct private equity investments | 185,005 | 0.5 | % | 211,866 | 0.6 | % | (26,861) | ||||||||||||||||||||||||||||
| Total other investments, at fair value | 4,574,214 | 12.6 | % | 4,324,761 | 13.2 | % | 249,453 | ||||||||||||||||||||||||||||
| Investments in other ventures, under equity method | 121,871 | 0.3 | % | 102,770 | 0.3 | % | 19,101 | ||||||||||||||||||||||||||||
| Total investments | $ | 36,073,209 | 100.0 | % | $ | 32,639,456 | 100.0 | % | $ | 3,433,753 | |||||||||||||||||||||||||
(1)In 2025, we revised the description of our “other equity investments” to “common stock.”
We structure our investment portfolio to emphasize the preservation of capital and the availability of liquidity to meet our claims obligations, to be well diversified across market sectors, and to generate relatively attractive returns on a risk-adjusted basis over time. Notwithstanding the foregoing, our investments are subject to market-wide risks and fluctuations, as well as to risks inherent in particular securities. Refer to “Note 5. Investments” and “Note 6. Fair Value Measurements” in our “Notes to the Consolidated Financial Statements” for additional information regarding our investments and the related fair value measurement.
As the reinsurance coverages we sell include substantial protection for damages resulting from natural and man-made catastrophes, as well as for potentially large casualty and specialty exposures, we expect, from time to time, to become liable for substantial claim payments on short notice. Accordingly, our investment portfolio as a whole is structured to seek to preserve capital and provide a high level of liquidity, which means that the large majority of our investments are highly rated fixed income securities, including U.S. treasuries, agencies, highly rated sovereign and supranational securities, high-grade corporate securities
92
and mortgage-backed and asset-backed securities. We also have an allocation to publicly traded equities reflected on our consolidated balance sheet as equity investments and an allocation to other investments (including catastrophe bonds, fund investments and direct private equity investments).
Weighted Average Effective Yield and Credit Rating
The following table summarizes the composition of our investment portfolio, including the fair value and credit ratings.
| (in thousands, except percentages) | Credit Rating (1) | ||||||||||||||||||||||||||||||||||||||||||||||||||||
| December 31, 2025 | Fair Value | AAA | AA | A | BBB | Non- Investment Grade | Not Rated | Investments Not Subject to Credit Ratings | |||||||||||||||||||||||||||||||||||||||||||||
| Fixed maturity investments trading, at fair value | |||||||||||||||||||||||||||||||||||||||||||||||||||||
| U.S. treasuries | $ | 10,641,503 | $ | — | $ | 10,641,503 | $ | — | $ | — | $ | — | $ | — | $ | — | |||||||||||||||||||||||||||||||||||||
| Corporate | 8,528,828 | 167,093 | 274,849 | 3,387,274 | 3,589,630 | 1,088,759 | 21,223 | — | |||||||||||||||||||||||||||||||||||||||||||||
| Residential mortgage-backed | 2,606,882 | 142,869 | 2,334,421 | 1,680 | 3,445 | 64,256 | 60,211 | — | |||||||||||||||||||||||||||||||||||||||||||||
| Asset-backed | 1,606,790 | 1,206,744 | 198,911 | 127,934 | 63,251 | — | 9,950 | — | |||||||||||||||||||||||||||||||||||||||||||||
| Non-U.S. government | 691,912 | 411,169 | 202,832 | 75,187 | 2,724 | — | — | — | |||||||||||||||||||||||||||||||||||||||||||||
| Agencies | 486,817 | — | 486,380 | — | — | 437 | — | — | |||||||||||||||||||||||||||||||||||||||||||||
| Commercial mortgage-backed | 321,591 | 265,933 | 54,348 | 1,235 | — | — | 75 | — | |||||||||||||||||||||||||||||||||||||||||||||
| Total fixed maturity investments trading, at fair value | 24,884,323 | 2,193,808 | 14,193,244 | 3,593,310 | 3,659,050 | 1,153,452 | 91,459 | — | |||||||||||||||||||||||||||||||||||||||||||||
| Short term investments, at fair value | 4,759,811 | 3,473,376 | 1,265,466 | 7,433 | 13,058 | 468 | 10 | — | |||||||||||||||||||||||||||||||||||||||||||||
| Equity investments, at fair value | |||||||||||||||||||||||||||||||||||||||||||||||||||||
Fixed income exchange traded funds (2) | 1,582,811 | — | 366,828 | 230,276 | — | 985,707 | — | — | |||||||||||||||||||||||||||||||||||||||||||||
Common stock (3) | 150,179 | — | — | — | — | — | — | 150,179 | |||||||||||||||||||||||||||||||||||||||||||||
| Total equity investments, at fair value | 1,732,990 | — | 366,828 | 230,276 | — | 985,707 | — | 150,179 | |||||||||||||||||||||||||||||||||||||||||||||
| Other investments, at fair value | |||||||||||||||||||||||||||||||||||||||||||||||||||||
| Catastrophe bonds | 1,613,710 | — | — | — | — | 1,613,710 | — | — | |||||||||||||||||||||||||||||||||||||||||||||
| Fund investments: | |||||||||||||||||||||||||||||||||||||||||||||||||||||
| Private credit funds | 1,445,158 | — | — | — | — | — | — | 1,445,158 | |||||||||||||||||||||||||||||||||||||||||||||
| Private equity funds | 701,837 | — | — | — | — | — | — | 701,837 | |||||||||||||||||||||||||||||||||||||||||||||
| Hedge funds | 473,990 | — | — | — | — | — | — | 473,990 | |||||||||||||||||||||||||||||||||||||||||||||
| Insurance-linked securities funds | 154,514 | — | — | — | — | — | — | 154,514 | |||||||||||||||||||||||||||||||||||||||||||||
| Direct private equity investments | 185,005 | — | — | — | — | — | — | 185,005 | |||||||||||||||||||||||||||||||||||||||||||||
| Total other investments, at fair value | 4,574,214 | — | — | — | — | 1,613,710 | — | 2,960,504 | |||||||||||||||||||||||||||||||||||||||||||||
| Investments in other ventures, under equity method | 121,871 | — | — | — | — | — | — | 121,871 | |||||||||||||||||||||||||||||||||||||||||||||
| Total investments | $ | 36,073,209 | $ | 5,667,184 | $ | 15,825,538 | $ | 3,831,019 | $ | 3,672,108 | $ | 3,753,337 | $ | 91,469 | $ | 3,232,554 | |||||||||||||||||||||||||||||||||||||
| 100.0 | % | 15.6 | % | 43.9 | % | 10.6 | % | 10.2 | % | 10.4 | % | 0.3 | % | 9.0 | % | ||||||||||||||||||||||||||||||||||||||
(1)The credit ratings included in this table are those assigned by Standard & Poor’s Corporation (“S&P”). When ratings provided by S&P were not available, ratings from other recognized rating agencies were used. We have grouped short term investments with an A-1+ and A-1 short term issue credit rating as AAA, short term investments with an A-2 short term issue credit rating as AA and short term investments with an A-3 short term issue credit rating as A.
(2)The fixed income exchange traded funds credit ratings included in this table are based on the weighted average credit rating of the underlying investments held by the exchange traded fund.
(3)In 2025, we revised the description of our “other equity investments” to “common stock.”
Fixed Maturity Investments and Short Term Investments
At December 31, 2025, our fixed maturity investments and short term investment portfolio had a weighted average credit quality rating of AA (2024 - AA) and a weighted average effective yield of 4.2% (2024 - 4.9%). At December 31, 2025, our non-investment grade and not-rated fixed maturity investments totaled $1.2 billion or 5.0% of our fixed maturity investments (2024 - $1.5 billion or 6.4%, respectively). In addition, within our other investments category we have funds that invest in non-investment grade and not-rated fixed income securities and non-investment grade cat-linked securities. At December 31, 2025, the funds
93
that invest in non-investment grade and not-rated fixed income securities and non-investment grade cat-linked securities totaled $3.2 billion (2024 - $3.2 billion).
At December 31, 2025, we had $4.8 billion of short term investments (2024 - $4.5 billion). Short term investments are managed as part of our investment portfolio and have a maturity of one year or less when purchased. Short term investments are carried at fair value.
The duration of our fixed maturity investments and short term investments at December 31, 2025 was 2.8 years (2024 - 3.1 years). From time to time, we may reevaluate the duration of our portfolio in light of the duration of our liabilities and market conditions.
The value of our fixed maturity investments will fluctuate with changes in the interest rate environment and when changes occur in economic conditions or the investment markets. Additionally, our differing asset classes expose us to other risks which could cause a reduction in the value of our investments.
Equity Investments
The following table summarizes the fair value of equity investments:
| At December 31, | 2025 | 2024 | Change | ||||||||||||||||||||
| (in thousands) | |||||||||||||||||||||||
| Fixed income exchange traded funds | $ | 1,582,811 | $ | — | $ | 1,582,811 | |||||||||||||||||
Common stock (1) | |||||||||||||||||||||||
| Financials | 147,996 | 116,400 | 31,596 | ||||||||||||||||||||
Other | 2,183 | 1,356 | 827 | ||||||||||||||||||||
Total common stock | 150,179 | 117,756 | 32,423 | ||||||||||||||||||||
| Total equity investments | $ | 1,732,990 | $ | 117,756 | $ | 1,615,234 | |||||||||||||||||
(1)In 2025, we revised our presentation of equity investments to present all individual equity holdings as common stock. Comparative information for the prior periods presented have been updated to conform to the current presentation.
Our equity investments includes fixed income exchange traded funds and common stocks. Our fixed income exchange traded funds each invest into a combination of treasuries, corporate bonds or asset-backed and mortgage-backed fixed maturity investments. The value of our fixed income exchange traded funds will fluctuate with changes in the interest rate environment, credit risk and when changes occur in economic conditions or the investment markets.
Common stocks are managed pursuant to diversified public equity securities mandates with third-party investment managers and also includes more concentrated public equity positions that we invest in through our strategic investment portfolio. These investments are subject to a variety of risks including: company performance, the availability of strategic investment opportunities, and macro-economic, industry, and systemic risks of the equity markets overall. Consequently, the carrying value of our investment portfolio will vary over time as the value or size of our portfolio of strategic investments in marketable equity securities fluctuates. It is possible we will increase our equity allocation in the future, and it could, from time to time, have a material effect on our financial results.
94
Other Investments
The table below shows our portfolio of other investments:
| At December 31, | 2025 | 2024 | Change | ||||||||||||||||||||
| (in thousands) | |||||||||||||||||||||||
| Fund investments | |||||||||||||||||||||||
Private credit funds | $ | 1,445,158 | $ | 1,181,146 | $ | 264,012 | |||||||||||||||||
Private equity funds | 701,837 | 609,105 | 92,732 | ||||||||||||||||||||
Hedge funds | 473,990 | 338,248 | 135,742 | ||||||||||||||||||||
Insurance-linked securities funds | 154,514 | — | 154,514 | ||||||||||||||||||||
Total fund investments | 2,775,499 | 2,128,499 | 647,000 | ||||||||||||||||||||
| Catastrophe bonds | 1,613,710 | 1,984,396 | (370,686) | ||||||||||||||||||||
| Direct private equity investments | 185,005 | 211,866 | (26,861) | ||||||||||||||||||||
Total other investments | $ | 4,574,214 | $ | 4,324,761 | $ | 249,453 | |||||||||||||||||
Refer to “Note 5. Investments” in our “Notes to the Consolidated Financial Statements” for additional information regarding our portfolio of other investments.
Investments in Other Ventures, under Equity Method
The table below shows our investments in other ventures, under equity method:
| At December 31, | 2025 | 2024 | |||||||||||||||||||||||||||||||||||||||
| (in thousands, except percentages) | Capital Invested | Ownership % | Carrying Value | Capital Invested | Ownership % | Carrying Value | |||||||||||||||||||||||||||||||||||
Investments in other ventures, under equity method | $ | 206,142 | 0.1% - 50.0% | $ | 121,871 | $ | 205,373 | 0.1% - 50.0% | $ | 102,770 | |||||||||||||||||||||||||||||||
The realized value we ultimately attain for our investments in other ventures, under equity method will likely differ from the carrying value, perhaps materially.
Ratings
Financial strength ratings are important to the competitive position of reinsurance and insurance companies. We have received high financial strength ratings from A.M. Best, S&P, Moody’s and Fitch. These ratings represent independent opinions of an insurer’s financial strength, operating performance and ability to meet policyholder obligations, and are not an evaluation directed toward the protection of investors or a recommendation to buy, sell or hold any of our securities. Certain of our entities and the senior notes and preference shares issued by them also have credit ratings. Rating organizations continually review the financial positions of our principal operating subsidiaries and joint ventures and ratings may be revised or revoked by the agencies which issue them. Additionally, rating organizations may change their capital models and rating methodologies, which could have a material impact on our ratings and business.
In addition, A.M. Best assesses and scores companies’ ERM practices, which is an opinion on the many critical dimensions of risk that determine overall creditworthiness. RenaissanceRe has been assigned an ERM score of “Very Strong,” which is the highest ERM score assigned.
95
The financial strength ratings of our principal operating subsidiaries and joint ventures and the ERM score of RenaissanceRe as of February 6, 2026 are presented below.
A.M. Best (1) | S&P (2) | Moody’s (3) | Fitch (4) | ||||||||||||||||||||||||||
| Renaissance Reinsurance Ltd. | A+ | A+ | A1 | A+ | |||||||||||||||||||||||||
| DaVinci Reinsurance Ltd. | A | A+ | A2 | — | |||||||||||||||||||||||||
Fontana Holdings L.P. | A | — | — | — | |||||||||||||||||||||||||
Renaissance Reinsurance of Europe DAC | A+ | A+ | — | — | |||||||||||||||||||||||||
| Renaissance Reinsurance U.S. Inc. | A+ | A+ | — | — | |||||||||||||||||||||||||
| RenaissanceRe Europe AG | A+ | A+ | — | — | |||||||||||||||||||||||||
| RenaissanceRe Specialty U.S. Ltd. | A+ | A+ | — | — | |||||||||||||||||||||||||
| Top Layer Reinsurance Ltd. | A+ | AA | — | — | |||||||||||||||||||||||||
| Vermeer Reinsurance Ltd. | A | — | — | — | |||||||||||||||||||||||||
| RenaissanceRe Syndicate 1458 | — | — | — | — | |||||||||||||||||||||||||
| Lloyd’s Overall Market Rating | A+ | AA- | — | AA- | |||||||||||||||||||||||||
| RenaissanceRe ERM Score | Very Strong | — | — | — | |||||||||||||||||||||||||
(1) The A.M. Best ratings for our principal operating subsidiaries and joint ventures represent the insurer’s financial strength rating. The Lloyd’s Overall Market Rating represents RenaissanceRe Syndicate 1458’s financial strength rating. RenaissanceRe has been assigned a “Very Strong” ERM score by A.M. Best.
(2) The S&P ratings for our principal operating subsidiaries and joint ventures represent the insurer’s financial strength rating. The Lloyd’s Overall Market Rating represents RenaissanceRe Syndicate 1458’s financial strength rating.
(3) The Moody’s ratings represent the insurer’s financial strength rating.
(4) The Fitch rating for Renaissance Reinsurance represents the insurer’s financial strength rating. The Lloyd’s Overall Market Rating represents RenaissanceRe Syndicate 1458’s financial strength rating.
A.M. Best
On October 2, 2025, A.M. Best revised the outlooks to positive from stable for the long-term issuer credit ratings of RenaissanceRe’s principal operating subsidiaries and joint ventures rated by A.M. Best. The outlook for all of our A.M. Best financial strength ratings is stable. “A+” is the second highest designation of A.M. Best’s rating levels. “A+” rated insurance companies are defined as “Superior” companies and are considered by A.M. Best to have a very strong ability to meet their obligations to policyholders. “A” is the third highest designation assigned by A.M. Best, representing A.M. Best’s opinion that the insurer has an “Excellent” ability to meet its ongoing obligations to policyholders.
S&P
The outlook for all of our S&P ratings is positive. The “A” range (“A+,” “A,” “A-”), which is the third highest rating assigned by S&P, indicates that S&P believes the insurers have strong capacity to meet their respective financial commitments but they are somewhat more susceptible to adverse effects or changes in circumstances and economic conditions than insurers rated higher.
Moody’s
The outlook for all of our Moody’s ratings is stable. Moody’s Insurance Financial Strength Ratings represent its opinions of the ability of insurance companies to pay punctually policyholder claims and obligations and senior unsecured debt instruments. Moody’s believes that insurance companies rated “A1” and “A2” offer good financial security.
Fitch
The outlook for all of our Fitch ratings is stable. Fitch believes that insurance companies rated “A+” have “Strong” capacity to meet policyholders and contract obligations on a timely basis with a low expectation of
96
ceased or interrupted payments. Insurers rated “AA-” by Fitch are believed to have a very low expectation of ceased or interrupted payments and very strong capital to meet policyholder obligations.
Lloyd’s Overall Market Rating
A.M. Best, S&P and Fitch have each assigned a financial strength rating to the Lloyd’s overall market. The financial risks to policyholders of syndicates within the Lloyd’s market are partially mutualized through the Lloyd’s Central Fund, to which all underwriting members contribute. Because of the presence of the Lloyd’s Central Fund, and the current legal and regulatory structure of the Lloyd’s market, financial strength ratings on individual syndicates would not be particularly meaningful and in any event would not be lower than the financial strength rating of the Lloyd’s overall market.
SUPPLEMENTAL GUARANTOR FINANCIAL INFORMATION
RenaissanceRe Finance, a 100% owned subsidiary of RenaissanceRe, issued certain 3.700% Senior Notes due 2025 and 3.450% Senior Notes due 2027. On April 1, 2025, RenaissanceRe Finance repaid in full at maturity the aggregate principal amount of $300.0 million, plus applicable accrued interest, of its 3.700% Senior Notes due 2025. Each series of notes is or was fully and unconditionally guaranteed by RenaissanceRe. The guarantees are or were senior unsecured obligations of RenaissanceRe ranking equally in right of payment with all other existing and future unsecured and unsubordinated indebtedness of RenaissanceRe, which may be outstanding from time to time. Each series of notes has or had various covenants, including limitations on mergers and consolidations, and restrictions as to the disposition of, and the placing of liens on, stock of designated subsidiaries. For additional information related to the terms of our debt securities, see “Note 9. Debt and Credit Facilities” in our “Notes to the Consolidated Financial Statements.”
97
The following tables present supplemental summarized financial information for RenaissanceRe and RenaissanceRe Finance, collectively the “Obligor Group.” Intercompany transactions among the members of the Obligor Group have been eliminated. The financial information of non-obligor subsidiaries has been excluded from the summarized financial information. In addition, assets as detailed in the table below exclude investments in subsidiaries for the Obligor Group. Significant intercompany transactions and receivable/payable balances between the Obligor Group and non-obligor subsidiaries are presented separately in the summarized financial information:
Summarized Balance Sheets
| At December 31, | 2025 | ||||||||||
| (in thousands) | |||||||||||
| Assets | |||||||||||
| Receivables due from non-obligor subsidiaries | $ | 1,895,861 | |||||||||
| Other current assets | 353,962 | ||||||||||
| Total current assets | $ | 2,249,823 | |||||||||
Goodwill and other intangible assets | $ | 97,332 | |||||||||
| Loan receivable from non-obligor subsidiaries | 743,433 | ||||||||||
| Other noncurrent assets | 29,223 | ||||||||||
| Total noncurrent assets | $ | 869,988 | |||||||||
| Liabilities | |||||||||||
| Payables due to non-obligor subsidiaries | $ | 24,829 | |||||||||
| Other current liabilities | 84,194 | ||||||||||
| Total current liabilities | $ | 109,023 | |||||||||
| Loan payable to non-obligor subsidiaries | $ | 625,380 | |||||||||
| Other noncurrent liabilities | 2,035,158 | ||||||||||
| Total noncurrent liabilities | $ | 2,660,538 | |||||||||
Summarized Statement of Operations
| Year ended December 31, | 2025 | ||||||||||
| (in thousands) | |||||||||||
| Revenues | |||||||||||
| Intercompany revenue with non-obligor subsidiaries | $ | 205,778 | |||||||||
| Other revenue | 57,053 | ||||||||||
| Total revenues | 262,831 | ||||||||||
| Expenses | |||||||||||
| Intercompany expense with non-obligor subsidiaries | 103,468 | ||||||||||
| Other expense | 141,452 | ||||||||||
| Total expenses | 244,920 | ||||||||||
| Income tax benefit (expense) | 10,201 | ||||||||||
| Net income (loss) | 28,112 | ||||||||||
| Dividends on RenaissanceRe preference shares | (35,375) | ||||||||||
| Net income (loss) attributable to Obligor Group | $ | (7,263) | |||||||||
98
CURRENT OUTLOOK
Over the past few years, we have grown RenaissanceRe into a company that is significantly more diversified – geographically, by line of business, and by source of income and capital. We have diversified our sources of capital through various owned and managed balance sheets as well as equity, debt and insurance-linked securities markets. We are unique among our peers in that we have both owned and managed, and rated and fronted, vehicles across the risks that we write. Our three drivers of profit put us in a differentiated position to absorb losses while still providing efficient capacity to our customers and producing strong returns for our shareholders.
We believe that we are in a strong capital position, which provides us with the flexibility and opportunity to deploy capital into the business while actively repurchasing shares when at attractive valuations. When possible, our preference is to deploy any excess capital into profitable business opportunities before returning excess capital to shareholders. Over the past several quarters, we have returned significant capital through share repurchases at what we believe to be attractive valuations.
In 2025, our focus was on building on the successful integration of Validus in 2024 with an emphasis on maintaining our underwriting portfolio and optimizing our operations. We achieved our goals by focusing on enhancing our access to risk, maintaining our best in class underwriting capabilities, focusing on preserving underwriting margin, and continuing to grow our investment income and fee income generating business. Looking ahead to 2026, we intend to take a similar disciplined approach while also continuing to execute our gross-to-net strategy. In addition, we are continuing to enhance our technology infrastructure and underwriting systems to enable us to better take advantage of future opportunities, including potential applications of artificial intelligence, as they arise.
Reinsurance Market Trends and Developments
We believe we have created significant opportunities to source attractive risk in the lines of business that we write, and that such opportunities will result in superior returns for our shareholders. We are in a period of heightened macroeconomic volatility, and we believe that it is in times of uncertainty when RenaissanceRe’s expertise, partnership-approach and coordination across teams differentiates us as a reinsurance leader.
We are uniquely positioned to write a variety of risks, leveraging our enhanced risk and capital management technology and underwriting expertise to cover multiple lines of business. In particular, we have invested heavily to understand the influence of climate change on the weather and its impact on the risks that we take. We believe that our RenaissanceRe Risk Sciences team gives us an advantage in properly reflecting the evolving phenomenon of climate change in our models compared to commercially available models.
Since the step change in reinsurance pricing in 2023, we believe that the market has appropriately balanced risk between insurers and reinsurers. That said, in the current market, not all risks are equally attractive, and returns can vary significantly between classes of business and deals within each class. This provides attractive opportunities for underwriters with strong access to risk. Our success in 2025 was predicated on the application of our deep underwriting expertise to differentiate the best deals, and our strong customer value proposition to maintain our position as a consistent incumbent.
At the January 1, 2026 renewals, we had two goals: (i) to deliver our market-leading value proposition to clients and brokers; and (ii) to construct the optimal underwriting portfolio to support our three drivers of profit and generate strong returns over the course of the cycle. We believe that we achieved both of these goals. Recent favorable reinsurance market results have increased competition and supply of reinsurance capacity, which has put some pressure on rates and margins. However, we remain confident in rate adequacy across our underwriting portfolio and in our belief that, relative to dynamics over the past 15 years, the market remains favorable.
General Economic Conditions
We think that the stresses in the global economy will continue, and could grow, and that this may result in increased market volatility. Global events and geopolitical instability have contributed to increased economic inflation over the past few years compared to recent historical norms. We consider the anticipated effects of inflation, including social, economic, and event-driven effects, in our loss models, on our investment portfolio, and generally in the running of our business, and actively monitor trends in these areas. To the extent that tariffs or inflation exacerbate demand surge, we believe we have the tools to appropriately price
99
for that scenario. Central bank policy and changes to interest rates may also increase the risk of inflationary pressure. The effects of interest rate trends on our reinsurance and insurance business could be magnified for longer-tail business lines that are more inflation-sensitive, particularly in our Casualty and Specialty segment.
As a reinsurer, we are paid to assume volatility, and are intentionally designed to withstand it. The largest risks that we protect against, such as hurricanes, wildfires and earthquakes, do not correlate to financial cycles and need to be protected against in good or bad economic times. Due to these factors, we believe that our Company is generally “anti-correlated” to the current macroeconomic environment. Notwithstanding the many uncertainties and challenges that lie ahead, we believe that our track record of responding to industry events, differentiated risk management and client service capabilities, coupled with access to diverse sources of both capital and risk continue to position us favorably in the current environment.
Tax Updates
The Bermuda CIT became effective on January 1, 2025. Therefore, our profits generated on or after January 1, 2025 in Bermuda (except for profits generated by our joint ventures and managed funds) are subject to a 15% corporate income tax. Furthermore, the profits generated in Bermuda on or after January 1, 2025 by our consolidated joint ventures and managed funds, except to the extent those profits are attributable to redeemable noncontrolling interests, are generally taxed at 15% as a result of the enactment of Pillar II Rules by many of the jurisdictions in which we operate. The Bermuda government also introduced substance-based tax credits designed to encourage investment in Bermuda. Due to our significant presence in Bermuda, these tax credits benefited us in 2025, and we expect that they will continue to benefit us in future periods. Overall, these changes have impacted our results, and are expected to impact our results in the future. We believe that the flexible global operating model that we have utilized will continue to prove resilient.
Three Drivers of Profit
We had strong overall performance in 2025, and all three drivers of profit performed well and contributed meaningfully to our results. We believe that having three distinct sources of income allows us to maintain profitability throughout a wide range of market outcomes and makes us more resilient to catastrophe activity. The benefit of this approach is evident in our results this year, as we were able to absorb one of the largest catastrophe losses in history with the California Wildfires in the first quarter and still generate stable earnings for the year.
Ultimately, strong underwriting underpins our three drivers of profit, because each driver is ultimately fueled by our underwriting portfolio. Typically, our Property segment contributes primarily to underwriting and fee income, and our Casualty and Specialty segment to investment and fee income. This construction is by design, and we believe that it is the optimal way to generate returns in the current market. Underwriting is the core of our business and provides significant upside to the earnings base from fees and investments.
Underwriting Income
Through disciplined underwriting, we aim to manage the cycle and allocate our capital to the business that will generate the best returns. Portfolio construction is a continuous process, and we believe that we have constructed a large and profitable underwriting portfolio that has been bolstered by our ability to participate broadly across our clients’ portfolios. We aim to be a provider of first choice and a trusted partner to our customers to help them manage their risk across portfolios and market cycles.
Each of our reportable segments has a different risk and volatility profile, which we believe contributes in distinct and important ways to our three drivers of profit, and in particular our underwriting income. The Property segment is inherently more volatile, but also provides meaningful underwriting income in lower catastrophe quarters as well as strong fee income from third-party capital. The Casualty and Specialty segment generally provides a more stable underwriting result over-time, along with significant investment income stemming from capital invested on longer tail risk in certain lines of business. These segments also provide us with diversification across our loss reserves and the tail of our risks, which allows us to better manage changes in loss trends, whether favorable or adverse, across our underwriting portfolio.
We believe that our larger size and greater diversification has allowed us to deliver strong financial results even as the underwriting market is facing headwinds, including the impact of large loss events, lower interest rates and softening rates in some classes. We have created a large, well-diversified combined
100
portfolio with deep partnerships with brokers and clients. We continue to remain focused on capturing attractive opportunities as they arise, while exercising discipline to effectively shape our portfolio to maintain desired lines. Generally, we grew our property catastrophe exposure, held profitable positions in other property, specialty and credit, and reduced our exposure to casualty lines most exposed to social inflation.
In 2026, we intend to continue to prioritize margin over growth. We prefer top-line growth when it makes sense, but reinsurance is a risk business where it is more important to know when and where to grow the business to be able to deliver results for our shareholders over the long term.
Property
With the global impact of climate-related risks, including climate change, we expect the frequency and severity of perils such as drought, flood, rain, hail and wildfire to continue at the elevated levels we have seen in recent years. We believe that the increase in severe weather, coupled with currently projected demographic trends in catastrophe-exposed regions, contributes to factors that will increase the average economic value of expected losses, increase the number of people exposed per year to natural disasters and, in general, exacerbate disaster risk. The impact from these factors was apparent in the California Wildfires. However, we think that the underwriting changes that we have made, including requiring higher rates and attachment points, has optimized the portfolio and positioned us so that this catastrophe activity will have a smaller impact on our financial results than it otherwise may have.
Throughout 2025, we grew into an attractive property catastrophe market where we believe that we deployed leading capacity at rates and terms that outperformed the broader market. Our strong capital position provided us with the flexibility to move quickly to offer capacity to our partners at attractive rates. At the same time, we supported our customers in one of the largest industry losses in history, the California Wildfires.
At the January 1, 2026 renewals, our aim was to maintain our existing portfolio and selectively deploy capacity in property catastrophe, and to optimize other property to reduce peak exposure and maintain attractive margin. Following several years of favorable reinsurance market results, reinsurance supply has increased, which put downward pressure on rates. Terms and conditions remained largely stable and attractive. In property catastrophe, we successfully retained and wrote desired lines. In other property, we maintained our positions while reducing in areas with the most pressure on rates. Our gross to net strategy is another differentiator which we believe will support sustained attractive returns. We generally retain approximately half of our assumed property catastrophe premiums while sharing a portion with our third-party capital partner balance sheets, and earning fee income in exchange. Fee income is less sensitive to rate movements, and reduces the overall volatility of our returns.
Casualty and Specialty
Part of fulfilling our vision of being the best underwriter is knowing when to grow our portfolio and when to exercise discipline. Each line of business in the Casualty and Specialty segment is at a different point in the cycle and we continually manage our participation to achieve the best portfolio mix and balance of risk and reward. Our prior work building strong relationships with key customers has allowed us to gain superior access to desirable business. We have focused our growth in attractive areas while reducing on deals that do not meet our return hurdles.
The Casualty and Specialty segment is strategically important to our vision of being the best underwriter as it allows us to trade with clients across classes and access the most attractive lines across property, casualty and specialty while also generating substantial float in an attractive interest rate environment. Across our Casualty and Specialty segment, we have experienced, and expect to continue to experience, movements up or down across different lines of business over time. This is the nature of the business and part of managing a diversified underwriting book.
Over the course of the year, we continued to shape our casualty portfolio, reducing our exposure in select lines this year, such as in general casualty and professional liability. We did this in a way that was sensitive to the needs of our customers, while maintaining strategic flexibility. Our portfolio management and robust reserving process has provided us with overall stability in the Casualty and Specialty segment, allowing the segment to remain a substantial contributor to our financial results, primarily through the investment income that we generate from the segment’s reserves. This diversification has also been beneficial when certain classes of business or underwriting years have experienced increasing loss trends and required more
101
reserves. We believe that we have a prudent reserving process for our Casualty and Specialty segment and remain confident in our reserves.
At the January 1, 2026 renewals, our aim was to maintain our strong leadership across specialty, increase our market share in credit, and to continue manage our exposure to areas most at risk of continued loss inflation in casualty. We believe that we succeeded in this regard.
We typically manage our casualty business over a 10-year cycle. Over this cycle, we expect there to be shifts between the generation of underwriting and investments results in this business – currently, the balance is skewed toward investment returns. This 10-year cycle is also the perspective from which we manage our exposure. We have been closely monitoring casualty loss trends, and our longstanding approach is to recognize increasing trends early. We are reflecting our insights in our reserving process to proactively stay ahead of trend and inform portfolio shaping decisions. In our general casualty class specifically, we have been closely monitoring trends in general liability where inflation and claims severity have been increasing. While rates in general liability have increased and we believe this remains ahead of trend, we intend to continue to take a conservative approach and have reduced our general liability exposure over the last year. During the last year we have worked closely with our clients with a partnership lens, and have observed meaningful progress in their efforts to address social inflation trends, aiding us in structuring our lines to create the optimal portfolio for the next cycle.
Fee Income
We take a differentiated approach to our Capital Partners unit, with a focus on first sourcing the risks that we intend to write, and then matching them with the appropriate third-party capital. This business improves our offerings to customers, enhances our ability to optimize our portfolios, and generates attractive fees for doing so. Over the past several years, this has been a growing, strong and consistent contributor to our financial results.
We earn fee income in exchange for sharing risk with our third-party capital partners, and while we share underwriting income during profitable periods, we also share underwriting losses. We view fee income as a growing and sustainable driver of profit that we expect will continue to generate low-volatility management fee income. However, fees may be impacted by large losses, such as those experienced during the first quarter, which can potentially result in reduced management fees, no performance fees or the reversal of previously accrued performance fees. The fee income that we earn is recorded in multiple line items in our financial statements, refer to “Part II, Item 7. Management’s Discussion and Analysis of Financial Condition and Results of Operations” for additional information on its impact, including for the proportion that is not included in underwriting income (loss).
Investment Income
We structure our investment portfolio to emphasize the preservation of capital and the availability of liquidity to meet our claims obligations, to be well diversified across market sectors, and to generate relatively attractive returns on a risk-adjusted basis over time. Our investment portfolio is intended to complement our underwriting portfolio, and as we have grown and diversified our underwriting business, we have also grown our investment portfolio and have greater flexibility around duration and asset mix to further shape our portfolio. Generally, we view investment income as being relatively less volatile and a diversifying source of income, and as we have increased the contribution of investment income through the increase in the size of our investment portfolio and an evolution in asset mix, it helps to reduce the overall volatility of our operating earnings.
See the “Risk Factors” section in our Form 10-K for additional information on factors that could cause our actual results to differ materially from those in the forward-looking statements contained in this Form 10-K and other documents we file with the SEC.
102
ITEM 7A. QUANTITATIVE AND QUALITATIVE DISCLOSURES ABOUT MARKET RISK
The following risk management discussion and the estimated amounts generated from sensitivities presented are forward-looking statements of market risk assuming certain market conditions occur. Actual results in the future may differ materially from these estimated results due to, among other things, actual developments in the global financial markets and changes in the composition of our investment portfolio, derivatives and product offerings. The results of analysis used by us to assess and mitigate risk should not be considered projections of future events or losses. Refer to “Note On Forward-Looking Statements” for additional discussion regarding forward-looking statements included herein.
We are principally exposed to five types of market risk: interest rate risk; foreign currency risk; credit risk; equity price risk and commodity price risk. Our policies to address these risks in 2025 were not materially different than those used in 2024.
Our investment guidelines permit, subject to approval, investments in derivative instruments such as futures, options, foreign currency forward contracts and swap agreements, which may be used to assume risks or for hedging purposes. Refer to “Note 19. Derivative Instruments” in our “Notes to the Consolidated Financial Statements” for additional information related to derivatives we have entered into.
Interest Rate Risk
Interest rate risk is the price sensitivity of a security to changes in interest rates. Our investment portfolio includes fixed maturity investments, short term investments and fixed income exchange traded funds, as well as private credit funds which primarily invest in debt instruments. The fair values of these investments will fluctuate with changes in interest rates. As a result, we are exposed to interest rate risk with respect to our overall net economic asset position, and also from an accounting standpoint since the assets are carried at fair value.
We may utilize derivative instruments, for example via interest rate overlay strategies, to manage or optimize our duration and treasury curve exposures. In addition, we attempt to maintain adequate liquidity in our fixed maturity investments portfolio to fund operations, pay reinsurance and insurance liabilities and claims and provide funding for unexpected events.
The following tables summarize the aggregate hypothetical increase (decrease) in fair value of our investments from an immediate parallel shift in the treasury yield curve. Assuming credit spreads remain constant and an immediate time horizon, this presents the worst-case scenario:
| Interest Rate Shift in Basis Points | |||||||||||||||||||||||||||||||||||
| At December 31, 2025 | -100 | -50 | Base | 50 | 100 | ||||||||||||||||||||||||||||||
| (in thousands, except percentages) | |||||||||||||||||||||||||||||||||||
Fair value of investments (1) | $ | 33,548,597 | $ | 33,110,778 | $ | 32,672,103 | $ | 32,232,625 | $ | 31,793,051 | |||||||||||||||||||||||||
| Net increase (decrease) in fair value | $ | 876,493 | $ | 438,674 | $ | — | $ | (439,479) | $ | (879,053) | |||||||||||||||||||||||||
| Percentage change in fair value | 2.7 | % | 1.3 | % | — | % | (1.3) | % | (2.7) | % | |||||||||||||||||||||||||
(1)Includes fixed maturity investments, short term investments, fixed income exchange traded funds and private credit funds.
| Interest Rate Shift in Basis Points | |||||||||||||||||||||||||||||||||||
| At December 31, 2024 | -100 | -50 | Base | 50 | 100 | ||||||||||||||||||||||||||||||
| (in thousands, except percentages) | |||||||||||||||||||||||||||||||||||
Fair value of investments (1) | $ | 30,049,296 | $ | 29,662,274 | $ | 29,275,315 | $ | 28,888,629 | $ | 28,502,051 | |||||||||||||||||||||||||
| Net increase (decrease) in fair value | $ | 773,981 | $ | 386,960 | $ | — | $ | (386,686) | $ | (773,264) | |||||||||||||||||||||||||
| Percentage change in fair value | 2.6 | % | 1.3 | % | — | % | (1.3) | % | (2.6) | % | |||||||||||||||||||||||||
(1)Includes fixed maturity investments, short term investments and private credit funds.
As noted above, we use derivative instruments, primarily interest rate futures and interest rate swaps, within our portfolio of fixed maturity investments to manage our exposure to interest rate risk, which can include increasing or decreasing our exposure to this risk. At December 31, 2025, we had $7.6 billion of notional long positions and $4.2 billion of notional short positions of primarily U.S. treasury and non-US government bond futures contracts (2024 - $7.1 billion and $3.1 billion, respectively). In addition, at December 31, 2025,
103
we had $29.6 million of notional positions paying a fixed rate denominated in U.S. dollar swap contracts (2024 - $Nil). Refer to “Note 19. Derivative Instruments” in our “Notes to the Consolidated Financial Statements” for additional information related to the interest rate derivatives we have entered into.
At December 31, 2025, the aggregate hypothetical impact of an immediate upward parallel shift in the treasury yield curve of 100 basis points would be an increase in the market value of our net position in interest rate futures and swaps of approximately $2.4 million (2024 - a decrease of $105.0 million). Conversely, at December 31, 2025, the aggregate hypothetical impact of an immediate downward parallel shift in the treasury yield curve of 100 basis points would be a decrease in the market value of our net position in interest rate futures and swaps of approximately $8.5 million (2024 - an increase of $105.0 million). The foregoing reflects the use of an immediate time horizon, since this presents the worst-case scenario. Credit spreads are assumed to remain constant in these hypothetical examples.
Foreign Currency Risk
Our functional currency for consolidated reporting purposes is the U.S. dollar. We routinely write a portion of our business in currencies other than U.S. dollars and invest a portion of our cash and investment portfolio in those currencies. In addition, certain of our entities have, or have had, non-U.S. dollar functional currencies. As a result, we may experience foreign exchange gains and losses in our consolidated financial statements. We are primarily impacted by the foreign currency risk exposures noted below, and may, from time to time, enter into foreign currency forward and option contracts to minimize the effect of fluctuating foreign currencies on the value of non-U.S. dollar denominated assets and liabilities. Refer to “Note 19. Derivative Instruments” in our “Notes to the Consolidated Financial Statements” for additional information related to the foreign currency derivatives we have entered into.
Underwriting Operations
Our foreign currency policy with regard to our underwriting operations is generally to enter into foreign currency forward and option contracts for notional values that approximate the foreign currency liabilities, including claims and claim expense reserves and reinsurance balances payable, net of any cash, investments and receivables held in the respective foreign currency. Our use of foreign currency forward and option contracts is intended to minimize the effect of fluctuating foreign currencies on the value of non-U.S. dollar denominated assets and liabilities associated with our underwriting operations. We may determine not to match a portion of our projected underwriting related assets or liabilities with underlying foreign currency exposure with investments in the same currencies, which would increase our exposure to foreign currency fluctuations and potentially increase the impact and volatility of foreign exchange gains and losses on our results of operations.
Investment Portfolio
Our investment portfolio is exposed to currency fluctuations through our investments in non-U.S. dollar fixed maturity investments, short term investments and other investments. To economically hedge our exposure to currency fluctuations from these investments, we may enter into foreign currency forward contracts. In certain instances, we may assume foreign exchange risk as part of our investment strategy. Realized and unrealized foreign exchange gains or losses from the sale of our non-U.S. dollar fixed maturity investments trading and other investments, and foreign exchange gains or losses associated with our hedging of these non-U.S. dollar investments are recorded in net foreign exchange gains (losses) in our consolidated statements of operations. In the future, we may choose to increase our exposure to non-U.S. dollar investments.
104
The following tables summarize the principal currencies creating foreign exchange risk for us and our net foreign currency exposures and the impact of a hypothetical 10% change in our net foreign currency exposure, keeping all other variables constant, as of the dates indicated:
| At December 31, 2025 | AUD | CAD | EUR | GBP | JPY | NZD | Other | Total | |||||||||||||||||||||||||||||||||||||||||||||
| (in thousands, except for percentages) | |||||||||||||||||||||||||||||||||||||||||||||||||||||
| Net assets (liabilities) denominated in foreign currencies | $ | 36,465 | $ | 45,816 | $ | (559,123) | $ | (107,873) | $ | (35,400) | $ | (5,668) | $ | (86,974) | $ | (712,757) | |||||||||||||||||||||||||||||||||||||
| Net foreign currency derivatives notional amounts | (23,134) | (84,207) | 626,446 | 110,338 | 24,860 | (575) | 82,203 | 735,931 | |||||||||||||||||||||||||||||||||||||||||||||
| Total net foreign currency exposure | $ | 13,331 | $ | (38,391) | $ | 67,323 | $ | 2,465 | $ | (10,540) | $ | (6,243) | $ | (4,771) | $ | 23,174 | |||||||||||||||||||||||||||||||||||||
| Net foreign currency exposure as a percentage of total shareholders’ equity attributable to RenaissanceRe | 0.1 | % | (0.3) | % | 0.6 | % | — | % | (0.1) | % | (0.1) | % | — | % | 0.2 | % | |||||||||||||||||||||||||||||||||||||
| Impact of a hypothetical 10% change in total net foreign currency exposure | $ | (1,333) | $ | 3,839 | $ | (6,732) | $ | (247) | $ | 1,054 | $ | 624 | $ | 477 | $ | (2,317) | |||||||||||||||||||||||||||||||||||||
| At December 31, 2024 | AUD | CAD | EUR | GBP | JPY | NZD | Other | Total | |||||||||||||||||||||||||||||||||||||||||||||
| (in thousands, except for percentages) | |||||||||||||||||||||||||||||||||||||||||||||||||||||
| Net (liabilities) assets denominated in foreign currencies | $ | 71,053 | $ | 126,520 | $ | (541,557) | $ | (233,774) | $ | (63,163) | $ | 9,210 | $ | (129,188) | $ | (760,899) | |||||||||||||||||||||||||||||||||||||
| Net foreign currency derivatives notional amounts | (26,097) | (76,318) | 506,972 | 266,215 | 25,834 | 596 | 64,714 | 761,916 | |||||||||||||||||||||||||||||||||||||||||||||
| Total net foreign currency exposure | $ | 44,956 | $ | 50,202 | $ | (34,585) | $ | 32,441 | $ | (37,329) | $ | 9,806 | $ | (64,474) | $ | 1,017 | |||||||||||||||||||||||||||||||||||||
| Net foreign currency exposure as a percentage of total shareholders’ equity attributable to RenaissanceRe | 0.4 | % | 0.5 | % | (0.3) | % | 0.3 | % | (0.4) | % | 0.1 | % | (0.6) | % | — | % | |||||||||||||||||||||||||||||||||||||
| Impact of a hypothetical 10% change in total net foreign currency exposure | $ | (4,496) | $ | (5,020) | $ | 3,459 | $ | (3,244) | $ | 3,733 | $ | (981) | $ | 6,447 | $ | (102) | |||||||||||||||||||||||||||||||||||||
Credit Risk
Credit risk relates to the uncertainty of a counterparty’s ability to make timely payments in accordance with contractual terms of the instrument or contract and market risk associated with changes in credit spreads. We are primarily exposed to direct credit risk within our investment portfolio, and through customers and reinsurers in the form of premiums receivable and reinsurance recoverable, respectively, as discussed below.
Investment Portfolio
Credit risk, which we are exposed to through our fixed maturity investments, short term investments, fixed income exchange traded funds, as well as our private credit funds which primarily invest in debt instruments, is the exposure to adverse changes in the creditworthiness of individual investment holdings, issuers, groups of issuers, industries and countries. We manage credit risk in our fixed maturity and short term investments through credit research performed by our investment management service providers, our evaluation of these investment managers’ adherence to investment mandates provided to them, independent credit research and active monitoring of our credit exposure relative to broader economic fundamentals, valuations and technical measurements. The management of credit risk in the investment portfolio is integrated in our credit risk governance framework and the management of credit exposures and concentrations within the investment portfolio are carried out in accordance with our risk policies, limits and risk concentrations as overseen by the Investment and Risk Management Committee of our Board. In the investment portfolio, we review on a regular basis our asset concentration, credit quality and adherence to credit limit guidelines. In addition, we limit the amount of credit exposure to any one financial institution and, except for the securities of the U.S. Government, U.S. Government related entities, the Federal National
105
Mortgage Association, and money market securities, none of our fixed maturity and short term investments exceeded 10% of shareholders’ equity at December 31, 2025 and 2024.
At December 31, 2025, our fixed maturity investments and short term investment portfolio had a dollar-weighted average credit quality rating of AA (2024 - AA). The following table summarizes the ratings of our fixed maturity investments and short term investments (using ratings assigned by S&P and/or other rating agencies when S&P ratings were not available) as a percentage of the total of those investments as of the dates indicated:
| At December 31, | 2025 | 2024 | |||||||||||||||
AAA | 19.1 | % | 17.7 | % | |||||||||||||
AA | 52.1 | % | 56.0 | % | |||||||||||||
A | 12.1 | % | 10.6 | % | |||||||||||||
BBB | 12.4 | % | 10.4 | % | |||||||||||||
Non-investment grade | 3.9 | % | 5.1 | % | |||||||||||||
Not rated | 0.4 | % | 0.2 | % | |||||||||||||
| Total | 100.0 | % | 100.0 | % | |||||||||||||
Fixed income exchange traded funds and private credit funds are not included in the table above. Our investments in fixed income exchange traded funds each invest into a combination of treasuries, corporate bonds or asset-backed and mortgage-backed fixed maturity investments. The weighted average credit rating of the underlying investments held by the exchange traded funds is BBB.
Our investments in private credit funds include limited partnership or similar interests that invest in certain private credit asset classes, including senior secured bank loan funds, U.S. direct lending, secondaries, mezzanine investments and distressed securities.
We consider the impact of credit spread movements on the fair value of our fixed maturity investments, short term investments, fixed income exchange traded funds and private credit funds. As credit spreads widen, the fair value of our fixed maturity investments, short term investments, fixed income exchange traded funds and private credit funds decreases, and vice versa.
The following tables summarize the aggregate hypothetical increase (decrease) in fair value of our investments from an immediate parallel shift in credit spreads. Assuming treasury yields remain constant, credit spreads cannot be negative and an immediate time horizon, this presents the worst-case scenario:
| Credit Spread Shift in Basis Points | |||||||||||||||||||||||||||||||||||
| At December 31, 2025 | -100 | -50 | Base | 50 | 100 | ||||||||||||||||||||||||||||||
| (in thousands, except percentages) | |||||||||||||||||||||||||||||||||||
Fair value of investments (1) | $ | 33,055,085 | $ | 32,901,981 | $ | 32,672,103 | $ | 32,393,033 | $ | 32,112,208 | |||||||||||||||||||||||||
| Net increase (decrease) in fair value | $ | 382,981 | $ | 229,877 | $ | — | $ | (279,071) | $ | (559,896) | |||||||||||||||||||||||||
| Percentage change in fair value | 1.2 | % | 0.7 | % | — | % | (0.9) | % | (1.7) | % | |||||||||||||||||||||||||
(1)Includes fixed maturity investments, short term investments, fixed income exchange traded funds and private credit funds.
| Credit Spread Shift in Basis Points | |||||||||||||||||||||||||||||||||||
| At December 31, 2024 | -100 | -50 | Base | 50 | 100 | ||||||||||||||||||||||||||||||
| (in thousands, except percentages) | |||||||||||||||||||||||||||||||||||
Fair value of investments (1) | $ | 29,567,525 | $ | 29,469,996 | $ | 29,275,315 | $ | 29,049,045 | $ | 28,822,654 | |||||||||||||||||||||||||
| Net increase (decrease) in fair value | $ | 292,210 | $ | 194,681 | $ | — | $ | (226,270) | $ | (452,661) | |||||||||||||||||||||||||
| Percentage change in fair value | 1.0 | % | 0.7 | % | — | % | (0.8) | % | (1.5) | % | |||||||||||||||||||||||||
(1)Includes fixed maturity investments, short term investments and private credit funds.
We also employ credit derivatives in our investment portfolio to either assume credit risk or hedge our credit exposure. At December 31, 2025, we had outstanding credit derivatives of $500.9 million in notional positions to protect the investment portfolio against increasing credit risk and $39.5 million in notional
106
positions to assume credit risk, denominated in U.S. dollars (2024 - $1.0 billion and $Nil, respectively). Refer to “Note 19. Derivative Instruments” in our “Notes to the Consolidated Financial Statements” for additional information related to our credit derivatives.
The aggregate hypothetical market value impact from an immediate tightening in credit spreads of 100 basis points would cause a decrease in the market value of our net position in these derivatives of approximately $19.4 million at December 31, 2025 (2024 - $34.0 million). Conversely, the aggregate hypothetical market value impact from an immediate widening in credit spreads of 100 basis points would cause an increase in the market value of our net position in these derivatives of approximately $18.5 million at December 31, 2025 (2024 - $42.3 million). For an immediate downward shift in credit spreads, we do not allow credit spreads to go negative in calculating the impact. The foregoing reflects the use of an immediate time horizon, since this presents the worst-case scenario.
Premiums Receivable and Reinsurance Recoverable
Premiums receivable from ceding companies and reinsurance recoverable from our reinsurers are subject to credit risk. To mitigate credit risk related to reinsurance premiums receivable, we have established standards for ceding companies and, in most cases, have a contractual right of offset allowing us to settle claims net of any reinsurance premiums receivable. To mitigate credit risk related to our reinsurance recoverable amounts, we consider the financial strength of our reinsurers when determining whether to purchase coverage from them. We generally obtain reinsurance coverage from companies rated “A-” or better by major rating agencies unless the obligations are collateralized. We routinely monitor the financial performance and rating status of all material reinsurers. Refer to “Part II, Item 7. Management’s Discussion and Analysis of Financial Condition and Results of Operations—Summary of Critical Accounting Estimates—Reinsurance Recoverable” for additional information with respect to reinsurance recoverable.
Equity Price Risk
Equity price risk is the potential loss arising from changes in the market value of equity investments, excluding fixed income exchange traded funds, which are subject to interest rate and credit risk above. As detailed in the table below, we are directly exposed to this risk through our investments in common stock equity investments, including certain positions in our strategic investment portfolio, which are traded on nationally recognized stock exchanges; and indirectly exposed to this risk through other investments such as our direct private equity investments, private equity funds and hedge funds, whose exit strategies and market values often depend on the wider equity markets. We may, from time to time, use equity derivatives in our investment portfolio to either assume equity risk or hedge our equity exposure.
The following table summarizes a hypothetical 10% increase or decline in the market value of our private equity funds, hedge funds, direct private equity investments, and common stock, holding all other factors constant, at the dates indicated:
| At December 31, | 2025 | 2024 | |||||||||||||||
| (in thousands, except for percentages) | |||||||||||||||||
| Private equity funds | $ | 701,837 | $ | 609,105 | |||||||||||||
| Hedge funds | 473,990 | 338,248 | |||||||||||||||
| Direct private equity investments | 185,005 | 211,866 | |||||||||||||||
Common stock | 150,179 | 117,756 | |||||||||||||||
Total carrying value of investments exposed to equity price risk | $ | 1,511,011 | $ | 1,276,975 | |||||||||||||
Impact of a hypothetical 10% increase in the carrying value of investments exposed to equity price risk | $ | 151,101 | $ | 127,698 | |||||||||||||
Impact of a hypothetical 10% decrease in the carrying value of investments exposed to equity price risk | $ | (151,101) | $ | (127,698) | |||||||||||||
107
Commodity Price Risk
Commodity price risk is the potential loss arising from changes in the market value of commodities. We are directly exposed to this risk through our investments in commodity derivative instruments, which are exchange traded, but may include over-the-counter derivative instruments when deemed appropriate. At December 31, 2025 the total notional amount of commodity contracts was $1.2 billion (2024 - $684.8 million), and the aggregate fair value of these contracts was a net liability position of $12.4 million (2024 - net asset position of $6.4 million). If the underlying exposure of each commodity derivative held at December 31, 2025 depreciated by 10%, it would have resulted in a reduction in net income of $118.9 million (2024 - $68.7 million). If the underlying exposure of each commodity derivative held at December 31, 2025 appreciated by 10%, it would have resulted in an increase in net income of $118.9 million (2024 - $68.9 million).
ITEM 8. FINANCIAL STATEMENTS AND SUPPLEMENTARY DATA
Reference is made to Item 15 of this Report for the Consolidated Financial Statements of RenaissanceRe and the Notes thereto, as well as the Schedules to the Consolidated Financial Statements.
ITEM 9. CHANGES IN AND DISAGREEMENTS WITH ACCOUNTANTS ON ACCOUNTING AND FINANCIAL DISCLOSURE
None.
ITEM 9A. CONTROLS AND PROCEDURES
Evaluation of Disclosure Controls and Procedures
Under the supervision and with the participation of our management, including our Chief Executive Officer and Chief Financial Officer, we have evaluated the effectiveness of the design and operation of our disclosure controls and procedures, as defined in Rules 13a-15(b) and 15d-15(b) of the Exchange Act, as of the end of the period covered by this report. Based upon that evaluation, our management, including our Chief Executive Officer and Chief Financial Officer, concluded that, at December 31, 2025, our disclosure controls and procedures were effective to provide reasonable assurance that information required to be disclosed in Company reports filed or submitted under the Exchange Act is (i) recorded, processed, summarized and reported within the time periods specified in the SEC rules and forms and (ii) accumulated and communicated to our management, including our Chief Executive Officer and Chief Financial Officer, as appropriate to allow timely decisions regarding required disclosure.
Management’s Annual Report on Internal Control Over Financial Reporting
Our management is responsible for establishing and maintaining effective internal control over financial reporting as defined in Rules 13a-15(f) and 15d-15(f) under the Exchange Act, as amended. Our internal control over financial reporting was designed to provide reasonable assurance regarding the reliability of financial reporting and the preparation of financial statements for external purposes in accordance with U.S. generally accepted accounting principles and to reflect management’s judgments and estimates concerning effects of events and transactions that are accounted for or disclosed.
Our internal control over financial reporting includes those policies and procedures that: (1) pertain to the maintenance of records that, in reasonable detail, accurately and fairly reflect our transactions and the dispositions of our assets; (2) provide reasonable assurance that transactions are recorded as necessary to permit preparation of financial statements in accordance with generally accepted accounting principles, and that our receipts and expenditures are being made only in accordance with authorizations of our management and directors; and (3) provide reasonable assurance regarding prevention or timely detection of unauthorized acquisition, use or disposition of our assets that could have a material effect on our financial statements.
There are inherent limitations to the effectiveness of any controls. Our Board and management, including our Chief Executive Officer and Chief Financial Officer, do not expect that our disclosure controls and procedures or internal control over financial reporting will prevent all errors and all fraud. Controls, no matter
108
how well conceived and operated, can provide only reasonable, not absolute, assurance that the objectives of the controls are met. Further, we believe that the design of controls must reflect appropriate resource constraints, and the benefits of controls must be considered relative to their costs. Because of the inherent limitations in controls, no evaluation of controls can provide absolute assurance that all control issues and instances of fraud, if any, within RenaissanceRe have been detected.
Management, with the participation of the Chief Executive Officer and Chief Financial Officer, assessed our internal control over financial reporting as of December 31, 2025 using the criteria set forth by the Committee of Sponsoring Organizations of the Treadway Commission (COSO) in Internal Control-Integrated Framework (2013). Based on this assessment, management concluded that RenaissanceRe’s internal control over financial reporting was effective as of December 31, 2025.
PricewaterhouseCoopers Ltd., the independent registered public accountants who audited our consolidated financial statements included in this Form 10-K, audited our internal control over financial reporting as of December 31, 2025 and their attestation report on our internal control over financial reporting is included herein.
Changes in Internal Control Over Financial Reporting
There were no changes in our internal control over financial reporting during the quarter ended December 31, 2025, which were identified in connection with our evaluation required pursuant to Rules 13a-15 or 15d-15 under the Exchange Act, that have materially affected, or are reasonably likely to materially affect, our internal control over financial reporting.
ITEM 9B. OTHER INFORMATION
ITEM 9C. DISCLOSURE REGARDING FOREIGN JURISDICTIONS THAT PREVENT INSPECTIONS
None.
109
PART III
ITEM 10. DIRECTORS, EXECUTIVE OFFICERS AND CORPORATE GOVERNANCE
The information required by this Item relating to our directors, executive officers and corporate governance is incorporated herein by reference to information found in our Proxy Statement for the Annual General Meeting of Shareholders to be held on May 5, 2026. We intend to file our Proxy Statement no later than 120 days after the close of the fiscal year.
We have adopted a Code of Ethics within the meaning of Item 406 of Regulation S-K of the Exchange Act that applies to all of our directors and employees, including our principal executive officer, principal financial officer, principal accounting officer, controller and other persons performing similar functions. The Code of Ethics is available free of charge on our website www.renre.com. We will also provide a printed version of the Code of Ethics to any shareholder who requests it. We intend to disclose any amendments to our Code of Ethics by posting such information on our website. Any waivers of our Code of Ethics applicable to our directors, principal executive officer, principal financial officer, principal accounting officer or controller and other persons who perform similar functions will be disclosed on our website or by filing a Form 8-K, as required.
We have adopted an insider trading policy that outlines the procedures which employees, officers, directors, independent contractors and consultants of the Company must follow to ensure compliance with U.S. rules related to disclosure and insider trading. In addition, our insider trading policy provides that the Company will not trade in RenaissanceRe securities in violation of applicable securities laws or stock exchange listing standards. A copy of the Company’s insider trading policy has been filed as Exhibit 19.1 to this Annual Report on Form 10-K.
ITEM 11. EXECUTIVE COMPENSATION
The information required by this Item is incorporated herein by reference to information included in our Proxy Statement.
ITEM 12. SECURITY OWNERSHIP OF CERTAIN BENEFICIAL OWNERS AND MANAGEMENT AND RELATED SHAREHOLDER MATTERS
The information required by this Item is incorporated herein by reference to information included in our Proxy Statement.
ITEM 13. CERTAIN RELATIONSHIPS AND RELATED TRANSACTIONS, AND DIRECTOR INDEPENDENCE
The information required by this Item is incorporated herein by reference to information included in our Proxy Statement.
ITEM 14. PRINCIPAL ACCOUNTANT FEES AND SERVICES
The information required by this Item is incorporated herein by reference to information included in our Proxy Statement.
PART IV
ITEM 15. EXHIBITS AND FINANCIAL STATEMENT SCHEDULES
Financial Statements
The Consolidated Financial Statements of RenaissanceRe Holdings Ltd. and related Notes thereto are listed in the accompanying Index to Consolidated Financial Statements and are filed as part of this Form 10-K.
110
Financial Statement Schedules
The Schedules to the Consolidated Financial Statements of RenaissanceRe Holdings Ltd. are listed in the accompanying Index to Schedules to Consolidated Financial Statements and are filed as a part of this Form 10-K.
111
Exhibit Index
| Exhibit Number | Description | ||||
| 2.1 | |||||
2.1(a) | |||||
2.1(b) | |||||
2.1(c) | |||||
2.1(d)+ | |||||
2.1(e) | |||||
| 3.1 | Memorandum of Association, incorporated by reference to the Registration Statement on Form S-1 of RenaissanceRe Holdings Ltd. (Registration No. 33-70008) which was declared effective by the SEC on July 26, 1995. (P) | ||||
| 3.2 | |||||
| 3.3 | |||||
| 3.4 | Specimen Common Share certificate, incorporated by reference to the Registration Statement on Form S-1 of RenaissanceRe Holdings Ltd. (Registration No. 33-70008) which was declared effective by the SEC on July 26, 1995. (P) | ||||
| 4.1 | |||||
| 4.1(a) | |||||
| 4.1(b) | |||||
| 4.1(c) | |||||
112
| 4.2 | |||||
| 4.2(a) | |||||
| 4.2(b) | |||||
| 4.2(c) | |||||
| 4.3 | |||||
4.3(a) | |||||
4.3(b) | |||||
4.3(c) | |||||
| 4.4 | |||||
4.4(a) | |||||
4.4(b) | |||||
4.4(c) | |||||
| 4.5 | |||||
113
| 10.1* | |||||
10.2* | |||||
10.3* | |||||
10.4* | |||||
10.5* | |||||
10.5(a)* | |||||
10.5(b)* | |||||
10.5(c)* | |||||
10.5(d)* | |||||
10.5(e)* | |||||
10.5(f)* | |||||
10.6* | |||||
10.6(a)* | |||||
10.7* | |||||
114
10.7(a)* | |||||
10.8* | |||||
10.9* | |||||
| 10.10 | |||||
| 10.11 | |||||
10.11(a) | |||||
| 10.12 | |||||
10.12(a) | |||||
10.12(b) | |||||
| 10.13 | |||||
115
116
| 32.2 | |||||
| 97.1 | |||||
101.INS Inline XBRL Instance Document - the instance document does not appear in the Interactive Data File because its XBRL tags are embedded within the Inline XBRL document
101.SCH Inline XBRL Taxonomy Extension Schema Document
101.CAL Inline XBRL Taxonomy Extension Calculation Linkbase Document
101.LAB Inline XBRL Taxonomy Extension Label Linkbase Document
101.PRE Inline XBRL Taxonomy Extension Presentation Linkbase Document
101.DEF Inline XBRL Taxonomy Extension Definition Linkbase Document
104 Cover Page Interactive Data File (embedded within the Inline XBRL document and included in Exhibit 101)
* Represents management contract or compensatory plan or arrangement.
** Applicable to Ross A. Curtis and Robert Qutub.
+ Certain information in this exhibit has been omitted because it is both (i) not material and (ii) is the type that the registrant treats as private or confidential.
ITEM 16. FORM 10-K SUMMARY
Not applicable.
117
SIGNATURES
Pursuant to the requirements of Section 13 or 15(d) of the Securities Exchange Act of 1934, the Registrant has duly caused this report to be signed on its behalf by the undersigned, thereunto duly authorized.
| Date: | February 11, 2026 | RENAISSANCERE HOLDINGS LTD. | |||||||||
| /s/ Kevin J. O’Donnell | |||||||||||
| Kevin J. O’Donnell | |||||||||||
| Chief Executive Officer and President | |||||||||||
Pursuant to the requirements of the Securities Exchange Act of 1934, this report has been signed below by the following persons on behalf of the registrant and in the capacities and on the dates indicated.
| Signature | Title | Date | ||||||||||||
| /s/ Kevin J. O’Donnell | Chief Executive Officer, President and Director (Principal Executive Officer) | February 11, 2026 | ||||||||||||
Kevin J. O’Donnell | ||||||||||||||
| /s/ Robert Qutub | Executive Vice President and Chief Financial Officer (Principal Financial Officer) | February 11, 2026 | ||||||||||||
| Robert Qutub | ||||||||||||||
| /s/ James C. Fraser | Senior Vice President and Chief Accounting Officer (Principal Accounting Officer) | February 11, 2026 | ||||||||||||
| James C. Fraser | ||||||||||||||
| /s/ James L. Gibbons | Non-Executive Chair of the Board of Directors | February 11, 2026 | ||||||||||||
James L. Gibbons | ||||||||||||||
| /s/ David C. Bushnell | Director | February 11, 2026 | ||||||||||||
| David C. Bushnell | ||||||||||||||
| /s/ Shyam Gidumal | Director | February 11, 2026 | ||||||||||||
Shyam Gidumal | ||||||||||||||
| /s/ Duncan P. Hennes | Director | February 11, 2026 | ||||||||||||
| Duncan P. Hennes | ||||||||||||||
/s/ Torsten Jeworrek | Director | February 11, 2026 | ||||||||||||
Torsten Jeworrek | ||||||||||||||
| /s/ Henry Klehm, III | Director | February 11, 2026 | ||||||||||||
| Henry Klehm, III | ||||||||||||||
/s/ Loretta J. Mester | Director | February 11, 2026 | ||||||||||||
Loretta J. Mester | ||||||||||||||
| /s/ Valerie Rahmani | Director | February 11, 2026 | ||||||||||||
| Valerie Rahmani | ||||||||||||||
| /s/ Carol P. Sanders | Director | February 11, 2026 | ||||||||||||
| Carol P. Sanders | ||||||||||||||
| /s/ Cynthia Trudell | Director | February 11, 2026 | ||||||||||||
Cynthia Trudell | ||||||||||||||
118
INDEX TO CONSOLIDATED FINANCIAL STATEMENTS
| Page | |||||
Report of Independent Registered Public Accounting Firm (PCAOB ID: | F-2 | ||||
F-5 | |||||
F-6 | |||||
F-7 | |||||
F-8 | |||||
F-9 | |||||
F-10 | |||||
F-10 | |||||
F-10 | |||||
F-17 | |||||
F-21 | |||||
F-24 | |||||
F-29 | |||||
F-37 | |||||
F-39 | |||||
F-51 | |||||
F-56 | |||||
F-61 | |||||
F-65 | |||||
F-1
Report of Independent Registered Public Accounting Firm
To the Board of Directors and Shareholders of RenaissanceRe Holdings Ltd.
Opinions on the Financial Statements and Internal Control over Financial Reporting
We have audited the accompanying consolidated balance sheets of RenaissanceRe Holdings Ltd. and its subsidiaries (the “Company”) as of December 31, 2025 and 2024, and the related consolidated statements of operations, comprehensive income (loss), changes in shareholders’ equity, and cash flows for each of the three years in the period ended December 31, 2025, including the related notes and financial statement schedules listed in the index appearing on page S-1 (collectively referred to as the “consolidated financial statements”). We also have audited the Company’s internal control over financial reporting as of December 31, 2025, based on criteria established in Internal Control - Integrated Framework (2013) issued by the Committee of Sponsoring Organizations of the Treadway Commission (COSO).
In our opinion, the consolidated financial statements referred to above present fairly, in all material respects, the financial position of the Company as of December 31, 2025 and 2024, and the results of its operations and its cash flows for each of the three years in the period ended December 31, 2025 in conformity with accounting principles generally accepted in the United States of America. Also in our opinion, the Company maintained, in all material respects, effective internal control over financial reporting as of December 31, 2025, based on criteria established in Internal Control - Integrated Framework (2013) issued by the COSO.
Basis for Opinions
The Company’s management is responsible for these consolidated financial statements, for maintaining effective internal control over financial reporting, and for its assessment of the effectiveness of internal control over financial reporting, included in Management’s Annual Report on Internal Control over Financial Reporting appearing under Item 9A. Our responsibility is to express opinions on the Company’s consolidated financial statements and on the Company’s internal control over financial reporting based on our audits. We are a public accounting firm registered with the Public Company Accounting Oversight Board (United States) (PCAOB) and are required to be independent with respect to the Company in accordance with the U.S. federal securities laws and the applicable rules and regulations of the Securities and Exchange Commission and the PCAOB.
We conducted our audits in accordance with the standards of the PCAOB. Those standards require that we plan and perform the audits to obtain reasonable assurance about whether the consolidated financial statements are free of material misstatement, whether due to error or fraud, and whether effective internal control over financial reporting was maintained in all material respects.
Our audits of the consolidated financial statements included performing procedures to assess the risks of material misstatement of the consolidated financial statements, whether due to error or fraud, and performing procedures that respond to those risks. Such procedures included examining, on a test basis, evidence regarding the amounts and disclosures in the consolidated financial statements. Our audits also included evaluating the accounting principles used and significant estimates made by management, as well as evaluating the overall presentation of the consolidated financial statements. Our audit of internal control over financial reporting included obtaining an understanding of internal control over financial reporting, assessing the risk that a material weakness exists, and testing and evaluating the design and operating effectiveness of internal control based on the assessed risk. Our audits also included performing such other procedures as we considered necessary in the circumstances. We believe that our audits provide a reasonable basis for our opinions.
Definition and Limitations of Internal Control over Financial Reporting
A company’s internal control over financial reporting is a process designed to provide reasonable assurance regarding the reliability of financial reporting and the preparation of financial statements for external purposes in accordance with generally accepted accounting principles. A company’s internal control over financial reporting includes those policies and procedures that (i) pertain to the maintenance of records that,
F-2
in reasonable detail, accurately and fairly reflect the transactions and dispositions of the assets of the company; (ii) provide reasonable assurance that transactions are recorded as necessary to permit preparation of financial statements in accordance with generally accepted accounting principles, and that receipts and expenditures of the company are being made only in accordance with authorizations of management and directors of the company; and (iii) provide reasonable assurance regarding prevention or timely detection of unauthorized acquisition, use, or disposition of the company’s assets that could have a material effect on the financial statements.
Because of its inherent limitations, internal control over financial reporting may not prevent or detect misstatements. Also, projections of any evaluation of effectiveness to future periods are subject to the risk that controls may become inadequate because of changes in conditions, or that the degree of compliance with the policies or procedures may deteriorate.
Critical Audit Matters
The critical audit matter communicated below is a matter arising from the current period audit of the consolidated financial statements that was communicated or required to be communicated to the audit committee and that (i) relates to accounts or disclosures that are material to the consolidated financial statements and (ii) involved our especially challenging, subjective, or complex judgments. The communication of critical audit matters does not alter in any way our opinion on the consolidated financial statements, taken as a whole, and we are not, by communicating the critical audit matter below, providing a separate opinion on the critical audit matter or on the accounts or disclosures to which it relates.
Valuation of Reserve for Claims and Claim Expenses
As described in Notes 2 and 8 to the consolidated financial statements, the Company’s reserve for claims and claim expenses represents management’s estimates, including actuarial and statistical projections at a given point in time, of the ultimate settlement and administration costs for unpaid claims and claim expenses arising from the insurance and reinsurance contracts the Company sells. The Company’s reserve for claims and claim expenses was $22.3 billion at December 31, 2025. In determining management’s estimate of the reserve for claims and claim expenses, management’s analysis includes consideration of loss development patterns, historical ultimate loss ratios, and the presence of individual large losses. Management’s analysis incorporates available information derived from claims information from certain customers and brokers, industry assessments of losses, proprietary models, and the terms and conditions of the Company’s contracts. The estimate for the casualty and specialty segment is sensitive to the selection of actuarial methods, expected trends in claim severity and frequency, the time lag inherent in reporting information, and industry or event trends. The estimate for the property segment is sensitive to the preliminary nature of the information available, the magnitude and relative infrequency of the events, the expected duration of the respective claims development period, inadequacies in the data provided to the relevant date by industry participants and the potential for further reporting lags or insufficiencies, and, in certain instances, significant uncertainty as to the form of the claims and legal issues under the relevant terms of insurance and reinsurance contracts.
The principal considerations for our determination that performing procedures relating to the valuation of the reserve for claims and claim expenses is a critical audit matter are (i) the significant judgment by management when developing their estimate; (ii) a high degree of auditor judgment, subjectivity, and effort in performing procedures and evaluating management’s significant assumptions related to loss development patterns, historical ultimate loss ratios, and the selection of significant actuarial methods; and (iii) the audit effort involved the use of professionals with specialized skill and knowledge.
Addressing the matter involved performing procedures and evaluating audit evidence in connection with forming our overall opinion on the consolidated financial statements. These procedures included testing the effectiveness of controls relating to the Company’s valuation of the reserve for claims and claim expenses, including controls over the development of significant actuarial methods and assumptions. These procedures also included, among others, the involvement of professionals with specialized skill and knowledge to assist in (i) developing an independent estimate for certain reserve segments of the reserve for claims and claim expenses and comparing this independent estimate to management’s determined
F-3
reserve; and (ii) for certain reserve segments, testing management’s process for estimating the reserve for claims and claim expenses by evaluating the appropriateness of management’s aforementioned significant actuarial methods and assumptions. Performing these procedures involved testing the completeness and accuracy of data provided by management on a sample basis.
/s/ PricewaterhouseCoopers Ltd.
February 11, 2026
We have served as the Company’s auditor since 2022.
F-4
RenaissanceRe Holdings Ltd. and Subsidiaries
Consolidated Balance Sheets
At December 31, 2025 and 2024
(in thousands of United States Dollars, except share and per share amounts)
| December 31, 2025 | December 31, 2024 | ||||||||||
| Assets | |||||||||||
Fixed maturity investments trading, at fair value - amortized cost $ | $ | $ | |||||||||
Short term investments, at fair value - amortized cost $ | |||||||||||
Equity investments, at fair value (Notes 5 and 6) | |||||||||||
Other investments, at fair value (Notes 5 and 6) | |||||||||||
Investments in other ventures, under equity method (Note 5) | |||||||||||
| Total investments | |||||||||||
| Cash and cash equivalents | |||||||||||
Premiums receivable (Note 7) | |||||||||||
Prepaid reinsurance premiums | |||||||||||
Reinsurance recoverable (Notes 7 and 8) | |||||||||||
| Accrued investment income | |||||||||||
Deferred acquisition costs and value of business acquired | |||||||||||
Deferred tax asset (Note 15) | |||||||||||
| Receivable for investments sold | |||||||||||
| Other assets | |||||||||||
Goodwill and other intangible assets (Note 4) | |||||||||||
| Total assets | $ | $ | |||||||||
| Liabilities, Noncontrolling Interests and Shareholders’ Equity | |||||||||||
| Liabilities | |||||||||||
Reserve for claims and claim expenses (Note 8) | $ | $ | |||||||||
| Unearned premiums | |||||||||||
Debt (Note 9) | |||||||||||
| Reinsurance balances payable | |||||||||||
| Payable for investments purchased | |||||||||||
| Other liabilities | |||||||||||
| Total liabilities | |||||||||||
Commitments and contingencies (Note 20) | |||||||||||
Redeemable noncontrolling interests (Note 10) | |||||||||||
Shareholders’ Equity | |||||||||||
Preference shares: $ | |||||||||||
Common shares: $ | |||||||||||
Additional paid-in capital (Note 12) | |||||||||||
| Accumulated other comprehensive income (loss) | ( | ( | |||||||||
Retained earnings (Note 12) | |||||||||||
| Total shareholders’ equity attributable to RenaissanceRe | |||||||||||
| Total liabilities, noncontrolling interests and shareholders’ equity | $ | $ | |||||||||
See accompanying notes to the consolidated financial statements
F-5
RenaissanceRe Holdings Ltd. and Subsidiaries
Consolidated Statements of Operations
For the years ended December 31, 2025, 2024, and 2023
(in thousands of United States Dollars, except per share amounts)
| 2025 | 2024 | 2023 | |||||||||||||||
| Revenues | |||||||||||||||||
Gross premiums written (Note 7) | $ | $ | $ | ||||||||||||||
Net premiums written (Note 7) | $ | $ | $ | ||||||||||||||
Decrease (increase) in unearned premiums | |||||||||||||||||
Net premiums earned (Note 7) | |||||||||||||||||
Net investment income (Note 5) | |||||||||||||||||
| Net foreign exchange gains (losses) | ( | ( | ( | ||||||||||||||
Equity in earnings (losses) of other ventures (Note 5) | |||||||||||||||||
Other income (loss) | ( | ||||||||||||||||
Net realized and unrealized gains (losses) on investments (Note 5) | ( | ||||||||||||||||
| Total revenues | |||||||||||||||||
| Expenses | |||||||||||||||||
Net claims and claim expenses incurred (Notes 7 and 8) | |||||||||||||||||
| Acquisition expenses | |||||||||||||||||
| Operational expenses | |||||||||||||||||
| Corporate expenses | |||||||||||||||||
Interest expense (Note 9) | |||||||||||||||||
| Total expenses | |||||||||||||||||
| Income (loss) before taxes | |||||||||||||||||
Income tax benefit (expense) (Note 15) | ( | ( | |||||||||||||||
| Net income (loss) | |||||||||||||||||
Net (income) loss attributable to redeemable noncontrolling interests (Note 10) | ( | ( | ( | ||||||||||||||
| Net income (loss) attributable to RenaissanceRe | |||||||||||||||||
Dividends on preference shares (Note 12) | ( | ( | ( | ||||||||||||||
| Net income (loss) available (attributable) to RenaissanceRe common shareholders | $ | $ | $ | ||||||||||||||
Net income (loss) available (attributable) to RenaissanceRe common shareholders per common share – basic (Note 13) | $ | $ | $ | ||||||||||||||
Net income (loss) available (attributable) to RenaissanceRe common shareholders per common share – diluted (Note 13) | $ | $ | $ | ||||||||||||||
See accompanying notes to the consolidated financial statements
F-6
RenaissanceRe Holdings Ltd. and Subsidiaries
Consolidated Statements of Comprehensive Income (Loss)
For the years ended December 31, 2025, 2024 and 2023
(in thousands of United States Dollars)
| 2025 | 2024 | 2023 | |||||||||||||||
| Comprehensive income (loss) | |||||||||||||||||
| Net income (loss) | $ | $ | $ | ||||||||||||||
| Change in net unrealized gains (losses) on investments, net of tax | |||||||||||||||||
Foreign currency translation adjustments, net of tax | ( | ||||||||||||||||
| Comprehensive income (loss) | |||||||||||||||||
| Comprehensive (income) loss attributable to redeemable noncontrolling interests | ( | ( | ( | ||||||||||||||
| Comprehensive income (loss) attributable to RenaissanceRe | $ | $ | $ | ||||||||||||||
See accompanying notes to the consolidated financial statements
F-7
RenaissanceRe Holdings Ltd. and Subsidiaries
Consolidated Statements of Changes in Shareholders’ Equity
For the years ended December 31, 2025, 2024 and 2023
(in thousands of United States Dollars)
| 2025 | 2024 | 2023 | |||||||||||||||
| Preference shares | |||||||||||||||||
| Balance – January 1 | $ | $ | $ | ||||||||||||||
| Balance – December 31 | |||||||||||||||||
| Common shares | |||||||||||||||||
| Balance – January 1 | |||||||||||||||||
| Issuance of shares (Note 12) | — | — | |||||||||||||||
| Repurchase of shares (Note 12) | ( | ( | — | ||||||||||||||
Issuance of performance share and restricted stock awards (Notes 12 and 17) | |||||||||||||||||
| Balance – December 31 | |||||||||||||||||
| Additional paid-in capital | |||||||||||||||||
| Balance – January 1 | |||||||||||||||||
| Issuance of shares (Note 12) | — | — | |||||||||||||||
| Repurchase of shares (Note 12) | ( | ( | — | ||||||||||||||
| Change in redeemable noncontrolling interest | ( | ( | ( | ||||||||||||||
| Issuance of performance share and restricted stock awards (Notes 12 and 17) | |||||||||||||||||
| Balance – December 31 | |||||||||||||||||
| Accumulated other comprehensive income (loss) | |||||||||||||||||
| Balance – January 1 | ( | ( | ( | ||||||||||||||
| Change in net unrealized gains (loss) on investments, net of tax | |||||||||||||||||
| Foreign currency translation adjustments, net of tax | ( | ||||||||||||||||
| Balance – December 31 | ( | ( | ( | ||||||||||||||
| Retained earnings | |||||||||||||||||
| Balance – January 1 | |||||||||||||||||
| Net income (loss) | |||||||||||||||||
Net (income) loss attributable to redeemable noncontrolling interests (Note 10) | ( | ( | ( | ||||||||||||||
| Repurchase of shares (Note 12) | ( | — | — | ||||||||||||||
Dividends on common shares (Note 12) | ( | ( | ( | ||||||||||||||
Dividends on preference shares (Note 12) | ( | ( | ( | ||||||||||||||
| Balance – December 31 | |||||||||||||||||
| Total shareholders’ equity attributable to RenaissanceRe | $ | $ | $ | ||||||||||||||
See accompanying notes to the consolidated financial statements
F-8
RenaissanceRe Holdings Ltd. and Subsidiaries
Consolidated Statements of Cash Flows
For the years ended December 31, 2025, 2024 and 2023
(in thousands of United States Dollars)
| 2025 | 2024 | 2023 | |||||||||||||||
| Cash flows provided by (used in) operating activities | |||||||||||||||||
| Net income (loss) | $ | $ | $ | ||||||||||||||
| Adjustments to reconcile net income (loss) to net cash provided by (used in) operating activities | |||||||||||||||||
| Amortization, accretion and depreciation | ( | ( | |||||||||||||||
| Equity in undistributed (earnings) losses of other ventures | ( | ( | |||||||||||||||
| Net realized and unrealized (gains) losses on investments | ( | ( | ( | ||||||||||||||
| Change in: | |||||||||||||||||
| Premiums receivable | ( | ( | |||||||||||||||
| Prepaid reinsurance premiums | ( | ||||||||||||||||
| Reinsurance recoverable | |||||||||||||||||
| Deferred acquisition costs and value of business acquired | |||||||||||||||||
| Reserve for claims and claim expenses | ( | ||||||||||||||||
| Unearned premiums | ( | ( | |||||||||||||||
| Reinsurance balances payable | ( | ( | ( | ||||||||||||||
| Other | ( | ( | ( | ||||||||||||||
| Net cash provided by (used in) operating activities | |||||||||||||||||
| Cash flows provided by (used in) investing activities | |||||||||||||||||
| Proceeds from sales and maturities of fixed maturity investments trading | |||||||||||||||||
| Purchases of fixed maturity investments trading | ( | ( | ( | ||||||||||||||
| Proceeds from sales of short term investments | |||||||||||||||||
| Purchases of short term investments | ( | ( | ( | ||||||||||||||
| Proceeds from sales of equity investments | |||||||||||||||||
| Purchases of equity investments | ( | ( | ( | ||||||||||||||
| Proceeds from sales of other investments | |||||||||||||||||
| Purchases of other investments | ( | ( | ( | ||||||||||||||
| Purchases of investments in other ventures | ( | ( | ( | ||||||||||||||
| Return of investments in other ventures | |||||||||||||||||
Net settlements of derivatives | ( | ( | |||||||||||||||
| Net purchase of Validus | ( | ||||||||||||||||
| Net cash provided by (used in) investing activities | ( | ( | ( | ||||||||||||||
| Cash flows provided by (used in) financing activities | |||||||||||||||||
| Dividends paid – RenaissanceRe common shares | ( | ( | ( | ||||||||||||||
| Dividends paid – preference shares | ( | ( | ( | ||||||||||||||
| RenaissanceRe common share repurchases | ( | ( | |||||||||||||||
| RenaissanceRe common share issuance, net of expenses | |||||||||||||||||
| Repayment of debt | ( | ( | ( | ||||||||||||||
| Issuance of debt, net of expenses | |||||||||||||||||
| Repayment of Medici Revolving Credit Facility | ( | ( | |||||||||||||||
| Drawdown of Medici Revolving Credit Facility | |||||||||||||||||
| Subscriptions of third-party redeemable noncontrolling interest shares | |||||||||||||||||
| Redemptions of third-party redeemable noncontrolling interest shares | ( | ( | ( | ||||||||||||||
| Taxes paid on withholding shares | ( | ( | ( | ||||||||||||||
| Net cash provided by (used in) financing activities | ( | ( | |||||||||||||||
| Effect of exchange rate changes on foreign currency cash | ( | ( | |||||||||||||||
| Net increase (decrease) in cash and cash equivalents | ( | ||||||||||||||||
| Cash and cash equivalents, beginning of year | |||||||||||||||||
| Cash and cash equivalents, end of year | $ | $ | $ | ||||||||||||||
| Supplemental disclosure of cash flow information | |||||||||||||||||
| Interest paid | $ | $ | $ | ||||||||||||||
Non-cash consideration (1) | $ | $ | $ | ||||||||||||||
(1)Represents the non-cash component of the total Validus Acquisition consideration. Refer to “Note 3. Acquisition of Validus” for additional information related to the Validus Acquisition.
See accompanying notes to the consolidated financial statements
F-9
RENAISSANCERE HOLDINGS LTD. AND SUBSIDIARIES
NOTES TO THE CONSOLIDATED FINANCIAL STATEMENTS
December 31, 2025
(unless otherwise noted, amounts in tables expressed in thousands of United States (“U.S.”) dollars, except shares, per share amounts and percentages)
NOTE 1. ORGANIZATION
RenaissanceRe Holdings Ltd. (“RenaissanceRe” or the “Company”) was formed under the laws of Bermuda on June 7, 1993. Through its wholly owned and majority-owned subsidiaries, joint ventures and managed funds, the Company provides property, casualty and specialty reinsurance and certain insurance solutions to its customers.
These consolidated financial statements include the results of the Company, its subsidiaries, and all variable interest entities in which the Company is considered to be the primary beneficiary.
NOTE 2. SIGNIFICANT ACCOUNTING POLICIES
Basis Of Presentation
These consolidated financial statements have been prepared on the basis of accounting principles generally accepted in the United States (“GAAP”). All significant intercompany accounts and transactions have been eliminated from these statements.
Certain comparative information has been reclassified to conform to the current presentation.
Use Of Estimates In Financial Statements
The preparation of consolidated financial statements in conformity with GAAP requires management to make estimates and assumptions that affect the reported and disclosed amounts of assets and liabilities and disclosure of contingent assets and liabilities at the date of the consolidated financial statements and the reported amounts of revenues and expenses during the reporting period. Actual results could differ materially from those estimates. The major estimates reflected in the Company’s consolidated financial statements include, but are not limited to, the reserve for claims and claim expenses; reinsurance recoverable and premiums receivable, including provisions for reinsurance recoverable and premiums receivable to reflect expected credit losses; estimates of written and earned premiums; fair value, including the fair value of investments, financial instruments and derivatives; impairment charges; deferred acquisition costs, the value of business acquired (“VOBA”) and the fair value of other assets acquired and liabilities assumed in acquisitions; and the Company’s deferred tax valuation allowance.
Premiums and Related Expenses
Premiums are recognized as income, net of any applicable reinsurance or retrocessional coverage purchased, over the terms of the related contracts and policies. Premiums written are based on contract and policy terms and include estimates based on information received from both insureds and ceding companies. Subsequent revisions to premium estimates are recorded in the period in which they are determined. Unearned premiums represent the portion of premiums written that relate to the unexpired terms of contracts and policies in force. Amounts are computed by pro rata methods based on statistical data or reports received from ceding companies. Reinstatement premiums are estimated after the occurrence of a significant loss and are recorded in accordance with the contract terms. Reinstatement premiums are earned when written.
Acquisition costs are incurred when a contract or policy is issued and only the costs directly related to the successful acquisition of new and renewal contract or policies are deferred and amortized over the same period in which the related premiums are earned. Acquisition costs consist principally of commissions, brokerage and premium tax expenses and are shown net of commissions earned on ceded reinsurance. Certain of the Company’s assumed contracts contain profit sharing provisions or adjustable commissions that are estimated based on the expected loss and loss adjustment expense on those contracts. Acquisition costs include accruals for such estimates of commissions. Certain of the Company’s ceded contracts
F-10
contain profit sharing provisions which accrue to the benefit of the Company. Acquisition costs are shown net of such commissions and profit commissions earned on ceded reinsurance. In addition, certain of the Company’s ceded contracts contain override and management fees which are recorded as an offset against operational expenses. Deferred policy acquisition costs are limited to their estimated realizable value based on the related unearned premiums. Anticipated claims and claim expenses, based on historical and current experience, and anticipated investment income related to those premiums are considered in determining the recoverability of deferred acquisition costs.
Claims and Claim Expenses
The reserve for claims and claim expenses includes estimates for unpaid claims and claim expenses on reported losses as well as an estimate of losses incurred but not reported. The reserve is based on individual claims, case reserves and other reserve estimates reported by insureds and ceding companies as well as management estimates of ultimate losses. Inherent in the estimates of ultimate losses are expected trends in claim severity and frequency and other factors which could vary significantly as claims are settled.
Ultimate losses may vary materially from the amounts provided in the consolidated financial statements. These estimates are reviewed regularly and, as experience develops and new information becomes known, the reserves are adjusted as necessary. Such adjustments, if any, are reflected in the consolidated statements of operations in the period in which they become known and are accounted for as changes in estimates.
Reinsurance
Amounts recoverable from reinsurers are estimated in a manner consistent with the claims and claim expense reserves associated with the related assumed (re)insurance. For multi-year retrospectively rated contracts, the Company accrues amounts (either assets or liabilities) that are due to or from retrocessionaires based on estimated contract experience. If the Company determines that adjustments to earlier estimates are appropriate, such adjustments are recorded in the period in which they are determined. Reinsurance recoverable on dual trigger reinsurance contracts require the Company to estimate its ultimate losses applicable to these contracts as well as estimate the ultimate amount of insured industry losses that will be reported by the applicable statistical reporting agency, as per the contract terms. Amounts recoverable from reinsurers are recorded net of a provision for current expected credit losses to reflect expected credit losses.
Assumed and ceded reinsurance contracts that lack significant transfer of risk are treated as deposits.
Investments
Fixed Maturity Investments
Investments in fixed maturities are classified as trading and are reported at fair value. Investment transactions are recorded on the trade date with balances pending settlement reflected in the balance sheet as a receivable for investments sold or a payable for investments purchased. Net investment income includes interest and dividend income together with amortization of market premiums and discounts and is net of investment management and custody fees. The amortization of premium and accretion of discount for fixed maturity securities is computed using the effective yield method. For mortgage-backed securities and other holdings for which there is prepayment risk, prepayment assumptions are evaluated quarterly and revised as necessary. Any adjustments required due to the change in effective yields and maturities are recognized on a prospective basis through yield adjustments. Fair values of investments are based on quoted market prices, or when such prices are not available, by reference to broker or underwriter bid indications and/or internal pricing valuation techniques. The net unrealized appreciation or depreciation on fixed maturity investments trading is included in net realized and unrealized gains (losses) on investments in the consolidated statements of operations. Realized gains or losses on the sale of investments are determined on the basis of the first in first out cost method.
F-11
Short Term Investments
Short term investments, which are managed as part of the Company’s investment portfolio and have a maturity of one year or less when purchased, are carried at fair value. The net unrealized appreciation or depreciation on short term investments is included in net realized and unrealized gains (losses) on investments in the consolidated statements of operations.
Equity Investments
Equity investments are accounted for at fair value in accordance with FASB ASC Topic 825, Financial Instruments. Fair values are primarily priced by pricing services, reflecting the closing price quoted for the final trading day of the period. Dividend income is included in net investment income and net realized and unrealized appreciation or depreciation on equity investments is included in net realized and unrealized gains (losses) on investments in the consolidated statements of operations.
Other Investments
The Company accounts for its other investments at fair value in accordance with FASB ASC Topic 825, Financial Instruments with interest and dividend income included in net investment income. Realized and unrealized gains and losses on other investments are included in net realized and unrealized gains (losses) on investments. The fair value of the Company’s fund investments, which include private equity funds, private credit funds, hedge funds and insurance-linked securities funds, is generally established on the basis of the net asset value (“NAV”) per share (or its equivalent) established by each respective fund investments manager, if applicable. The net asset value established by the respective fund investments manager is determined in accordance with the governing documents of such fund investments. The Company applies the practical expedient provided by the FASB ASC Topic 825, Financial Instruments relating to investments in certain entities that calculate NAV per share (or its equivalent) and therefore measure the fair value of the fund investments based on that NAV per share, or its equivalent. Fund investments are recorded on the consolidated balance sheets in other investments. Fund investments which are valued using NAV per share as a practical expedient are not categorized within the fair value hierarchy.
Certain of the Company’s fund investment managers, or their fund administrators, are unable to provide final fund valuations as of the Company’s current reporting date. The Company typically experiences a reporting lag to receive a final net asset value report of up to one month for hedge funds and insurance-linked securities funds, and three months for both private equity funds and private credit funds, although the Company has occasionally experienced delays of up to six months, particularly at year end.
In circumstances where there is a reporting lag between the current period end reporting date and the reporting date of the latest fund valuation, the Company estimates the fair value of these funds by starting with the prior month or quarter-end fund valuations, adjusting these valuations for actual capital calls, redemptions or distributions, as well as the impact of changes in foreign currency exchange rates, and then estimating the return for the current period. In circumstances in which the Company estimates the return for the current period, all information available to the Company is utilized. This principally includes using preliminary estimates reported to the Company by its fund managers, where available, and estimating returns based on the performance of broad market indices or other valuation methods. Actual final fund valuations may differ, perhaps materially so, from the Company’s estimates and these differences are recorded in the Company’s statement of operations in the period in which they are reported to the Company as a change in estimate.
The Company’s other investments also include investments in catastrophe bonds, direct private equity investments and term loans which are recorded at fair value. The fair value of catastrophe bonds is based on broker or underwriter bid indications. The fair value of direct private equity investments is based on quoted prices for similar assets, where available, or on the use of internal valuation models.
Investments in Other Ventures, Under Equity Method
Investments in which the Company has significant influence over the operating and financial policies of the investee are classified as investments in other ventures, under equity method, and are accounted for under the equity method of accounting. Under this method, the Company records its proportionate share of
F-12
Cash and Cash Equivalents
Cash equivalents include money market instruments with a maturity of ninety days or less when purchased.
Stock Incentive Compensation
The Company is authorized to issue restricted stock awards and units, performance shares, stock options and other equity-based awards to its employees and directors. The fair value of the compensation cost is measured at the grant date and expensed over the period for which the employee or director is required to provide services in exchange for the award.
The Company has elected to recognize forfeitures as they occur rather than estimating service-based forfeitures over the requisite service period.
Derivatives
From time to time, the Company enters into derivative instruments such as futures, options, swaps, forward contracts and other derivative contracts primarily to manage its foreign currency exposure, obtain exposure to a particular financial market, or for trading and to assume or hedge risk. The Company accounts for its derivatives in accordance with FASB ASC Topic 815, Derivatives and Hedging, which requires all derivatives to be recorded at fair value on the Company’s balance sheet as either assets or liabilities, depending on their rights or obligations, with changes in fair value reflected in current earnings. The Company has adopted hedge accounting for certain of its derivative instruments used as hedges of a net investment in a foreign operation, as discussed below. The fair value of the Company’s derivatives is estimated by reference to quoted prices or broker quotes, where available, or in the absence of quoted prices or broker quotes, the use of industry or internal valuation models.
Hedges of a Net Investment in a Foreign Operation
Changes in the fair value of derivative instruments used to hedge the net investment in a foreign operation, to the extent effective as a hedge, are recorded as a component of accumulated other comprehensive income (loss) in foreign currency translation adjustments, net of tax. Cumulative changes in fair value recorded in accumulated other comprehensive income (loss) are reclassified into earnings upon the sale, or complete or substantially complete liquidation, of the foreign operation. Any hedge ineffectiveness is recorded immediately in current period earnings as net foreign exchange gains (losses).
Hedge Documentation and Effectiveness Testing
To qualify for hedge accounting treatment, a derivative must be highly effective in mitigating the designated changes in value or cash flow of the hedged item. At the inception of a hedge, the Company formally documents relationships between hedging instruments and hedged items, as well as its risk management objective and strategy for undertaking each hedge transaction. The documentation process includes linking derivatives that are designated as net investment hedges to specific assets or liabilities on the consolidated balance sheets. The Company also formally assesses, both at the hedge’s inception and on an ongoing basis, whether the derivatives that are used in hedging transactions are highly effective in offsetting changes in the net investment in a foreign operation. The Company will discontinue hedge accounting prospectively if it determines that the derivative is no longer highly effective in offsetting changes in the net investment in a foreign operation, the derivative is no longer designated as a hedging instrument, or the
F-13
derivative expires or is sold, terminated or exercised. If hedge accounting is discontinued, the derivative continues to be carried at fair value on the consolidated balance sheets with changes in its fair value recognized in current period earnings through net realized and unrealized gains (losses) on investments.
Fair Value Option
The Company has elected to account for certain of its assets and liabilities at fair value in accordance with FASB ASC Topic 820, Fair Value Measurement. The Company recognizes the change in unrealized gains and losses arising from changes in fair value in its statements of operations.
Business Combinations, Goodwill and Other Intangible Assets
Goodwill and other intangible assets are tested for impairment on an annual basis or more frequently if events or changes in circumstances indicate that the carrying amount may not be recoverable. For purposes of the annual impairment evaluation, goodwill is assigned to the applicable reporting unit of the acquired entities giving rise to the goodwill. Goodwill and other intangible assets recorded in connection with investments accounted for under the equity method, are recorded as investments in other ventures, under equity method on the Company’s consolidated balance sheets.
The Company has established the second half of the year as the period for performing its annual impairment tests. The Company may determine to perform additional impairment testing at other times in the year if it is deemed necessary. The Company has elected to use the option to first assess qualitative factors to determine whether it is necessary to perform the quantitative goodwill impairment test. Under this option, the Company is not required to calculate the fair value of a reporting unit unless the Company determines, based on its qualitative assessment, that it is more likely than not that a reporting unit’s fair value is less than its carrying amount. If goodwill or other intangible assets are impaired, they are written down to their estimated fair value with a corresponding expense reflected in the Company’s consolidated statements of operations.
Noncontrolling Interests
The Company accounts for redeemable noncontrolling interests in the mezzanine section of the Company’s consolidated balance sheets in accordance with United States Securities and Exchange Commission (“SEC”) guidance which is applicable to SEC registrants. The share classes related to the redeemable noncontrolling interest portion of the issuer are accounted for in accordance with SEC guidance, which requires that shares not required to be accounted for in accordance with FASB ASC Topic 480, Distinguishing Liabilities from Equity, and having redemption features that are not solely within the control of the issuer, to be classified outside of permanent equity in the mezzanine section of the balance sheet. The SEC guidance does not impact the accounting for redeemable noncontrolling interest on the consolidated statements of operations; therefore, the provisions of FASB ASC Topic 810, Consolidation with respect to the consolidated statements of operations still apply, and net (income) loss attributable to redeemable noncontrolling interests is presented separately in the Company’s consolidated statements of operations.
Variable Interest Entities
The Company accounts for variable interest entities (“VIEs”) in accordance with FASB ASC Topic 810, Consolidation, which requires the consolidation of all VIEs by the primary beneficiary, that being the investor that has the power to direct the activities of the VIE and that will absorb a portion of the VIE’s expected losses or residual returns that could potentially be significant to the VIE. When the Company determines it has a variable interest in a VIE, it determines whether it is the primary beneficiary of that VIE by performing
F-14
an analysis that principally considers: (i) the VIE’s purpose and design, including the risks the VIE was designed to create and pass through to its variable interest holders; (ii) the VIE’s capital structure; (iii) the terms between the VIE and its variable interest holders and other parties involved with the VIE; (iv) which variable interest holders have the power to direct the activities of the VIE that most significantly impact the VIE’s economic performance; (v) which variable interest holders have the obligation to absorb losses or the right to receive benefits from the VIE that could potentially be significant to the VIE; and (vi) related party relationships. The Company reassesses its determination of whether the Company is the primary beneficiary of a VIE upon changes in facts and circumstances that could potentially alter the Company’s assessment.
Earnings Per Share
The Company calculates earnings per share in accordance with FASB ASC Topic 260, Earnings per Share. Basic earnings per share are based on weighted average common shares and exclude any dilutive effects of restricted stock. Diluted earnings per share assumes the exercise of all dilutive restricted stock grants.
The two-class method is used to determine earnings per share based on dividends declared on common shares and participating securities (i.e., distributed earnings) and participation rights of participating securities in any undistributed earnings. Each unvested restricted share granted by the Company is considered a participating security and the Company uses the two-class method to calculate its net income (loss) available (attributable) to RenaissanceRe common shareholders per common share – basic and diluted.
Foreign Exchange
Monetary assets and liabilities denominated in a currency other than the functional currency of the Company’s subsidiaries in which those monetary assets and liabilities reside are revalued into such subsidiary’s functional currency at the prevailing exchange rate on the balance sheet date. Revenues and expenses denominated in a currency other than the functional currency of the Company’s subsidiaries, are valued at the exchange rate on the date on which the underlying revenue or expense transaction occurred. The net effect of these revaluation adjustments are recognized in the Company’s consolidated statements of operations as part of net foreign exchange gains (losses).
The Company’s functional currency is the U.S. dollar. One of the Company’s subsidiaries has a functional currency other than the U.S. dollar. Assets and liabilities of the foreign operation whose functional currency is not the U.S. dollar are translated into the Company’s U.S. dollar reporting currency at prevailing balance sheet-date exchange rates, while revenue and expenses of such foreign operation are translated into the Company’s U.S. dollar functional currency at monthly average exchange rates during the year. The net effect of these translation adjustments, as well as any gains or losses on intercompany balances for which settlement is not planned or anticipated in the foreseeable future, net of applicable deferred income taxes, is included in the Company’s consolidated balance sheets as currency translation adjustments and reflected within accumulated other comprehensive income (loss).
Taxation
Uncertain tax positions are also accounted for in accordance with FASB ASC Topic 740, Income Taxes. Uncertain tax positions must meet a more likely than not recognition threshold to be recognized.
F-15
Government Grants
The Company has or will claim substance-based government grants and refundable tax credits it is eligible for in Bermuda, Ireland, and Canada. These government grants and refundable tax credits are generally based on a percentage of eligible expenditures related to compensation costs, other operating expenses and corporate expenses. The Company recognizes the benefit of government grants and refundable tax credits as reductions to the related expenses in the consolidated statement of operations in the period it is probable the conditions for receiving the grant or refundable tax credit will be satisfied.
Recently Adopted Accounting Pronouncements
Improvements to Income Tax Disclosures
In December 2023, the FASB issued ASU No. 2023-09, Improvements to Income Tax Disclosures (“ASU 2023-09”). Among other things, ASU 2023-09 addresses investor requests for more transparency about income tax information through improvements to income tax disclosures primarily related to the rate reconciliation and income taxes paid information. The amendments in ASU 2023-09 are effective for public business entities for annual periods beginning after December 15, 2024. The amendments in ASU 2023-09 should be applied on a prospective basis, with the option to apply retrospectively. The Company adopted ASU 2023-09 for the annual reporting period beginning on January 1, 2025 on a prospective basis. The adoption of ASU 2023-09 did not have a material impact on the Company’s consolidated financial statements.
Recently Issued Accounting Pronouncements Not Yet Adopted
Disaggregation of Income Statement Expenses
In November 2024, the FASB issued ASU No. 2024-03, Disaggregation of Income Statement Expenses (“ASU 2024-03”). Among other things, ASU 2024-03 addresses investor requests for more detailed information about the types of expenses (including purchases of inventory, employee compensation, depreciation, amortization and depletion) in commonly presented expense captions (such as cost of sales; selling, general and administrative expenses and research and development). The amendments in ASU 2024-03 are effective for public business entities for annual reporting periods beginning after December 15, 2026, and interim reporting periods within annual reporting periods beginning after December 15, 2027. Early adoption is permitted. The Company is currently evaluating the impact of this guidance.
Government Grants
In December 2025, the FASB issued ASU No. 2025-10, Accounting for Government Grants Received by Business Entities (“ASU 2025-10”). ASU 2025-10 establishes authoritative guidance for recognition, measurement and presentation of government grants. The amendments in ASU 2025-10 are effective for public business entities for annual reporting periods beginning after December 15, 2028, and interim periods within those annual reporting periods. Early adoption is permitted. The Company is currently evaluating the impact of this guidance.
F-16
NOTE 3. ACQUISITION OF VALIDUS
On November 1, 2023, the Company completed its acquisition in accordance with the Stock Purchase Agreement, dated May 22, 2023 (as amended, the “Stock Purchase Agreement”), between RenaissanceRe and American International Group, Inc., (“AIG”), pursuant to which, upon the terms and subject to the conditions thereof, RenaissanceRe, or one of its subsidiaries, purchased, acquired and accepted from certain subsidiaries of AIG, all of their right, title and interest in the shares of Validus Holdings, Ltd. (“Validus Holdings”), and Validus Specialty, LLC (“Validus Specialty”). Substantially all of the assets of Validus Holdings was comprised of its equity interest in its wholly-owned subsidiary, Validus Reinsurance, Ltd. (“Validus Re”). The Company also acquired the renewal rights, records and customer relationships of the assumed treaty reinsurance business of Talbot Underwriting Limited, an affiliate of AIG (“Talbot”), a specialty (re)insurance group operating within the Lloyd’s market. The acquisitions under the Stock Purchase Agreement, together with the other transactions contemplated in the Stock Purchase Agreement, are referred to herein as the “Validus Acquisition.” Validus Holdings, Validus Specialty, and their respective subsidiaries that were acquired in the Validus Acquisition (including Validus Re and Validus Holdings (UK) Ltd) collectively are referred to herein as “Validus.” Pursuant to the Validus Acquisition, the Company acquired 100 % voting equity interest in each of Validus Holdings and Validus Specialty.
In connection with the Validus Acquisition, on November 1, 2023, the Company paid to AIG aggregate consideration of $2.985 billion, consisting of the following: (i) cash consideration of $2.735 billion; and (ii) 1,322,541 common shares, which were valued at approximately $250.0 million based on a value of $189.03 per share at signing, pursuant to the Stock Purchase Agreement. The value of the acquisition consideration was $3.020 billion as of the closing date. The parties determined that no post-closing adjustment was required to the value of the acquisition consideration as of the closing date.
In connection with the closing of the Validus Acquisition, the Company entered into a reserve development cover whereby the Validus risk-bearing entities agreed to cede to AIG substantially all of their adverse or favorable development on stated reserves at the time of the closing, subject to certain terms and conditions. Under the reserve development agreement AIG assumes substantially all of any favorable or adverse development on the stated reserves, on a whole-account basis, and takes into consideration adverse or favorable performance across the Company’s reportable segments. To the extent the combined performance of the acquired reserve for claims and claim expenses is worse than expected on an aggregate basis across reportable segments, the Company is indemnified under the terms of the reserve development agreement and would expect to collect substantially all of the adverse development under the reserve development agreement. To the extent the combined performance of the acquired reserve for claims and claim expenses is better than expected on an aggregate basis across reportable segments, the Company would expect to pay substantially all of the favorable development to AIG under the reserve development agreement.
The Company recorded $5.4 million of corporate expenses associated with the acquisition of Validus during 2025 (2024 - $61.9 million). Included in these expenses are compensation, transaction and integration-related costs.
F-17
Acquisition Consideration
The Company’s total consideration for Validus was calculated as follows:
| RenaissanceRe Common Shares | |||||||||||||||||
| Common shares issued by RenaissanceRe to AIG | |||||||||||||||||
Common share price of RenaissanceRe (1) | $ | ||||||||||||||||
| Market value of RenaissanceRe common shares issued by RenaissanceRe to AIG | $ | ||||||||||||||||
| Cash Consideration | |||||||||||||||||
| Cash consideration funded by net proceeds from the issuance of common shares of RenaissanceRe to the public market | $ | ||||||||||||||||
| Cash consideration funded by net proceeds from the issuance of Senior Notes | |||||||||||||||||
| Cash consideration funded by available cash resources | |||||||||||||||||
| Total cash consideration paid by RenaissanceRe as acquisition consideration | |||||||||||||||||
Total purchase price | $ | ||||||||||||||||
(1) The common share price of RenaissanceRe is based on the closing price of $226.97 per RenaissanceRe common share on the closing date of the Validus Acquisition, November 1, 2023 with a 5 % discount to reflect restrictions on the transfer of those shares.
Fair Value of Net Assets Acquired and Liabilities Assumed
The purchase price was allocated to the acquired assets and liabilities of the Company based on estimated fair values on November 1, 2023, the date the transaction closed, as detailed in the table below:
| Assets: | ||||||||||||||
Cash and cash equivalents | $ | |||||||||||||
Investments trading | ||||||||||||||
Short term investments | ||||||||||||||
Investments in other ventures, under equity method | ||||||||||||||
Reinsurance premiums receivable | ||||||||||||||
Prepaid reinsurance premiums | ||||||||||||||
Losses recoverable (1) | ||||||||||||||
Accrued investment income | ||||||||||||||
Deferred acquisition costs and value of business acquired | ||||||||||||||
Other assets | ||||||||||||||
Identifiable intangible assets | ||||||||||||||
Total assets | ||||||||||||||
| Liabilities: | ||||||||||||||
Reserve for claims and claim expenses (1) | ||||||||||||||
| Reserve for unearned premiums | ||||||||||||||
Reinsurance balances payable | ||||||||||||||
Accounts payable and accrued liabilities | ||||||||||||||
Deferred tax liability | ||||||||||||||
Total liabilities | ||||||||||||||
| Total identifiable net assets acquired | ||||||||||||||
| Total purchase price | ||||||||||||||
Goodwill | $ | |||||||||||||
F-18
The significant fair value adjustments and related future amortization are as follows:
•Deferred acquisition costs and VOBA - to reflect the elimination of Validus’ net deferred acquisition costs, and the establishment of the value of business acquired asset, which represents the present value of the expected underwriting profit within the unearned premiums liability, net of reinsurance, less costs to service the related policies and a risk premium. The fair value of VOBA was determined after taking into consideration certain key assumptions, including the estimated cost of capital, investment yield, loss ratio and related expenses. The adjustment for VOBA will be amortized to acquisition expenses over approximately two years, as the contracts for business in-force as of the acquisition date expire;
•Net reserve for claims and claim expenses - to reflect a decrease related to the present value of the net unpaid claims and claim expenses based on the estimated payout pattern, partially offset by an increase in net claims and claim expenses related to the estimated market based risk margin. The risk margin represents the estimated cost of capital required by a market participant to assume the net claims and claim expenses. The fair value of net reserve for claims and claim expenses was determined using certain key assumptions, including the estimated cost of capital and investment yield. This will be amortized using the projected discount and risk margin patterns of the net claims and claim expenses as of the acquisition date;
•Identifiable indefinite lived and finite lived intangible assets - to establish the fair value of identifiable intangible assets related to the acquisition of Validus described in detail below; and
•Deferred tax liability - to reflect the net deferred tax liability on the intangible assets and the other fair value adjustments.
Identifiable indefinite lived and finite lived intangible assets consisted of the following and are included in goodwill and other intangible assets on the Company’s consolidated balance sheet:
| Amount | Economic Useful Life | ||||||||||||||||
Agent relationships - top four | $ | ||||||||||||||||
Agent relationships - other | |||||||||||||||||
Managing General Agent (“MGA”) relationships | |||||||||||||||||
Trade name | |||||||||||||||||
| Renewal rights | |||||||||||||||||
Asset management contracts | |||||||||||||||||
Insurance licenses | Indefinite | ||||||||||||||||
Gross identifiable intangible assets related to the acquisition of Validus, at November 1, 2023 | |||||||||||||||||
Accumulated amortization (from November 1, 2023 through December 31, 2025), net of foreign exchange | |||||||||||||||||
| Impairment loss on insurance licenses | |||||||||||||||||
Net identifiable intangible assets related to the acquisition of Validus at December 31, 2025 | $ | ||||||||||||||||
Amortization from the acquisition date, November 1, 2023, through December 31, 2023 was included in the Company’s consolidated statements of operations for 2023.
An explanation of the identifiable indefinite and finite intangible assets is as follows:
•Agent relationships – top four – the value of Validus’ relationships with their top four brokers (Marsh & McLennan Companies, Inc., Aon Benfield Group Ltd., Willis Towers Watson Plc and Arthur J. Gallagher & Co.) after taking into consideration certain key assumptions, including the estimated cost of capital, investment yield, loss ratio, related expenses, effective tax rates and capital charges. These will be amortized based on an economic benefit pattern over its useful life as of the acquisition date, the majority of which is expected to be within the first 10 years;
F-19
•Renewal rights – the value of policy renewal rights was determined after taking into consideration certain key assumptions, including the estimated cost of capital, investment yield, loss ratio, related expenses, effective tax rates and capital charges that would impact the expected cash flows from these renewals over the expected life of these policies. These will be amortized based on an economic benefit pattern over its useful life as of the acquisition date, the majority of which is expected to be within the first 10 years; and
•Insurance licenses – the value of acquired insurance licenses.
Financial Results
The following table summarizes the unaudited net contribution from the acquisition of Validus since November 1, 2023 that was included in the Company’s consolidated statements of operations and comprehensive income (loss) for 2023. Operating activities of Validus from the acquisition date, November 1, 2023, through December 31, 2023 are included in the Company’s consolidated statements of operations and comprehensive income (loss) for 2023.
The unaudited net contribution of the acquisition and integration of Validus is provided for informational purposes only and is not necessarily, and should not be assumed to be, an indication of the results that may be achieved in the future. These results are not used as a part of management’s analysis of the financial performance of the Company’s business. These results primarily reflect items recorded directly by Validus from November 1, 2023 through December 31, 2023, including: 1) net premiums earned and net underwriting income on the in-force portfolio acquired with the acquisition of Validus and previously retained on Validus entities’ balance sheets; 2) net premiums earned and net underwriting income for those contracts which renewed post-acquisition on one of the acquired Validus entities’ balance sheets; 3) net investment income and net realized and unrealized gains recorded directly by Validus; and 4) certain direct costs incurred directly by Validus. In addition, these results, where possible, were adjusted for transaction and integration related costs incurred by the Company. However, these results do not reflect on-going operating costs incurred by the Company in supporting Validus unless such costs were incurred directly by Validus. These results also do not give consideration to the impact of possible revenue enhancements, expense efficiencies, synergies or asset dispositions that may be achieved in the future. These results involve significant estimates and are not indicative of the future results of the acquired Validus entities which have been, and will continue to be impacted by potential changes in targeted business mix, investment management strategies, and synergies recognized from changes in the combined entity’s operating structure, as well as the impact of changes in other business and capital management strategies.
Year ended December 31, 2023 (1) | |||||||||||
| Total revenues | $ | ||||||||||
| $ | |||||||||||
(1) Includes the net contribution from the acquisition of Validus since November 1, 2023 that was included in the Company’s consolidated statements of operations and comprehensive income (loss) through December 31, 2023.
(2) Includes $76.4 million of corporate expenses associated with the acquisition and integration of Validus for the year ended December 31, 2023.
Taxation
At the date of the acquisition the Company established a net deferred tax asset of $73.0 million and recorded a valuation allowance against Validus’ deferred tax assets of $66.0 million resulting in a net acquired deferred tax asset of $7.0 million. A net deferred tax liability of $46.2 million was also recorded related to the estimated fair value of intangible assets recorded, VOBA and other adjustments to the fair values of the assets acquired and liabilities assumed. This resulted in a net deferred tax liability of $39.2 million recorded in conjunction with the acquisition of Validus. The Company estimated that goodwill related to the acquisition of Validus Specialty of approximately $24 million will be deductible for U.S. tax purposes resulting in an estimated future tax benefit of approximately $5 million.
F-20
Supplemental Pro Forma Information
The following table presents unaudited pro forma consolidated financial information for the year ended December 31, 2023 and assumes the acquisition of Validus occurred on January 1, 2022. The unaudited pro forma consolidated financial information is provided for informational purposes only and is not necessarily, and should not be assumed to be, an indication of the results that would have been achieved had the transaction been completed as of January 1, 2022 or that may be achieved in the future. The unaudited pro forma consolidated financial information does not give consideration to the impact of possible revenue enhancements, expense efficiencies, synergies or asset dispositions that may result from the acquisition of Validus. In addition, unaudited pro forma consolidated financial information does not include the effects of costs associated with any restructuring or integration activities resulting from the acquisition of Validus, as they are nonrecurring.
| Year ended December 31, | 2023 | ||||||||||
| Total revenues | $ | ||||||||||
| Net income (loss) available (attributable) to RenaissanceRe common shareholders | $ | ||||||||||
Among other adjustments, and in addition to the fair value adjustments and recognition of goodwill, VOBA and identifiable intangible assets noted above, other material nonrecurring pro forma adjustments directly attributable to the acquisition of Validus principally included certain adjustments to recognize transaction related costs, align accounting policies, and amortize fair value adjustments, VOBA, and identifiable definite lived intangible assets, net of related tax impacts.
Defined Benefit Pension Plan
The Validus group entities have a contributory defined benefit pension plan for employees, which was not material to RenaissanceRe’s results of operations, financial condition or cash flows for 2025.
The plan offers mandatory benefits as prescribed by the applicable law, as well as voluntary benefits. These mandatory benefits include guarantees regarding the level of interest paid annually on accrued pension savings. The Validus group entities and the members of the plan contribute a defined percentage of salary to the pension arrangement and credit accumulation is granted on these contributions. At retirement, the accumulated contributions are converted into a pension. A full independent actuarial valuation is prepared annually.
At December 31, 2025, the net balance sheet liability was $1.0 million, comprising $12.5 million of projected benefit obligation and $11.5 million of plan assets at fair value (2024 - $1.6 million, $10.5 million, and $8.8 million, respectively).
NOTE 4. GOODWILL AND OTHER INTANGIBLE ASSETS
The following tables show an analysis of goodwill and other intangible assets, net of foreign currency translation adjustments, included in goodwill and other intangible assets on the Company’s consolidated balance sheets:
| Goodwill and Other Intangible Assets | |||||||||||||||||
At December 31, | 2025 | 2024 | |||||||||||||||
| Goodwill, net | $ | $ | |||||||||||||||
| Other intangible assets, net | |||||||||||||||||
| Total goodwill and other intangible assets | $ | $ | |||||||||||||||
Included in goodwill and other intangible assets on the Company’s consolidated balance sheet at December 31, 2025 was gross goodwill of $302.8 million (2024 - $302.8 million, 2023 - $302.8 million). Included in goodwill, net at December 31, 2025 was accumulated impairment losses of $2.3 million (2024 - $2.3 million).
F-21
In addition, the Company has also recorded goodwill and other intangible assets included in investments in other ventures, under equity method on the Company’s consolidated balance sheets:
| Goodwill and Other Intangible Assets Included in Investments in Other Ventures, Under Equity Method | |||||||||||||||||
At December 31, | 2025 | 2024 | |||||||||||||||
| Goodwill, net | $ | $ | |||||||||||||||
| Other intangible assets, net | |||||||||||||||||
| Total goodwill and other intangible assets | $ | $ | |||||||||||||||
Included in investments in other ventures, under equity method on the Company’s consolidated balance sheet at December 31, 2025 was gross goodwill of $13.2 million (2024 - $13.2 million, 2023 - $15.3 million). Included in gross goodwill and gross other intangible assets was a reduction of $2.1 million and $6.9 million, respectively, related to a change in the classification of the Company’s investment in TWFG, from investment in other ventures, under equity method to fair value, as a result of TWFG, Inc’s initial public offering in 2024. Included in goodwill, net at December 31, 2025, was accumulated impairment losses of $4.5 million (2024 - $4.5 million).
Goodwill
The following table shows a roll forward of goodwill included in goodwill and other intangible assets and goodwill included in investments in other ventures, under equity method on the Company’s consolidated balance sheets:
| Goodwill | |||||||||||||||||
| Goodwill and Other Intangible Assets | Investments in Other Ventures, Under Equity Method | ||||||||||||||||
Balance at December 31, 2023, net | $ | $ | |||||||||||||||
| Adjustments | ( | ||||||||||||||||
| Foreign currency translation | ( | ||||||||||||||||
Balance at December 31, 2024, net | |||||||||||||||||
| Foreign currency translation | |||||||||||||||||
Balance at December 31, 2025, net | $ | $ | |||||||||||||||
F-22
Other Intangible Assets
The gross carrying value, accumulated amortization and accumulated impairment losses by major category of other intangible assets included in goodwill and other intangible assets and investments in other ventures, under equity method on the Company’s consolidated balance sheets are shown below:
| Other Intangible Assets | |||||||||||||||||||||||||||||
| At December 31, 2025 | Gross Carrying Value | Accumulated Amortization | Accumulated Impairment Losses | Net | |||||||||||||||||||||||||
| Customer relationships and customer lists | $ | $ | ( | $ | ( | $ | |||||||||||||||||||||||
Licenses (1) | — | ( | |||||||||||||||||||||||||||
| Value of business acquired | ( | ||||||||||||||||||||||||||||
Asset management contracts | ( | ||||||||||||||||||||||||||||
| Software | ( | ||||||||||||||||||||||||||||
| Patents and intellectual property | ( | ( | |||||||||||||||||||||||||||
| Covenants not-to-compete | ( | ||||||||||||||||||||||||||||
| Trademarks and trade names | ( | ||||||||||||||||||||||||||||
| $ | $ | ( | $ | ( | $ | ||||||||||||||||||||||||
(1)Licenses is comprised of $10.4 million of indefinite lived other intangible assets, included in other intangible assets, net, as of December 31, 2025
| Other Intangible Assets | |||||||||||||||||||||||||||||
| At December 31, 2024 | Gross Carrying Value | Accumulated Amortization | Accumulated Impairment Losses | Net | |||||||||||||||||||||||||
| Customer relationships and customer lists | $ | $ | ( | $ | ( | $ | |||||||||||||||||||||||
Licenses (1) | — | ( | |||||||||||||||||||||||||||
| Value of business acquired | ( | ||||||||||||||||||||||||||||
Asset management contracts | ( | ||||||||||||||||||||||||||||
| Software | ( | ||||||||||||||||||||||||||||
| Patents and intellectual property | ( | ( | |||||||||||||||||||||||||||
| Covenants not-to-compete | ( | ||||||||||||||||||||||||||||
| Trademarks and trade names | ( | ||||||||||||||||||||||||||||
| $ | $ | ( | $ | ( | $ | ||||||||||||||||||||||||
(1)Licenses is comprised of $10.4 million of indefinite lived other intangible assets, included in other intangible assets, net, as of December 31, 2024
The Company recorded amortization expense of $71.1 million and an impairment loss of $57.6 million and $13.8 million, respectively).
In performing the impairment assessment, the Company first assessed qualitative factors to determine whether it was necessary to perform a quantitative impairment test. Based on its qualitative assessment, the Company determined it was not more likely than not that the fair value of the goodwill and other intangible assets in question were less than their respective carrying amounts. The qualitative assessment included the following factors which the Company determined had not significantly deteriorated given specific facts and circumstances: macroeconomic conditions; industry and market conditions; costs factors; and overall financial performance. Other than normal course amortization of intangible assets, in accordance with the Company’s established accounting policy, there were no adjustments to carried goodwill and other intangible assets during 2025.
During 2024, the Company amalgamated and merged certain Validus Re entities into the Company. As a result of management’s review and analysis, it was determined that certain licenses associated with these entities were either cancelled upon amalgamation or merger, or that there was no new business written using these licenses in 2024, and no new business would be incepting using these licenses on a go forward
F-23
basis. Accordingly, and in connection with the Company’s impairment testing performed, it was determined that certain licenses associated with these acquired Validus entities, which were initially reflected as indefinite lived intangible assets of $13.9 million at the time of the acquisition of Validus, should be written down to $intangible asset impairment charge of $13.8 million during 2024.
The remaining useful life of intangible assets with finite lives ranges from 1.83 years to 12.83 years, with a weighted-average amortization period of 11.89 years. Expected amortization of the other intangible assets, including other intangible assets recorded in investments in other ventures, under equity method, is shown below:
Other Intangible Assets | |||||||||||||||||||||||
| Other Intangibles Assets | Investments in Other Ventures, Under Equity Method | Total | |||||||||||||||||||||
| 2026 | $ | $ | $ | ||||||||||||||||||||
| 2027 | |||||||||||||||||||||||
| 2028 | |||||||||||||||||||||||
| 2029 | |||||||||||||||||||||||
| 2030 | |||||||||||||||||||||||
| 2031 and thereafter | |||||||||||||||||||||||
| Total remaining amortization expense | |||||||||||||||||||||||
| Indefinite lived | |||||||||||||||||||||||
| Total | $ | $ | $ | ||||||||||||||||||||
NOTE 5. INVESTMENTS
Fixed Maturity Investments Trading
The following table summarizes the fair value of fixed maturity investments trading:
| At December 31. | 2025 | 2024 | |||||||||||||||
| U.S. treasuries | $ | $ | |||||||||||||||
Corporate | |||||||||||||||||
| Residential mortgage-backed | |||||||||||||||||
| Asset-backed | |||||||||||||||||
| Non-U.S. government | |||||||||||||||||
| Agencies | |||||||||||||||||
| Commercial mortgage-backed | |||||||||||||||||
| Total fixed maturity investments trading | $ | $ | |||||||||||||||
F-24
Contractual maturities of fixed maturity investments trading are described in the following table. Expected maturities will differ from contractual maturities because borrowers may have the right to call or prepay obligations with or without call or prepayment penalties.
| At December 31, 2025 | At December 31, 2024 | ||||||||||||||||||||||||||||
| Amortized Cost | Fair Value | Amortized Cost | Fair Value | ||||||||||||||||||||||||||
Due in less than one year | $ | $ | $ | $ | |||||||||||||||||||||||||
Due after one through five years | |||||||||||||||||||||||||||||
Due after five through ten years | |||||||||||||||||||||||||||||
Due after ten years | |||||||||||||||||||||||||||||
Mortgage-backed | |||||||||||||||||||||||||||||
| Asset-backed | |||||||||||||||||||||||||||||
Total | $ | $ | $ | $ | |||||||||||||||||||||||||
Equity Investments
The following table summarizes the fair value of equity investments:
| At December 31. | 2025 | 2024 | |||||||||||||||
| Fixed income exchange traded funds | $ | $ | |||||||||||||||
Common stock (1) | |||||||||||||||||
| Financials | |||||||||||||||||
Other | |||||||||||||||||
Total common stock | |||||||||||||||||
Total equity investments | $ | $ | |||||||||||||||
(1)In 2025, the Company revised its presentation of equity investments to present all individual equity holdings as common stock. Comparative information for the prior periods presented have been updated to conform to the current presentation.
Pledged Investments
At December 31, 2025, $8.6 billion (2024 - $10.3 billion) of cash and investments at fair value were on deposit with, or in trust accounts for the benefit of, various counterparties, including with respect to the Company’s letter of credit facilities. Of this amount, $2.5 billion (2024 - $3.1 billion) is on deposit with, or in trust accounts for the benefit of, U.S. state regulatory authorities.
Reverse Repurchase Agreements
At December 31, 2025, the Company held $59.2 million (2024 - $169.4 million) of reverse repurchase agreements. These loans are fully collateralized, are generally outstanding for a short period of time and are presented on a gross basis as part of short term investments on the Company’s consolidated balance sheets. The required collateral for these loans typically includes high-quality, readily marketable instruments. Upon maturity, the Company receives principal and interest income.
F-25
Other Investments
The table below shows the fair value of the Company’s portfolio of other investments:
| At December 31, | 2025 | 2024 | |||||||||||||||
| Fund investments | |||||||||||||||||
Private credit funds | $ | $ | |||||||||||||||
Private equity funds | |||||||||||||||||
Hedge funds | |||||||||||||||||
Insurance-linked securities funds | |||||||||||||||||
Total fund investments | |||||||||||||||||
| Catastrophe bonds | |||||||||||||||||
| Direct private equity investments | |||||||||||||||||
| Total other investments | $ | $ | |||||||||||||||
Fund Investments
Fund investments are limited partnership or similar interests in private equity funds, private credit funds, hedge funds and insurance-linked securities funds managed by unrelated third parties.
Private Credit Funds
The Company’s investments in private credit funds include limited partnership or similar interests that invest in certain private credit asset classes, including U.S. direct lending funds, secondaries, mezzanine investments, distressed securities and senior secured bank loan funds. The Company generally has no right to redeem its interest in any of these private credit funds in advance of dissolution of the applicable limited partnerships. Instead, distributions are received by the Company in connection with the liquidation or maturity of the underlying private credit assets of the fund. It is estimated that the majority of the underlying assets of the limited partnerships would liquidate over 5 to 10 years from inception of the limited partnership.
Private Equity Funds
The Company’s investments in private equity funds include limited partnership or similar interests that invest in certain private equity asset classes, including U.S. and global leveraged buyouts. The Company generally has no right to redeem its interest in any of these private equity funds in advance of dissolution of the applicable limited partnerships. Instead, distributions are received by the Company in connection with the exit from the underlying private equity investments of the fund. It is estimated that the majority of the underlying assets of the limited partnerships would liquidate over 5 to 10 years from inception of the limited partnership.
Hedge Funds
The Company’s investments in hedge funds are primarily focused on global multi-strategy opportunities. These investments are generally redeemable at the option of the Company, at less than a month’s notice. Certain restrictions on redemptions, including initial lock-up periods or redemption gates, may also apply to the Company, as defined by each fund’s governing documents. Redemption gates allow the investment manager of a fund to defer part or all of a redemption request so as to not negatively impact the value of the redemption or the value of any interests that remain in the fund.
Insurance-Linked Securities Funds
Effective March 3, 2025, the Company made an investment in RenaissanceRe Medici UCITS Fund (“Medici UCITS”), a sub-fund of RenaissanceRe Medici ICAV, whose primary investment objective is to invest substantially all of its assets in global insurance-linked securities, specifically catastrophe bonds. Medici UCITS is considered a related party and the Company has elected to account for its investment at fair value, for consistency in reporting with its other fund investments. The Company can redeem from Medici
F-26
UCITS fortnightly with a minimum of four business days’ prior written notice, subject to certain redemption gates. The Company has no outstanding commitment to Medici UCITS.
During 2025, investors subscribed for $399.0 million of the participating shares of Medici UCITS, including $140.0 million from the Company. Of this amount, $316.5 million represented a transfer in kind from existing investors in RenaissanceRe Medici Fund Ltd. (“Medici”), including the Company. Net income from Medici UCITS attributable to the Company was $14.5 million in 2025. At December 31, 2025, the total net asset value of Medici UCITS was $449.9 million, of which $154.5 million was attributable to the Company, and the Company’s ownership in Medici UCITS was 34.3 %.
Limited Partnerships Entities
The Company’s fund investments are primarily variable interests in limited partnerships entities with unaffiliated fund managers in the normal course of business. The Company has also invested into some of the same limited partnerships through debt investments included within fixed maturities investments trading. The Company determined that certain of these interests represent investments in the VIEs and that it is not required to consolidate these investments because it is not the primary beneficiary of these VIEs. The Company’s maximum exposure to loss with respect to these VIEs is limited to the carrying amounts reported in the Company’s consolidated balance sheets and any unfunded commitment.
The following table summarizes the aggregate carrying amount of investments in unconsolidated VIEs on the Company’s consolidated balance sheets, as well as the Company’s maximum exposure to loss associated with these VIEs:
| Maximum Exposure to Loss | |||||||||||||||||||||||
Carrying Amount | Unfunded Commitments | Total | |||||||||||||||||||||
| At December 31, 2025 | $ | $ | $ | ||||||||||||||||||||
| At December 31, 2024 | $ | $ | $ | ||||||||||||||||||||
Catastrophe Bonds
Catastrophe bonds are non-investment grade bonds generally issued by unrelated third parties that generally mature within 1 to 5 years.
Direct Private Equity Investments
Direct private equity investments are the Company’s direct equity investments in companies that are not traded on any nationally recognized equity markets.
Investments in Other Ventures, under Equity Method
The table below shows the Company’s portfolio of investments in other ventures, under equity method:
| 2025 | 2024 | ||||||||||||||||||||||||||||
| At December 31, | Ownership % | Carrying Value | Ownership % | Carrying Value | |||||||||||||||||||||||||
Investments in other ventures, under equity method | $ | $ | |||||||||||||||||||||||||||
F-27
Net Investment Income
The components of net investment income are as follows:
| Year ended December 31, | 2025 | 2024 | 2023 | ||||||||||||||||||||
Fixed maturity investments trading | $ | $ | $ | ||||||||||||||||||||
| Short term investments | |||||||||||||||||||||||
| Equity investments | |||||||||||||||||||||||
Fixed income exchange traded funds | |||||||||||||||||||||||
Common stock (1) | |||||||||||||||||||||||
| Other investments | |||||||||||||||||||||||
| Catastrophe bonds | |||||||||||||||||||||||
Fund and direct private equity investments (2) | |||||||||||||||||||||||
| Cash and cash equivalents | |||||||||||||||||||||||
| Investment expenses | ( | ( | ( | ||||||||||||||||||||
| Net investment income | $ | $ | $ | ||||||||||||||||||||
(1)In 2025, the Company revised the description of its “other equity investments” to “common stock.”
(2)In 2025, the Company revised the description of its “other investments - other” to “other investments - fund and direct private equity investments.”
Equity in Earnings (Losses) of Other Ventures
The table below shows the Company’s equity in earnings (losses) of other ventures:
| Year ended December 31, | 2025 | 2024 | 2023 | ||||||||||||||||||||
Equity in earnings (losses) of other ventures | $ | $ | $ | ||||||||||||||||||||
During 2025, the Company received $53.2 million of distributions from its investments in other ventures, under equity method (2024 - $109.8 million, 2023 - $41.4 million). The equity in earnings (losses) of Top Layer Reinsurance Ltd. (“Top Layer”), a managed joint venture formed by the Company to write high excess non-U.S. property catastrophe reinsurance, is recorded on a current quarter basis. The equity in earnings (losses) of the Company’s investments in other ventures are reported one quarter in arrears.
Net Realized and Unrealized Gains (Losses) on Investments
Net realized and unrealized gains (losses) on investments are as follows:
| Year ended December 31, | 2025 | 2024 | 2023 | ||||||||||||||||||||
| Fixed maturity investments trading | $ | $ | ( | $ | |||||||||||||||||||
Investment-related derivatives (1) | ( | ( | |||||||||||||||||||||
| Equity investments | |||||||||||||||||||||||
| Other investments | |||||||||||||||||||||||
| Catastrophe bonds | ( | ||||||||||||||||||||||
Fund and direct private equity investments (2) | |||||||||||||||||||||||
| Net realized and unrealized gains (losses) on investments | $ | $ | ( | $ | |||||||||||||||||||
(1)Included in investment-related derivatives in 2025 are gains (losses) related to fixed maturity investment-related derivatives of $84.1 million (2024 - $(136.2 ) million, 2023 - $(67.0 ) million), equity investment-related derivatives of $138.9 million (2024 - $2.3 million, 2023 - $(1.9 ) million and commodity-related derivatives of $415.5 million (2024 - $76.5 million, 2023 - $0.7 million). Refer to “Note 19. Derivative Instruments” for additional information on investment-related derivatives.
(2)In 2025, the Company revised the description of its “other investments - other” to “other investments - fund and direct private equity investments.”
F-28
Net realized and unrealized gains (losses) on fixed maturity investments trading and equity investments, is split between realized and unrealized gains (losses) as follows:
| Year ended December 31, | 2025 | 2024 | 2023 | ||||||||||||||||||||
| Fixed maturity investments trading | |||||||||||||||||||||||
| Net realized gains (losses) | $ | $ | ( | $ | ( | ||||||||||||||||||
| Net unrealized gains (losses) | ( | ||||||||||||||||||||||
| Net realized and unrealized gains (losses) | $ | $ | ( | $ | |||||||||||||||||||
| Equity investments | |||||||||||||||||||||||
| Net realized gains (losses) | $ | $ | $ | ( | |||||||||||||||||||
| Net unrealized gains (losses) | |||||||||||||||||||||||
| Net realized and unrealized gains (losses) | $ | $ | $ | ||||||||||||||||||||
NOTE 6. FAIR VALUE MEASUREMENTS
The use of fair value to measure certain assets and liabilities with resulting unrealized gains or losses is pervasive within the Company’s consolidated financial statements. Fair value is defined as the price that would be received upon the sale of an asset or paid to transfer a liability in an orderly transaction between open market participants at the measurement date. The Company recognizes the change in unrealized gains or losses arising from changes in fair value in its consolidated statements of operations.
FASB ASC Topic 820, Fair Value Measurement prescribes a fair value hierarchy that prioritizes the inputs to the respective valuation techniques used to measure fair value. The hierarchy gives the highest priority to unadjusted quoted prices in active markets for identical assets or liabilities (Level 1) and the lowest priority to valuation techniques that use at least one significant input that is unobservable (Level 3). The three levels of the fair value hierarchy are described below:
•Fair values determined by Level 1 inputs utilize unadjusted quoted prices obtained from active markets for identical assets or liabilities for which the Company has access at the measurement date. The fair value is determined by multiplying the quoted price by the quantity held by the Company;
•Fair values determined by Level 2 inputs utilize inputs (other than quoted prices included in Level 1) that are observable for the asset or liability, either directly or indirectly. Level 2 inputs include quoted prices for similar assets and liabilities in active markets, and inputs other than quoted prices that are observable for the asset or liability, such as interest rates and yield curves that are observable at commonly quoted intervals, broker quotes and certain pricing indices; and
•Level 3 inputs are based all or in part on significant unobservable inputs for the asset or liability, and include situations where there is little, if any, market activity for the asset or liability. In these cases, significant management assumptions can be used to establish management’s best estimate of the assumptions used by other market participants in determining the fair value of the asset or liability.
In certain cases, the inputs used to measure fair value may fall into different levels of the fair value hierarchy. In such cases, the level in the fair value hierarchy within which the fair value measurement in its entirety falls has been determined based on the lowest level input that is significant to the fair value measurement of the asset or liability. The Company’s assessment of the significance of a particular input to the fair value measurement in its entirety requires judgment, and the Company considers factors specific to the asset or liability.
In order to determine if a market is active or inactive for a security, the Company considers a number of factors, including, but not limited to, the spread between what a seller is asking for a security and what a buyer is bidding for the same security, the volume of trading activity for the security in question, the price of the security compared to its par value (for fixed maturity investments), and other factors that may be indicative of market activity.
F-29
There have been no material changes in the Company’s valuation techniques, nor have there been any transfers between Level 1 and Level 2, or Level 2 and Level 3 during the period represented by these consolidated financial statements.
Below is a summary of the assets and liabilities that are measured at fair value on a recurring basis and also represents the carrying amount on the Company’s consolidated balance sheets:
| At December 31, 2025 | Total | Quoted Prices in Active Markets for Identical Assets (Level 1) | Significant Other Observable Inputs (Level 2) | Significant Unobservable Inputs (Level 3) | |||||||||||||||||||||||||
Fixed maturity investments trading | |||||||||||||||||||||||||||||
| U.S. treasuries | $ | $ | $ | $ | |||||||||||||||||||||||||
Corporate | |||||||||||||||||||||||||||||
| Residential mortgage-backed | |||||||||||||||||||||||||||||
| Asset-backed | |||||||||||||||||||||||||||||
| Non-U.S. government | |||||||||||||||||||||||||||||
| Agencies | |||||||||||||||||||||||||||||
| Commercial mortgage-backed | |||||||||||||||||||||||||||||
Total fixed maturity investments trading | |||||||||||||||||||||||||||||
| Short term investments | |||||||||||||||||||||||||||||
Equity investments | |||||||||||||||||||||||||||||
Fixed income exchange traded funds | |||||||||||||||||||||||||||||
Common stock (1) | |||||||||||||||||||||||||||||
Total equity investments | |||||||||||||||||||||||||||||
| Other investments | |||||||||||||||||||||||||||||
| Catastrophe bonds | |||||||||||||||||||||||||||||
| Direct private equity investments | |||||||||||||||||||||||||||||
Fund investments (2) | — | — | — | ||||||||||||||||||||||||||
| Total other investments | |||||||||||||||||||||||||||||
| Other assets and (liabilities) | |||||||||||||||||||||||||||||
Assumed and ceded (re)insurance contracts | ( | ( | |||||||||||||||||||||||||||
Derivative assets (3) | |||||||||||||||||||||||||||||
Derivative liabilities (3) | ( | ( | ( | ||||||||||||||||||||||||||
| Total other assets and (liabilities) | ( | ( | ( | ||||||||||||||||||||||||||
| $ | $ | $ | $ | ||||||||||||||||||||||||||
(1)In 2025, the Company revised the description of its “other equity investments” to “common stock.”
(2)Fund investments are measured at fair value using the NAV per share (or its equivalent) as a practical expedient and have not been classified in the fair value hierarchy. The fair value presented in this table is provided to permit reconciliation of the fair value hierarchy to the amounts presented in the consolidated balance sheet.
(3)Refer to “Note 19. Derivative Instruments” for additional information related to the fair value, by type of contract, of derivatives entered into by the Company.
F-30
| At December 31, 2024 | Total | Quoted Prices in Active Markets for Identical Assets (Level 1) | Significant Other Observable Inputs (Level 2) | Significant Unobservable Inputs (Level 3) | |||||||||||||||||||||||||
Fixed maturity investments trading | |||||||||||||||||||||||||||||
| U.S. treasuries | $ | $ | $ | $ | |||||||||||||||||||||||||
Corporate | |||||||||||||||||||||||||||||
| Residential mortgage-backed | |||||||||||||||||||||||||||||
| Asset-backed | |||||||||||||||||||||||||||||
| Agencies | |||||||||||||||||||||||||||||
| Non-U.S. government | |||||||||||||||||||||||||||||
| Commercial mortgage-backed | |||||||||||||||||||||||||||||
Total fixed maturity investments trading | |||||||||||||||||||||||||||||
| Short term investments | |||||||||||||||||||||||||||||
Equity investments | |||||||||||||||||||||||||||||
Common stock (1) | |||||||||||||||||||||||||||||
| Other investments | |||||||||||||||||||||||||||||
| Catastrophe bonds | |||||||||||||||||||||||||||||
| Direct private equity investments | |||||||||||||||||||||||||||||
Fund investments (2) | — | — | — | ||||||||||||||||||||||||||
| Total other investments | |||||||||||||||||||||||||||||
| Other assets and (liabilities) | |||||||||||||||||||||||||||||
Assumed and ceded (re)insurance contracts (3) | ( | ( | |||||||||||||||||||||||||||
Derivative assets (4) | |||||||||||||||||||||||||||||
Derivative liabilities (4) | ( | ( | ( | ||||||||||||||||||||||||||
| Total other assets and (liabilities) | ( | ( | ( | ||||||||||||||||||||||||||
| $ | $ | $ | $ | ||||||||||||||||||||||||||
(1)In 2025, the Company revised the description of its “other equity investments” to “common stock.”
(2)Fund investments are measured at fair value using the NAV per share (or its equivalent) as a practical expedient and have not been classified in the fair value hierarchy. The fair value presented in this table is provided to permit reconciliation of the fair value hierarchy to the amounts presented in the consolidated balance sheet.
(3)Included in assumed and ceded (re)insurance contracts at December 31, 2024 was $2.0 million of other assets and $2.4 million of other liabilities.
(4)Refer to “Note 19. Derivative Instruments” for additional information related to the fair value, by type of contract, of derivatives entered into by the Company.
Level 1 and Level 2 Assets and Liabilities Measured at Fair Value
Fixed Maturity Investments
Fixed maturity investments included in Level 1 consist of the Company’s investments in U.S. treasuries. Fixed maturity investments included in Level 2 are agencies, corporate (including non-U.S. government-backed corporate), non-U.S. government, residential mortgage-backed, commercial mortgage-backed and asset-backed.
The Company’s fixed maturity investments are primarily priced using pricing services, such as index providers and pricing vendors, as well as broker quotations. In general, the pricing vendors provide pricing for a high volume of liquid securities that are actively traded. For securities that do not trade on an exchange, the pricing services generally utilize market data and other observable inputs in matrix pricing models to determine month end prices. Observable inputs include benchmark yields, reported trades,
F-31
broker-dealer quotes, issuer spreads, bids, offers, reference data and industry and economic events. Index pricing generally relies on market traders as the primary source for pricing; however, models are also utilized to provide prices for all index eligible securities. The models use a variety of observable inputs such as benchmark yields, transactional data, dealer runs, broker-dealer quotes and corporate actions. Prices are generally verified using third-party data. Securities which are priced by an index provider are generally included in the index.
In general, broker-dealers value securities through their trading desks based on observable inputs. The methodologies include mapping securities based on trade data, bids or offers, observed spreads, and performance on newly issued securities. Broker-dealers also determine valuations by observing secondary trading of similar securities. Prices obtained from broker quotations are considered non-binding, however they are based on observable inputs and by observing secondary trading of similar securities obtained from active and non-distressed markets.
The Company considers these broker quotations to be Level 2 inputs as they are corroborated with other market observable inputs. The techniques generally used to determine the fair value of the Company’s fixed maturity investments are detailed below by asset class.
U.S. Treasuries
Level 1 - At December 31, 2025, the Company’s U.S. treasuries fixed maturity investments were primarily priced by pricing services. When pricing these securities, the pricing services utilize daily data from many real time market sources, including active broker-dealers. Certain data sources are regularly reviewed for accuracy to attempt to ensure the most reliable price source is used for each issue and maturity date.
Corporate
Level 2 - At December 31, 2025, the Company’s corporate fixed maturity investments principally consisted of U.S. and international corporations and non-U.S. government-backed corporations.
The Company’s corporate fixed maturity investments, other than non-U.S. government-backed corporations, are primarily priced by pricing services. When evaluating these securities, the pricing services gather information from market sources regarding the issuer of the security and obtain credit data, as well as other observations, from markets and sector news. Evaluations are updated by obtaining broker-dealer quotes and other market information including actual trade volumes, when available. The pricing services also consider the specific terms and conditions of the securities, including any specific features which may influence risk. In certain instances, securities are individually evaluated using a spread which is added to the U.S. treasury curve or a security specific swap curve as appropriate.
Non-U.S. government-backed corporate fixed maturity investments are primarily priced by pricing services that employ proprietary discounted cash flow models to value the securities. Key quantitative inputs for these models are daily observed benchmark curves for treasury, swap and high quality credits. The pricing services then apply a credit spread to the respective curve for each security which is developed by in-depth and real time market analysis. For securities in which trade volume is low, the pricing services utilize data from more frequently traded securities with similar attributes. These models may also be supplemented by daily market and credit research for international markets.
Agencies
Level 2 - At December 31, 2025, the Company’s agency fixed maturity investments primarily consist of the Federal National Mortgage Association, the Federal Home Loan Mortgage Corporation and other agencies. Fixed maturity investments included in agencies are primarily priced by pricing services. When evaluating these securities, the pricing services gather information from market sources and integrate other observations from markets and sector news. Evaluations are updated by obtaining broker-dealer quotes and other market information including actual trade volumes, when available. The fair value of each security is individually computed using analytical models which incorporate option adjusted spreads and other daily interest rate data.
F-32
Non-U.S. Government
Level 2 - At December 31, 2025, the Company’s non-U.S. government fixed maturity investments consisted of issuers of securities in this sector are non-U.S. governments and their respective agencies as well as supranational organizations. Securities held in these sectors are primarily priced by pricing services that employ proprietary discounted cash flow models to value the securities. Key quantitative inputs for these models are daily observed benchmark curves for treasury, swap and high issuance credits. The pricing services then apply a credit spread for each security which is developed by in-depth and real time market analysis. For securities in which trade volume is low, the pricing services utilize data from more frequently traded securities with similar attributes. These models may also be supplemented by daily market and credit research for international markets.
Residential Mortgage-backed
Level 2 - At December 31, 2025, the Company’s residential mortgage-backed fixed maturity investments include both agency and non-agency mortgage-backed securities. The Company’s agency mortgage-backed fixed maturity investments are primarily priced by pricing services using a mortgage pool specific model which utilizes daily inputs from the active to-be-announced market which is very liquid, as well as the U.S. treasury market. The model also utilizes additional information, such as the weighted average maturity, weighted average coupon and other available pool level data which is provided by the sponsoring agency. Valuations are also corroborated with active market quotes.
Non-agency mortgage-based securities are primarily priced by pricing services using an option adjusted spread model or other relevant models, which principally utilize inputs including benchmark yields, available trade information or broker quotes, and issuer spreads. The pricing services also review collateral prepayment speeds, loss severity and delinquencies among other collateral performance indicators for the securities valuation, when applicable.
Commercial Mortgage-backed
Level 2 - At December 31, 2025, the Company’s commercial mortgage-backed fixed maturity investments are primarily priced by pricing services. The pricing services apply dealer quotes and other available trade information such as bids and offers, prepayment speeds which may be adjusted for the underlying collateral or current price data, the U.S. treasury curve and swap curve as well as cash settlement. The pricing services discount the expected cash flows for each security held in this sector using a spread adjusted benchmark yield based on the characteristics of the security.
Asset-backed
Level 2 - At December 31, 2025, the Company’s asset-backed fixed maturity investments primarily consists of collateralized loan obligations and other receivables. Securities held in these sectors are primarily priced by pricing services. The pricing services apply dealer quotes and other available trade information such as bids and offers, prepayment speeds which may be adjusted for the underlying collateral or current price data, the U.S. treasury curve and swap curve as well as cash settlement. The pricing services determine the expected cash flows for each security held in this sector using historical prepayment and default projections for the underlying collateral and current market data. In addition, a spread is applied to the relevant benchmark and used to discount the cash flows noted above to determine the fair value of the securities held in this sector.
Short Term Investments
Level 1 - At December 31, 2025, the Company’s short term investments in U.S. treasuries were primarily priced by pricing services which utilize daily data from many real time market sources, including active broker-dealers. Certain data sources are regularly reviewed for accuracy to attempt to ensure the most reliable price source is used for each issue and maturity date.
Level 2 - At December 31, 2025, amortized cost approximates fair value for the majority of the remainder of the Company’s short term investments portfolio and, in certain cases, fair value is determined in a manner similar to the Company’s fixed maturity investments noted above.
F-33
Equity Investments
Level 1 - At December 31, 2025, the fair value of the Company’s portfolio of equity investments are primarily priced by pricing services, reflecting the closing price quoted for the final trading day of the period. When pricing these securities, the pricing services utilize daily data from many real time market sources, including applicable securities exchanges. All data sources are regularly reviewed for accuracy to attempt to ensure the most reliable price source was used for each security.
Other Investments
Catastrophe Bonds
Level 2 - At December 31, 2025. the Company’s other investments include investments in catastrophe bonds which are recorded at fair value based on broker or underwriter bid indications.
Direct Private Equity Investments
Level 2 - At December 31, 2025, the Company’s other investments included $157.0 million (2024 - $168.1 million) of direct private equity investments which are recorded at fair value based on quoted prices for similar assets.
Other Assets and Liabilities
Derivatives
Level 1 and Level 2 - Other assets and liabilities include certain derivatives entered into by the Company. The fair value of these transactions includes certain exchange traded futures and options contracts which are considered Level 1, and foreign currency contracts and certain credit derivatives, determined using standard industry valuation models and considered Level 2, as the inputs to the valuation model are based on observable market inputs. For credit derivatives, these inputs include credit spreads, credit ratings of the underlying referenced security, the risk-free rate and the contract term. For foreign currency contracts, these inputs include spot rates and interest rate curves.
Level 3 Assets and Liabilities Measured at Fair Value
Below is a summary of quantitative information regarding the significant unobservable inputs (Level 3) used in determining the fair value of assets and liabilities measured at fair value on a recurring basis:
| At December 31, 2025 | Fair Value (Level 3) | Valuation Technique | Unobservable Inputs | Weighted Average or Actual | |||||||||||||||||||||||||
| Fixed maturity investments trading | |||||||||||||||||||||||||||||
| Corporate | $ | Recent transaction price | N/A | N/A | |||||||||||||||||||||||||
| Asset-backed | Discounted cash flow | Discount rate | % | ||||||||||||||||||||||||||
| Total fixed maturity investments trading | |||||||||||||||||||||||||||||
| Other investments | |||||||||||||||||||||||||||||
| Direct private equity investments | Internal valuation model | Discount rate | % | ||||||||||||||||||||||||||
| Liquidity discount | % | ||||||||||||||||||||||||||||
| Other assets and (liabilities) | |||||||||||||||||||||||||||||
| Assumed and ceded (re)insurance contracts | ( | Internal valuation model | Net undiscounted cash flows | $ | |||||||||||||||||||||||||
| Expected loss ratio | % | ||||||||||||||||||||||||||||
| Discount rate | % | ||||||||||||||||||||||||||||
| Total assets and (liabilities) measured at fair value on a recurring basis using Level 3 inputs | $ | ||||||||||||||||||||||||||||
F-34
At December 31, 2024 | Fair Value (Level 3) | Valuation Technique | Unobservable Inputs | Weighted Average or Actual | |||||||||||||||||||||||||
| Other investments | |||||||||||||||||||||||||||||
| Direct private equity investments | $ | Internal valuation model | Discount rate | % | |||||||||||||||||||||||||
| Liquidity discount | % | ||||||||||||||||||||||||||||
| Other assets and (liabilities) | |||||||||||||||||||||||||||||
| Assumed and ceded (re)insurance contracts | ( | Internal valuation model | Net undiscounted cash flows | $ | |||||||||||||||||||||||||
| Expected loss ratio | % | ||||||||||||||||||||||||||||
| Discount rate | % | ||||||||||||||||||||||||||||
| Total assets and (liabilities) measured at fair value on a recurring basis using Level 3 inputs | $ | ||||||||||||||||||||||||||||
Below is a reconciliation of the beginning and ending balances, for the periods shown, of assets and liabilities measured at fair value on a recurring basis using Level 3 inputs:
Fixed Maturity Investments Trading | Other Investments | ||||||||||||||||||||||||||||||||||
Corporate | Asset-backed | Direct Private Equity Investments | Other Assets and (Liabilities) | Total | |||||||||||||||||||||||||||||||
| Balance - January 1, 2025 | $ | $ | $ | $ | ( | $ | |||||||||||||||||||||||||||||
| ( | ( | ||||||||||||||||||||||||||||||||||
Net foreign exchange gains (losses) | |||||||||||||||||||||||||||||||||||
| Purchases | |||||||||||||||||||||||||||||||||||
| Settlements | ( | ( | ( | ||||||||||||||||||||||||||||||||
| Balance - December 31, 2025 | $ | $ | $ | $ | ( | $ | |||||||||||||||||||||||||||||
| Other Investments | |||||||||||||||||||||||||||||
Direct Private Equity Investments | Term Loans | Other Assets and (Liabilities) | Total | ||||||||||||||||||||||||||
| Balance - January 1, 2024 | $ | $ | $ | ( | $ | ||||||||||||||||||||||||
| ( | ( | ||||||||||||||||||||||||||||
Net foreign exchange gains (losses) | ( | ( | |||||||||||||||||||||||||||
| Purchases | |||||||||||||||||||||||||||||
| Sales | ( | ( | ( | ( | |||||||||||||||||||||||||
| Settlements | ( | ( | ( | ||||||||||||||||||||||||||
| Balance - December 31, 2024 | $ | $ | $ | ( | $ | ||||||||||||||||||||||||
Fixed Maturity Investments
Corporate
Level 3 - At December 31, 2025, the Company’s corporate fixed maturity investments included $114.3 million (2024 - $Nil ) of investments with the fair value obtained through use of recent transaction price, due
F-35
to lack of observable pricing inputs. These securities generally consist of privately rated debt issued by financial institutions.
Asset-backed
Level 3 - At December 31, 2025, the Company’s asset-backed fixed maturity investments included $39.9 million (2024 - $Nil ) of investments with the fair value obtained through the use of discounted cash flow models, due to a lack of observable pricing inputs. The underlying collateral for these investments consists of a diversified pool of fund obligations.
Other Investments
Direct Private Equity Investments
Level 3 - At December 31, 2025, the Company’s other investments included $28.0 million (2024 - $43.8 million) of direct private equity investments which are recorded at fair value, with the fair value obtained through the use of internal valuation models. The Company measured the fair value of these investments using multiples of net tangible book value, excluding mark-to-market impacts on invested assets, of the underlying entities. The significant unobservable inputs used in the fair value measurement of these investments are liquidity discount rates applied to each of the book value multiples used in the internal valuation models, and discount rates applied to the expected cash flows of the underlying entities in various scenarios. These unobservable inputs in isolation can cause significant increases or decreases in fair value. Generally, an increase in the liquidity discount rate or discount rates would result in a decrease in the fair value of these private equity investments.
Term Loans
Level 3 - In 2024, the Company disposed of its investment in a term loan, which was recorded at fair value, with the fair value obtained through the use of a discounted cash flow model. The significant unobservable inputs included the projected cash flows and a discount rate based on the Secured Overnight Financing Rate (“SOFR”), adjusted for credit risk and a risk premium.
Other Assets and Liabilities
Assumed and Ceded (Re)insurance Contracts
Level 3 - At December 31, 2025 and 2024, the Company had a net liability related to assumed and ceded (re)insurance contracts accounted for at fair value, with the fair value obtained through the use of an internal valuation model. The inputs to the internal valuation model are principally based on proprietary data as observable market inputs are generally not available. The most significant unobservable inputs include the assumed and ceded expected net cash flows related to the contracts, including the expected premium, acquisition expenses and losses; the expected loss ratio and the relevant discount rate used to calculate the present value of the net cash flows. The contract period and acquisition expense ratio are considered an observable input, as each is defined in the contract. Generally, an increase in the net expected cash flows and expected term of the contract and a decrease in the discount rate, expected loss ratio or acquisition expense ratio, would result in an increase in the expected profit and ultimate fair value of these assumed and ceded (re)insurance contracts.
The Fair Value Option for Financial Assets and Financial Liabilities
The Company has elected to account for other investments and certain assumed and ceded (re)insurance contracts at fair value using the guidance under FASB ASC Topic 825, Financial Instruments, as the Company believes it represents the most meaningful measurement basis for these assets and liabilities.
The change in fair value of other investments resulted in net unrealized gains on investments in 2025 of $106.1 million (2024 - gains of $243.8 million, 2023 - gains of $137.3 million).
F-36
Measuring the Fair Value of Other Investments Using Net Asset Valuations
The table below shows the Company’s portfolio of other investments measured using net asset valuations as a practical expedient:
At December 31, | 2025 | 2024 | |||||||||||||||||||||||||||
| Fair Value | Unfunded Commitments | Fair Value | Unfunded Commitments | ||||||||||||||||||||||||||
| Private credit funds | $ | $ | $ | $ | |||||||||||||||||||||||||
| Private equity funds | |||||||||||||||||||||||||||||
Hedge funds | |||||||||||||||||||||||||||||
| Insurance-linked securities funds | |||||||||||||||||||||||||||||
Total other investments measured using net asset valuations | $ | $ | $ | $ | |||||||||||||||||||||||||
Financial Instruments Disclosed, But Not Carried, at Fair Value
The Company uses various financial instruments in the normal course of its business. The Company’s (re)insurance contracts are excluded from the fair value of financial instruments accounting guidance, unless the Company elects the fair value option, and therefore, are not included in the amounts discussed herein. The carrying values of cash and cash equivalents, accrued investment income, receivables for investments sold, certain other assets, payables for investments purchased, certain other liabilities, and other financial instruments not included herein approximated their fair values.
Debt
Included in the Company’s consolidated balance sheet at December 31, 2025 were debt obligations with a carrying value of $2.3 billion (2024 - $1.9 billion), consisting of $2.2 billion classified as Level 2 and $99.2 million classified as Level 3 (2024 - $1.9 billion and $Nil ). At December 31, 2025, the fair value of the Level 2 and Level 3 debt obligations were $2.3 billion and $100.2 million, respectively (2024 - $1.9 billion and $Nil ).
The fair value of the Company’s Level 2 debt obligations is determined using indicative pricing obtained from independent third‑party pricing service providers. The fair value of the Company’s Level 3 debt obligations is obtained through the use of a discounted cash flow model. The significant unobservable inputs used in the discounted cash flow model were the cash flow projection of the associated debt obligations and the discount rate, adjusted for credit risk. There were no changes in the Company’s valuation techniques used to determine the fair value of the Company’s debt obligations during the period.
Refer to “Note 9. Debt and Credit Facilities” for additional information related to the Company’s debt obligations.
NOTE 7. REINSURANCE
The Company purchases reinsurance and other protection to manage its risk portfolio and to reduce its exposure to large losses. The Company currently has in place contracts that provide for recovery of a portion of certain claims and claim expenses, generally in excess of various retentions or on a proportional basis. In addition to loss recoveries, certain of the Company’s ceded reinsurance contracts provide for payments of additional premiums, for reinstatement premiums and for lost no-claims bonuses, which are incurred when losses are ceded to the respective reinsurance contracts. The Company remains liable to the extent that any reinsurer fails to meet its obligations.
F-37
The following table sets forth the effect of reinsurance and retrocessional activity on premiums written and earned and on claims and claim expenses incurred:
| Year ended December 31, | 2025 | 2024 | 2023 | ||||||||||||||||||||
| Premiums Written | |||||||||||||||||||||||
| Direct | $ | $ | $ | ||||||||||||||||||||
| Assumed | |||||||||||||||||||||||
| Ceded | ( | ( | ( | ||||||||||||||||||||
| Net premiums written | $ | $ | $ | ||||||||||||||||||||
| Premiums Earned | |||||||||||||||||||||||
| Direct | $ | $ | $ | ||||||||||||||||||||
| Assumed | |||||||||||||||||||||||
| Ceded | ( | ( | ( | ||||||||||||||||||||
| Net premiums earned | $ | $ | $ | ||||||||||||||||||||
| Claims and Claim Expenses | |||||||||||||||||||||||
| Gross claims and claim expenses incurred | $ | $ | $ | ||||||||||||||||||||
| Claims and claim expenses recovered | ( | ( | ( | ||||||||||||||||||||
| Net claims and claim expenses incurred | $ | $ | $ | ||||||||||||||||||||
In assessing an allowance for reinsurance assets, which includes premiums receivable and reinsurance recoverable, the Company considers historical information, financial strength of reinsurers, collateralization amounts, and counterparty credit ratings to determine the appropriateness of the allowance. In assessing future default for reinsurance assets, the Company evaluates the provision for current expected credit losses under the probability of default and loss given default method. The Company utilizes its internal capital and risk models, which use counterparty ratings from major rating agencies, and assesses the current market conditions for the likelihood of default. The Company updates its internal capital and risk models for counterparty credit ratings and current market conditions on a periodic basis. Historically, the Company has not experienced material credit losses from reinsurance assets.
Premiums receivable reflects premiums written based on contract and policy terms and include estimates based on information received from both insureds and ceding companies, supplemented by the Company’s estimates of premiums that are written but not reported. Due to the nature of reinsurance, ceding companies routinely report and remit premiums subsequent to the contract coverage period, although the time lag involved in the process of reporting and collecting premiums is typically shorter than the lag in reporting losses.
At December 31, 2025, the Company’s premiums receivable balance was $7.3 billion (2024 - $7.3 billion). Of the Company’s premiums receivable balance as of December 31, 2025, the majority are receivable from highly rated counterparties. The provision for current expected credit losses on the Company’s premiums receivable was $3.2 million at December 31, 2025 (2024 - $4.6 million). The following table provides a roll forward of the provision for current expected credit losses of the Company’s premiums receivable:
| Year ended December 31, | 2025 | 2024 | |||||||||||||||
| Beginning balance | $ | $ | |||||||||||||||
Provision for (release of) allowance | ( | ||||||||||||||||
| Ending balance | $ | $ | |||||||||||||||
Reinsurance recoverable reflects amounts due from reinsurers based on the claim liabilities associated with the reinsurance policy. The Company accrues amounts that are due from reinsurers based on estimated ultimate losses applicable to the contracts.
At December 31, 2025, the Company’s reinsurance recoverable balance was $3.9 billion (2024 - $4.5 billion). Of the Company’s reinsurance recoverable balance at December 31, 2025, 46.9 % is fully
F-38
collateralized by the Company’s reinsurers, 51.5 % is recoverable from reinsurers rated A- or higher by major rating agencies and 1.6 % is recoverable from reinsurers rated lower than A- by major rating agencies (2024 - 55.7 %, 43.2 % and 1.0 %, respectively). The reinsurers with the three largest balances accounted for 12.6 %, 10.1 % and 7.0 %, respectively, of the Company’s reinsurance recoverable balance at December 31, 2025 (2024 - 12.6 %, 11.0 % and 8.3 %, respectively). The provision for current expected credit losses was $13.2 million at December 31, 2025 (2024 - $11.7 million). The three largest company-specific components of the provision for current expected credit losses represented 20.4 %, 17.2 % and 4.8 %, respectively, of the Company’s total provision for current expected credit losses at December 31, 2025 (2024 - 23.9 %, 7.2 % and 5.9 %, respectively). The following table provides a roll forward of the provision for current expected credit losses of the Company’s reinsurance recoverable:
| Year ended December 31, | 2025 | 2024 | |||||||||||||||
| Beginning balance | $ | $ | |||||||||||||||
Provision for (release of) allowance | ( | ||||||||||||||||
| Ending balance | $ | $ | |||||||||||||||
NOTE 8. RESERVE FOR CLAIMS AND CLAIM EXPENSES
The Company believes the most significant accounting judgment made by management is its estimate of claims and claim expense reserves. Claims and claim expense reserves represent estimates, including actuarial and statistical projections at a given point in time, of the ultimate settlement and administration costs for unpaid claims and claim expenses arising from the insurance and reinsurance contracts the Company sells. The Company’s reserve for claims and claim expenses are a combination of case reserves, additional case reserves (“ACR”) and incurred but not reported losses and incurred but not enough reported losses (collectively referred to as “IBNR”). Case reserves are losses reported to the Company by insureds and ceding companies, but which have not yet been paid. If deemed necessary and in certain situations, either the Company establishes, or the Company’s clients report, ACR. Client reported ACR represents the client’s estimate of additional contract specific claims in excess of the case reserves they have reported to the Company. ACR established by the Company represents the Company’s estimates for claims related to specific contracts which the Company believes may not be adequately estimated by the client as of that date or is not within the IBNR. The Company establishes IBNR using actuarial techniques and expert judgment to represent the anticipated cost of claims which have not been reported to the Company yet, or where the Company anticipates increased reporting. The Company’s reserving committee, which includes members of the Company’s senior management, reviews, discusses, and assesses the reasonableness and adequacy of the reserving estimates included in the audited consolidated financial statements.
The following table summarizes the Company’s reserve for claims and claim expenses by segment, allocated between case reserves, ACR and IBNR:
| At December 31, 2025 | Case Reserves | ACR | IBNR | Total | |||||||||||||||||||||||||
| Property | $ | $ | $ | $ | |||||||||||||||||||||||||
| Casualty and Specialty | |||||||||||||||||||||||||||||
Total | $ | $ | $ | $ | |||||||||||||||||||||||||
| At December 31, 2024 | |||||||||||||||||||||||||||||
| Property | $ | $ | $ | $ | |||||||||||||||||||||||||
| Casualty and Specialty | |||||||||||||||||||||||||||||
| Total | $ | $ | $ | $ | |||||||||||||||||||||||||
F-39
Activity in the reserve for claims and claim expenses is summarized as follows:
| Year ended December 31, | 2025 | 2024 | 2023 | ||||||||||||||||||||
Reserve for claims and claim expenses, net of reinsurance recoverable, beginning of period | $ | $ | $ | ||||||||||||||||||||
| Net incurred related to: | |||||||||||||||||||||||
| Current year | |||||||||||||||||||||||
| Prior years | ( | ( | ( | ||||||||||||||||||||
| Total net incurred | |||||||||||||||||||||||
| Net paid related to: | |||||||||||||||||||||||
| Current year | |||||||||||||||||||||||
| Prior years | |||||||||||||||||||||||
| Total net paid | |||||||||||||||||||||||
Foreign exchange and other (1) | ( | ||||||||||||||||||||||
Amounts acquired (2) | |||||||||||||||||||||||
Reserve for claims and claim expenses, net of reinsurance recoverable, end of period | |||||||||||||||||||||||
Reinsurance recoverable, end of period | |||||||||||||||||||||||
Reserve for claims and claim expenses, end of period | $ | $ | $ | ||||||||||||||||||||
(1)Reflects the impact of the foreign exchange revaluation of the reserve for claims and claim expenses, net of reinsurance recoverable, denominated in non-U.S. dollars as at the balance sheet date, as well as reinsurance transactions accounted for under retroactive reinsurance accounting.
(2)Represents the fair value of Validus’ reserve for claims and claim expenses, net of reinsurance recoverable, acquired on November 1, 2023.
During 2025, the Company incurred losses related to the California Wildfires, Hurricane Melissa, the crash of American Airlines flight 5342, certain refinery fires in the first quarter of 2025, the crash of UPS Airlines flight 2976 and the Grasberg mine landslide (collectively, the “2025 Large Loss Events”).
The Company’s reserving methodology for each line of business uses a loss reserving process that calculates a point estimate for its ultimate settlement and administration costs for claims and claim expenses. The Company does not calculate a range of estimates and does not discount any of its reserves for claims and claim expenses. The Company uses this point estimate, along with paid claims and case reserves, to record its best estimate of ACR and IBNR in its consolidated financial statements. Under GAAP, the Company is not permitted to establish estimates for catastrophe claims and claim expense reserves until an event occurs that gives rise to a loss.
Reserving involves other uncertainties, such as the dependence on information from ceding companies, the time lag inherent in reporting information from the primary insurer to the Company or to the Company’s ceding companies, and differing reserving practices among ceding companies. The information received from ceding companies is typically in the form of bordereaux, broker notifications of loss and/or discussions with ceding companies or their brokers. This information may be received on a monthly, quarterly or transactional basis and normally includes paid claims and estimates of case reserves. The Company sometimes also receives an estimate or provision for IBNR. This information is updated and adjusted periodically during the loss settlement period as new data or facts in respect of initial claims, client accounts, industry or event trends may be reported or emerge in addition to changes in applicable statutory and case laws.
The Company’s estimates of large losses are based on factors including currently available information derived from claims information from certain customers and brokers, industry assessments of losses, proprietary models, and the terms and conditions of the Company’s contracts. The uncertainty of the Company’s estimates for large losses is also impacted by the preliminary nature of the information available, the magnitude and relative infrequency of the events, the expected duration of the respective claims development period, inadequacies in the data provided to the relevant date by industry participants and the potential for further reporting lags or insufficiencies; and in certain large losses, significant uncertainty as to the form of the claims and legal issues, under the relevant terms of insurance and
F-40
reinsurance contracts. In addition, a significant portion of the net claims and claim expenses associated with certain large losses can be concentrated with a few large clients and therefore the loss estimates for these large losses may vary significantly based on the claims experience of those clients. The contingent nature of business interruption and other exposures will also impact losses in a meaningful way, which may give rise to significant complexity in respect of claims handling, claims adjustment and other coverage issues, over time. Given the magnitude of certain events, there can be meaningful uncertainty regarding total covered losses for the insurance industry and, accordingly, several of the key assumptions underlying the Company’s loss estimates. Loss reserve estimation in respect of the Company’s retrocessional contracts poses further challenges compared to directly assumed reinsurance. In addition, the Company’s actual net losses from these events may increase if the Company’s reinsurers or other obligors fail to meet their obligations.
The Company reevaluates its actuarial reserving assumptions on a periodic basis. Typically, the quarterly review procedures include reviewing paid and reported claims in the most recent reporting period, reviewing the development of paid and reported claims from prior periods, and reviewing the Company’s overall experience by underwriting year and in the aggregate. The Company monitors its expected ultimate claims and claim expense ratios and expected claims reporting assumptions on a quarterly basis and compares them to its actual experience. These actuarial assumptions are generally reviewed annually, based on input from the Company’s actuaries, underwriters, claims personnel and finance professionals, although adjustments may be made more frequently if needed. Assumption changes are made to adjust for changes in the terms of coverage the Company provides, changes in industry results for similar business, as well as its actual experience to the extent the Company has enough data to rely on its own experience. If the Company determines that adjustments to an earlier estimate are appropriate, such adjustments are recorded in the period in which they are identified.
Because of the inherent uncertainties discussed above, the Company has developed a reserving philosophy that attempts to incorporate prudent assumptions and estimates, and the Company has generally experienced favorable development on prior accident years net claims and claim expenses in the last several years. However, there is no assurance that this favorable development on prior accident years net claims and claim expenses will occur in future periods.
The Company establishes a provision for unallocated loss adjustment expenses (“ULAE”) when the related reserve for claims and claim expenses is established. ULAE are expenses that cannot be associated with a specific claim but are related to claims paid or in the process of settlement, such as internal costs of the claims function, and are included in the reserve for claims and claim expenses. The determination of the ULAE provision is subject to judgment.
Incurred and Paid Claims Development and Reserving Methodology
The information provided herein about incurred and paid accident year claims development for the years ended prior to December 31, 2025 on a consolidated basis and by segment is presented as supplementary information. The Company has applied a retrospective approach with respect to its acquisitions, presenting all relevant historical information for all periods presented. In addition, included in the incurred claims and claim expenses and cumulated paid claims and claim expenses tables below are reconciling items that represent the unamortized balance of fair value adjustments recorded in connection with the acquisition of TMR and Validus to reflect an increase in net claims and claim expenses due to the addition of a market based risk margin that represented the cost of capital required by a market participant to assume the net claims and claim expenses of TMR and Validus, partially offset by a decrease from discounting in connection with the acquisition of TMR and Validus, to reflect the time value of money.
For incurred and paid accident year claims denominated in currencies other than USD, the Company used the current year-end balance sheet foreign exchange rate for all periods provided, thereby eliminating the effects of changes in foreign currency translation rates from the incurred and paid accident year claims development information included in the tables below.
F-41
The following table details the Company’s consolidated incurred claims and claim expenses and cumulative paid claims and claim expenses as of December 31, 2025, net of reinsurance, as well as IBNR and ACR included within the net incurred claims amounts:
| Incurred Claims and Claim Expenses, Net of Reinsurance | ||||||||||||||||||||||||||||||||||||||||||||||||||||||||||||||||||||||||||
| For the year ended December 31, | At December 31, 2025 | |||||||||||||||||||||||||||||||||||||||||||||||||||||||||||||||||||||||||
| Accident Year | 2016 | 2017 | 2018 | 2019 | 2020 | 2021 | 2022 | 2023 | 2024 | 2025 | IBNR and ACR | |||||||||||||||||||||||||||||||||||||||||||||||||||||||||||||||
| (unaudited) | (unaudited) | (unaudited) | (unaudited) | (unaudited) | (unaudited) | (unaudited) | (unaudited) | (unaudited) | ||||||||||||||||||||||||||||||||||||||||||||||||||||||||||||||||||
| 2016 | $ | $ | $ | $ | $ | $ | $ | $ | $ | $ | $ | |||||||||||||||||||||||||||||||||||||||||||||||||||||||||||||||
| 2017 | — | |||||||||||||||||||||||||||||||||||||||||||||||||||||||||||||||||||||||||
| 2018 | — | — | ||||||||||||||||||||||||||||||||||||||||||||||||||||||||||||||||||||||||
| 2019 | — | — | — | |||||||||||||||||||||||||||||||||||||||||||||||||||||||||||||||||||||||
| 2020 | — | — | — | — | ||||||||||||||||||||||||||||||||||||||||||||||||||||||||||||||||||||||
| 2021 | — | — | — | — | — | |||||||||||||||||||||||||||||||||||||||||||||||||||||||||||||||||||||
| 2022 | — | — | — | — | — | — | ||||||||||||||||||||||||||||||||||||||||||||||||||||||||||||||||||||
| 2023 | — | — | — | — | — | — | — | |||||||||||||||||||||||||||||||||||||||||||||||||||||||||||||||||||
| 2024 | — | — | — | — | — | — | — | — | ||||||||||||||||||||||||||||||||||||||||||||||||||||||||||||||||||
| 2025 | — | — | — | — | — | — | — | — | — | |||||||||||||||||||||||||||||||||||||||||||||||||||||||||||||||||
| Total | $ | $ | ||||||||||||||||||||||||||||||||||||||||||||||||||||||||||||||||||||||||
| Cumulative Paid Claims and Claim Expenses, Net of Reinsurance | ||||||||||||||||||||||||||||||||||||||||||||||||||||||||||||||||||||||||||
| For the year ended December 31, | ||||||||||||||||||||||||||||||||||||||||||||||||||||||||||||||||||||||||||
| Accident Year | 2016 | 2017 | 2018 | 2019 | 2020 | 2021 | 2022 | 2023 | 2024 | 2025 | ||||||||||||||||||||||||||||||||||||||||||||||||||||||||||||||||
| (unaudited) | (unaudited) | (unaudited) | (unaudited) | (unaudited) | (unaudited) | (unaudited) | (unaudited) | (unaudited) | ||||||||||||||||||||||||||||||||||||||||||||||||||||||||||||||||||
| 2016 | $ | $ | $ | $ | $ | $ | $ | $ | $ | $ | ||||||||||||||||||||||||||||||||||||||||||||||||||||||||||||||||
| 2017 | — | |||||||||||||||||||||||||||||||||||||||||||||||||||||||||||||||||||||||||
| 2018 | — | — | ||||||||||||||||||||||||||||||||||||||||||||||||||||||||||||||||||||||||
| 2019 | — | — | — | |||||||||||||||||||||||||||||||||||||||||||||||||||||||||||||||||||||||
| 2020 | — | — | — | — | ||||||||||||||||||||||||||||||||||||||||||||||||||||||||||||||||||||||
| 2021 | — | — | — | — | — | |||||||||||||||||||||||||||||||||||||||||||||||||||||||||||||||||||||
| 2022 | — | — | — | — | — | — | ||||||||||||||||||||||||||||||||||||||||||||||||||||||||||||||||||||
| 2023 | — | — | — | — | — | — | — | |||||||||||||||||||||||||||||||||||||||||||||||||||||||||||||||||||
| 2024 | — | — | — | — | — | — | — | — | ||||||||||||||||||||||||||||||||||||||||||||||||||||||||||||||||||
| 2025 | — | — | — | — | — | — | — | — | — | |||||||||||||||||||||||||||||||||||||||||||||||||||||||||||||||||
| Total | $ | |||||||||||||||||||||||||||||||||||||||||||||||||||||||||||||||||||||||||
| Outstanding liabilities from accident year 2015 and prior, net of reinsurance | ||||||||||||||||||||||||||||||||||||||||||||||||||||||||||||||||||||||||||
| Adjustment for unallocated loss adjustment expenses | ||||||||||||||||||||||||||||||||||||||||||||||||||||||||||||||||||||||||||
Unamortized fair value and other adjustments recorded in connection with acquisitions | ( | |||||||||||||||||||||||||||||||||||||||||||||||||||||||||||||||||||||||||
| Liability for claims and claim expenses, net of reinsurance | $ | |||||||||||||||||||||||||||||||||||||||||||||||||||||||||||||||||||||||||
Property Segment
Within the Property segment, the Company writes property catastrophe excess of loss reinsurance contracts to insure insurance and reinsurance companies against natural and man-made catastrophes. Under these contracts, the Company indemnifies an insurer or reinsurer when its aggregate paid claims and claim expenses from a single occurrence of a covered peril exceeds the attachment point specified in the contract, up to an amount per loss specified in the contract. Generally, the Company’s most significant exposure is to losses from hurricanes, earthquakes and other windstorms, although the Company is also exposed to claims arising from other man-made and natural catastrophes, such as tsunamis, winter storms, freezes, floods, fires, tornadoes, explosions and acts of terrorism. The Company’s predominant exposure under such coverage is to property damage. However, other risks, including business interruption and other non-property losses, may also be covered under the Company’s catastrophe contracts when arising from a covered peril. The Company’s coverages are offered on either a worldwide basis or are limited to selected geographic areas.
Coverage can also vary from “all property” perils to limited coverage on selected perils, such as “earthquake only” coverage. The Company also enters into retrocessional contracts that provide property catastrophe
F-42
coverage to other reinsurers or retrocedants. This coverage is generally in the form of excess of loss retrocessional contracts and may cover all perils and exposures on a worldwide basis or be limited in scope to selected geographic areas, perils and/or exposures. The exposures the Company assumes from retrocessional business can change within a contract term as the underwriters of a retrocedant may alter their book of business after the retrocessional coverage has been bound. The Company also offers dual trigger reinsurance contracts which require the Company to pay claims based on claims incurred by insurers and reinsurers in addition to the estimate of insured industry losses as reported by referenced statistical reporting agencies.
Also included in the Property segment is property per risk, property (re)insurance, delegated authority arrangements and regional U.S. multi-line reinsurance. The Company’s predominant exposure under such coverage is to property damage. However, other risks, including business interruption and other non-property losses, may also be covered when arising from a covered peril. The Company’s coverages are offered on either a worldwide basis or are limited to selected geographic areas. Principally all of the business is reinsurance, although the Company also writes insurance business primarily through delegated authority arrangements. The Company offers these products principally through proportional reinsurance coverage or in the form of delegated authority arrangements. In a proportional reinsurance arrangement (also referred to as quota share reinsurance or pro rata reinsurance), the reinsurer shares a proportional part of the original premiums and losses of the reinsured.
Claims and claim expenses in the Company’s Property segment are generally characterized by losses of low frequency and high severity. Initial reporting of paid and incurred claims in general, tends to be relatively prompt, particularly for less complex losses. The Company considers this business “short-tail” as compared to the reporting of claims for “long-tail” products, which tends to be slower. However, the timing of claims payment and reporting also varies depending on various factors, including: whether the claims arise under reinsurance of primary insurance companies or reinsurance of other reinsurance companies; the nature of the events (e.g., hurricanes, earthquakes or terrorism); the geographic area involved; post-event inflation which may cause the cost to repair damaged property to increase significantly from current estimates, or for property claims to remain open for a longer period of time, due to limitations on the supply of building materials, labor and other resources; complex policy coverage and other legal issues; and the quality of each client’s claims management and reserving practices. Management’s judgments regarding these factors are reflected in the Company’s reserve for claims and claim expenses.
Reserving for most of the Company’s Property segment, in particular catastrophe exposure, generally does not involve the use of traditional actuarial techniques, although for certain classes, such as proportional Property classes, traditional actuarial techniques are applied. Rather, claims and claim expense reserves are estimated by management by completing an in-depth analysis of the individual contracts which may potentially be impacted by the loss. The in-depth analysis generally involves: 1) estimating the size of insured industry loss; 2) reviewing reinsurance contract portfolios to identify contracts which are exposed; 3) reviewing information reported or otherwise provided by customers and brokers; 4) discussing the loss with customers and brokers; and 5) estimating the ultimate expected cost to settle all claims and administrative costs arising from the loss on a contract-by-contract basis and in aggregate for the event. Once a loss has occurred, during the then current reporting period, the Company records its best estimate of the ultimate expected cost to settle all claims arising from the loss. The Company’s estimate of claims and claim expense reserves is then determined by deducting cumulative paid losses from its estimate of the ultimate expected loss. The Company’s estimate of IBNR is determined by deducting cumulative paid losses, case reserves and ACR from its estimate of the ultimate expected loss. Once the Company receives a valid notice of loss or payment request under a catastrophe reinsurance contract, it is generally able to process and pay such claims promptly.
Because losses from which claims arise under policies written within the Property segment are typically prominent, public events such as hurricanes and earthquakes, the Company is often able to use independent reports as part of its loss reserve estimation process. The Company also reviews catastrophe bulletins published by various statistical reporting agencies to assist in determining the size of the industry loss, although these reports may not be available for some time after an event. For smaller events including localized severe weather events such as windstorms, hail, ice, snow, flooding, freezing and tornadoes, which are not necessarily prominent, public occurrences, the Company uses standard actuarial techniques to set reserves as it does in other property. The assumptions used are monitored and reviewed through the year to ensure they reflect the level of small catastrophe activity experienced through the year and the
F-43
exposure to the geographic regions involved. For these small events, the IBNR is run-off over time using Bornhuetter-Ferguson actuarial method, a standard actuarial technique. The loss development factors for the reported Bornhuetter-Ferguson actuarial method are selected based on a review of the Company’s historical experience. The reported loss development factors are typically reviewed annually.
In general, reserves for the Company’s more recent large losses are subject to greater uncertainty and, therefore, greater potential variability, and are likely to experience material changes from one period to the next. This is due to the uncertainty as to the size of the industry losses, uncertainty as to which contracts have been exposed, uncertainty due to complex legal and coverage issues that can arise out of large or complex losses, and uncertainty as to the magnitude of claims incurred by the Company’s customers. As the Company’s claims age, more information becomes available and the Company believes its estimates become more certain.
The following table details the Company’s Property segment incurred claims and claim expenses and cumulative paid claims and claim expenses as of December 31, 2025, net of reinsurance, as well as IBNR and ACR included within the net incurred claims amounts:
| Incurred Claims and Claim Expenses, Net of Reinsurance | ||||||||||||||||||||||||||||||||||||||||||||||||||||||||||||||||||||||||||
| For the year ended December 31, | At December 31, 2025 | |||||||||||||||||||||||||||||||||||||||||||||||||||||||||||||||||||||||||
| Accident Year | 2016 | 2017 | 2018 | 2019 | 2020 | 2021 | 2022 | 2023 | 2024 | 2025 | IBNR and ACR | |||||||||||||||||||||||||||||||||||||||||||||||||||||||||||||||
| (unaudited) | (unaudited) | (unaudited) | (unaudited) | (unaudited) | (unaudited) | (unaudited) | (unaudited) | (unaudited) | ||||||||||||||||||||||||||||||||||||||||||||||||||||||||||||||||||
| 2016 | $ | $ | $ | $ | $ | $ | $ | $ | $ | $ | $ | |||||||||||||||||||||||||||||||||||||||||||||||||||||||||||||||
| 2017 | — | |||||||||||||||||||||||||||||||||||||||||||||||||||||||||||||||||||||||||
| 2018 | — | — | ||||||||||||||||||||||||||||||||||||||||||||||||||||||||||||||||||||||||
| 2019 | — | — | — | |||||||||||||||||||||||||||||||||||||||||||||||||||||||||||||||||||||||
| 2020 | — | — | — | — | ||||||||||||||||||||||||||||||||||||||||||||||||||||||||||||||||||||||
| 2021 | — | — | — | — | — | |||||||||||||||||||||||||||||||||||||||||||||||||||||||||||||||||||||
| 2022 | — | — | — | — | — | — | ||||||||||||||||||||||||||||||||||||||||||||||||||||||||||||||||||||
| 2023 | — | — | — | — | — | — | — | |||||||||||||||||||||||||||||||||||||||||||||||||||||||||||||||||||
| 2024 | — | — | — | — | — | — | — | — | ||||||||||||||||||||||||||||||||||||||||||||||||||||||||||||||||||
| 2025 | — | — | — | — | — | — | — | — | — | |||||||||||||||||||||||||||||||||||||||||||||||||||||||||||||||||
| Total | $ | $ | ||||||||||||||||||||||||||||||||||||||||||||||||||||||||||||||||||||||||
| Cumulative Paid Claims and Claim Expenses, Net of Reinsurance | ||||||||||||||||||||||||||||||||||||||||||||||||||||||||||||||||||||||||||
| For the year ended December 31, | ||||||||||||||||||||||||||||||||||||||||||||||||||||||||||||||||||||||||||
| Accident Year | 2016 | 2017 | 2018 | 2019 | 2020 | 2021 | 2022 | 2023 | 2024 | 2025 | ||||||||||||||||||||||||||||||||||||||||||||||||||||||||||||||||
| (unaudited) | (unaudited) | (unaudited) | (unaudited) | (unaudited) | (unaudited) | (unaudited) | (unaudited) | (unaudited) | ||||||||||||||||||||||||||||||||||||||||||||||||||||||||||||||||||
| 2016 | $ | $ | $ | $ | $ | $ | $ | $ | $ | $ | ||||||||||||||||||||||||||||||||||||||||||||||||||||||||||||||||
| 2017 | — | |||||||||||||||||||||||||||||||||||||||||||||||||||||||||||||||||||||||||
| 2018 | — | — | ||||||||||||||||||||||||||||||||||||||||||||||||||||||||||||||||||||||||
| 2019 | — | — | — | |||||||||||||||||||||||||||||||||||||||||||||||||||||||||||||||||||||||
| 2020 | — | — | — | — | ||||||||||||||||||||||||||||||||||||||||||||||||||||||||||||||||||||||
| 2021 | — | — | — | — | — | |||||||||||||||||||||||||||||||||||||||||||||||||||||||||||||||||||||
| 2022 | — | — | — | — | — | — | ||||||||||||||||||||||||||||||||||||||||||||||||||||||||||||||||||||
| 2023 | — | — | — | — | — | — | — | |||||||||||||||||||||||||||||||||||||||||||||||||||||||||||||||||||
| 2024 | — | — | — | — | — | — | — | — | ||||||||||||||||||||||||||||||||||||||||||||||||||||||||||||||||||
| 2025 | — | — | — | — | — | — | — | — | — | |||||||||||||||||||||||||||||||||||||||||||||||||||||||||||||||||
| Total | $ | |||||||||||||||||||||||||||||||||||||||||||||||||||||||||||||||||||||||||
| Outstanding liabilities from accident year 2015 and prior, net of reinsurance | ||||||||||||||||||||||||||||||||||||||||||||||||||||||||||||||||||||||||||
| Adjustment for unallocated loss adjustment expenses | ||||||||||||||||||||||||||||||||||||||||||||||||||||||||||||||||||||||||||
Unamortized fair value and other adjustments recorded in connection with acquisitions | ( | |||||||||||||||||||||||||||||||||||||||||||||||||||||||||||||||||||||||||
| Liability for claims and claim expenses, net of reinsurance | $ | |||||||||||||||||||||||||||||||||||||||||||||||||||||||||||||||||||||||||
Casualty and Specialty Segment
The Company offers its casualty and specialty reinsurance products principally on a proportional basis, and it also provides excess of loss coverage. The Company offers casualty and specialty reinsurance products to insurance and reinsurance companies and provides coverage for specific geographic regions or on a
F-44
worldwide basis. Principally all of the business is reinsurance, although the Company also writes insurance business.
As with the Company’s Property segment, its Casualty and Specialty segment reinsurance contracts can include coverage for relatively large limits or exposures. As a result, the Company’s casualty and specialty reinsurance business can be subject to significant claims volatility. In periods of low claims frequency or severity, the Company’s results will generally be favorably impacted while in periods of high claims frequency or severity the Company’s results will generally be negatively impacted.
The Company’s processes and methodologies in respect of loss estimation for the coverages offered through its Casualty and Specialty segment differ from those used for its Property segment. For example, the Company’s casualty and specialty coverages are more likely to be impacted by factors such as long-term inflation and changes in the social and legal environment, which the Company believes gives rise to greater uncertainty in its reserves for claims and claim expenses. The Company believes this makes its Casualty and Specialty segment reserving subject to greater uncertainty than its Property segment.
The Company calculates multiple point estimates for claims and claim expense reserves using a variety of actuarial reserving techniques for many, but not all, of its classes of business for each underwriting year within the Casualty and Specialty segment. The Company does not believe that these multiple point estimates are, or should be considered, a range. Rather, the Company considers each class of business and determines the most appropriate point estimate for each underwriting year based on the characteristics of the particular class including: (1) loss development patterns derived from historical data; (2) the credibility of the selected loss development pattern; (3) the stability of the loss development patterns; (4) how developed the underwriting year is; and (5) the observed loss development of other underwriting years for the same class. The Company also considers other relevant factors, including: (1) historical ultimate loss ratios; (2) the presence of individual large losses; and (3) known occurrences that have not yet resulted in reported losses. The Company makes determinations of the most appropriate point estimate of loss for each class based on an evaluation of relevant information and does not ascribe any particular portion of the estimate to a particular factor or consideration. In addition, the Company believes that a review of individual contract information improves the loss estimates for some classes of business.
When developing claims and claims expense reserves for its Casualty and Specialty segment, the Company considers several actuarial techniques such as the expected loss ratio method, the Bornhuetter-Ferguson actuarial method and the paid and reported chain ladder actuarial method.
For classes of business and underwriting years where the Company has limited historical claims experience, estimates of ultimate losses are generally initially determined based on the loss ratio method applied to each underwriting year and to each class of business. Unless the Company has credible claims experience or unfavorable development, it generally selects an ultimate loss based on its initial expected loss ratio. The selected ultimate losses are determined by multiplying the initial expected loss ratio by the earned premium. The initial expected loss ratios are key inputs that involve management judgment and are based on a variety of factors, including: (1) contract by contract expected loss ratios developed during the Company’s pricing process; (2) historical loss ratios and combined ratios adjusted for rate change and trend; and (3) industry benchmarks for similar business. These judgments take into account management’s view of past, current and future factors that may influence ultimate losses, including: (1) market conditions; (2) changes in the business underwritten; (3) changes in timing of the emergence of claims; and (4) other factors that may influence ultimate loss ratios and losses.
The determination of when reported losses are sufficient and credible to warrant selection of an ultimate loss ratio different from the initial expected loss ratio also requires judgment. The Company generally makes adjustments for reported loss experience indicating unfavorable variances from initial expected loss ratios sooner than reported loss experience indicating favorable variances. This is because the reporting of losses in excess of expectations tends to have greater credibility than an absence or lower than expected level of reported losses. Over time, as a greater number of claims are reported and the credibility of reported losses improves, actuarial estimates of IBNR are typically based on the Bornhuetter-Ferguson actuarial method or the reported chain ladder actuarial method.
The Bornhuetter-Ferguson actuarial method allows for greater weight to be applied to expected results in periods where little or no actual experience is available, and, hence, is less susceptible to the potential pitfall of being excessively swayed by experience of actual paid and/or reported loss data, compared to the
F-45
chain ladder actuarial method. The Bornhuetter-Ferguson actuarial method uses the initial expected loss ratio to estimate IBNR, and it assumes that past experience is not fully representative of the future. As the Company’s reserves for claims and claim expenses age, and actual claims experience becomes available, this method places less weight on expected experience and places more weight on actual experience. This experience, which represents the difference between expected reported claims and actual reported claims, is reflected in the respective reporting period as a change in estimate. The utilization of the Bornhuetter-Ferguson actuarial method requires the Company to estimate an expected ultimate claims and claim expense ratio and select an expected loss reporting pattern. The Company selects its estimates of the expected ultimate claims and claim expense ratios as described above and selects its expected loss reporting patterns by utilizing actuarial analysis, including management’s judgment, and historical patterns of paid losses and reporting of case reserves to the Company, as well as industry loss development patterns. The estimated expected claims and claim expense ratio may be modified to the extent that reported losses at a given point in time differ from what would be expected based on the selected loss reporting pattern.
The reported chain ladder actuarial method utilizes actual reported losses and a loss development pattern to determine an estimate of ultimate losses that is independent of the initial expected ultimate loss ratio and earned premium. The Company believes this technique is most appropriate when there are a large number of reported losses with significant statistical credibility and a relatively stable loss development pattern. Information that may cause future loss development patterns to differ from historical loss development patterns is considered and reflected in the Company’s selected loss development patterns as appropriate. For certain reinsurance contracts, historical loss development patterns may be developed from ceding company data or other sources.
In addition, certain specialty coverages may be impacted by natural and man-made catastrophes. The Company estimates reserves for claim and claim expenses for these losses, following a process that is similar to its Property segment described above.
F-46
The following table details the Company’s Casualty and Specialty segment incurred claims and claim expenses and cumulative paid claims and claim expenses as of December 31, 2025, net of reinsurance, as well as IBNR and ACR included within the net incurred claims amounts:
| Incurred Claims and Claim Expenses, Net of Reinsurance | ||||||||||||||||||||||||||||||||||||||||||||||||||||||||||||||||||||||||||
| For the year ended December 31, | At December 31, 2025 | |||||||||||||||||||||||||||||||||||||||||||||||||||||||||||||||||||||||||
| Accident Year | 2016 | 2017 | 2018 | 2019 | 2020 | 2021 | 2022 | 2023 | 2024 | 2025 | IBNR and ACR | |||||||||||||||||||||||||||||||||||||||||||||||||||||||||||||||
| (unaudited) | (unaudited) | (unaudited) | (unaudited) | (unaudited) | (unaudited) | (unaudited) | (unaudited) | (unaudited) | ||||||||||||||||||||||||||||||||||||||||||||||||||||||||||||||||||
| 2016 | $ | $ | $ | $ | $ | $ | $ | $ | $ | $ | $ | |||||||||||||||||||||||||||||||||||||||||||||||||||||||||||||||
| 2017 | — | |||||||||||||||||||||||||||||||||||||||||||||||||||||||||||||||||||||||||
| 2018 | — | — | ||||||||||||||||||||||||||||||||||||||||||||||||||||||||||||||||||||||||
| 2019 | — | — | — | |||||||||||||||||||||||||||||||||||||||||||||||||||||||||||||||||||||||
| 2020 | — | — | — | — | ||||||||||||||||||||||||||||||||||||||||||||||||||||||||||||||||||||||
| 2021 | — | — | — | — | — | |||||||||||||||||||||||||||||||||||||||||||||||||||||||||||||||||||||
| 2022 | — | — | — | — | — | — | ||||||||||||||||||||||||||||||||||||||||||||||||||||||||||||||||||||
| 2023 | — | — | — | — | — | — | — | |||||||||||||||||||||||||||||||||||||||||||||||||||||||||||||||||||
| 2024 | — | — | — | — | — | — | — | — | ||||||||||||||||||||||||||||||||||||||||||||||||||||||||||||||||||
| 2025 | — | — | — | — | — | — | — | — | — | |||||||||||||||||||||||||||||||||||||||||||||||||||||||||||||||||
| Total | $ | $ | ||||||||||||||||||||||||||||||||||||||||||||||||||||||||||||||||||||||||
| Cumulative Paid Claims and Claim Expenses, Net of Reinsurance | ||||||||||||||||||||||||||||||||||||||||||||||||||||||||||||||||||||||||||
| For the year ended December 31, | ||||||||||||||||||||||||||||||||||||||||||||||||||||||||||||||||||||||||||
| Accident Year | 2016 | 2017 | 2018 | 2019 | 2020 | 2021 | 2022 | 2023 | 2024 | 2025 | ||||||||||||||||||||||||||||||||||||||||||||||||||||||||||||||||
| (unaudited) | (unaudited) | (unaudited) | (unaudited) | (unaudited) | (unaudited) | (unaudited) | (unaudited) | (unaudited) | ||||||||||||||||||||||||||||||||||||||||||||||||||||||||||||||||||
| 2016 | $ | $ | $ | $ | $ | $ | $ | $ | $ | $ | ||||||||||||||||||||||||||||||||||||||||||||||||||||||||||||||||
| 2017 | — | |||||||||||||||||||||||||||||||||||||||||||||||||||||||||||||||||||||||||
| 2018 | — | — | ||||||||||||||||||||||||||||||||||||||||||||||||||||||||||||||||||||||||
| 2019 | — | — | — | |||||||||||||||||||||||||||||||||||||||||||||||||||||||||||||||||||||||
| 2020 | — | — | — | — | ||||||||||||||||||||||||||||||||||||||||||||||||||||||||||||||||||||||
| 2021 | — | — | — | — | — | |||||||||||||||||||||||||||||||||||||||||||||||||||||||||||||||||||||
| 2022 | — | — | — | — | — | — | ||||||||||||||||||||||||||||||||||||||||||||||||||||||||||||||||||||
| 2023 | — | — | — | — | — | — | — | |||||||||||||||||||||||||||||||||||||||||||||||||||||||||||||||||||
| 2024 | — | — | — | — | — | — | — | — | ||||||||||||||||||||||||||||||||||||||||||||||||||||||||||||||||||
| 2025 | — | — | — | — | — | — | — | — | — | |||||||||||||||||||||||||||||||||||||||||||||||||||||||||||||||||
| Total | $ | |||||||||||||||||||||||||||||||||||||||||||||||||||||||||||||||||||||||||
| Outstanding liabilities from accident year 2015 and prior, net of reinsurance | ||||||||||||||||||||||||||||||||||||||||||||||||||||||||||||||||||||||||||
| Adjustment for unallocated loss adjustment expenses | ||||||||||||||||||||||||||||||||||||||||||||||||||||||||||||||||||||||||||
Unamortized fair value and other adjustments recorded in connection with acquisitions | ( | |||||||||||||||||||||||||||||||||||||||||||||||||||||||||||||||||||||||||
| Liability for claims and claim expenses, net of reinsurance | $ | |||||||||||||||||||||||||||||||||||||||||||||||||||||||||||||||||||||||||
Prior Year Development of the Reserve for Net Claims and Claim Expenses
The Company’s estimates of claims and claim expense reserves are not precise in that, among other things, they are based on predictions of future developments and estimates of future trends and other variable factors. Some, but not all, of the Company’s reserves are further subject to the uncertainty inherent in actuarial methodologies and estimates. Because a reserve estimate is simply an insurer’s estimate at a point in time of its ultimate liability, and because there are numerous factors that affect reserves and claims payments that cannot be determined with certainty in advance, the Company’s ultimate payments will vary, perhaps materially, from its estimates of reserves. If the Company determines in a subsequent period that adjustments to its previously established reserves are appropriate, such adjustments are recorded in the period in which they are identified. On a net basis, the Company’s cumulative favorable or unfavorable development is generally reduced by offsetting changes in its reinsurance recoverable, as well as changes to loss related premiums such as reinstatement premiums and redeemable noncontrolling interest, all of which generally move in the opposite direction to changes in the Company’s ultimate claims and claim expenses.
F-47
The following table details the Company’s net (favorable) adverse development of prior accident years net claims and claim expenses by segment:
| Year ended December 31, | 2025 | 2024 | 2023 | ||||||||||||||||||||
| Property | $ | ( | $ | ( | $ | ( | |||||||||||||||||
| Casualty and Specialty | ( | ( | ( | ||||||||||||||||||||
| Total net (favorable) adverse development of prior accident years net claims and claim expenses | $ | ( | $ | ( | $ | ( | |||||||||||||||||
Changes to prior year estimated net claims and claim expenses increased net income by $1.1 billion during 2025 (2024 - $851.3 million, 2023 - $450.6 million), excluding the consideration of changes in reinstatement, adjustment or other premium changes, profit commissions, redeemable noncontrolling interests - DaVinci, Fontana and Vermeer and income tax.
Property Segment
The following tables detail the net (favorable) adverse development of prior accident years net claims and claim expenses of the Company’s liability for net unpaid claims and claim expenses for its Property segment, allocated between large catastrophe events and small catastrophe events and attritional loss movements:
| Year ended December 31, | 2025 | 2024 | 2023 | ||||||||||||||||||||
Catastrophe and attritional net claims and claim expenses | |||||||||||||||||||||||
| Large catastrophe events | |||||||||||||||||||||||
2024 Large Loss Events (1) | $ | ( | $ | $ | |||||||||||||||||||
2023 Large Loss Events (2) | ( | ( | |||||||||||||||||||||
2022 Weather-Related Large Losses (3) | ( | ( | ( | ||||||||||||||||||||
2021 Weather-Related Large Losses (4) | ( | ( | ( | ||||||||||||||||||||
2020 Weather-Related Large Loss Events (5) | ( | ( | ( | ||||||||||||||||||||
2019 Large Loss Events (6) | ( | ( | ( | ||||||||||||||||||||
2018 Large Loss Events (7) | ( | ( | ( | ||||||||||||||||||||
2017 Large Loss Events (8) | ( | ( | ( | ||||||||||||||||||||
| Other | ( | ||||||||||||||||||||||
Total large catastrophe events | ( | ( | ( | ||||||||||||||||||||
Total small catastrophe events and attritional loss movements (9) | ( | ( | ( | ||||||||||||||||||||
Total catastrophe and attritional net claims and claim expenses | ( | ( | ( | ||||||||||||||||||||
| Actuarial assumption changes | ( | ||||||||||||||||||||||
| Total net (favorable) adverse development of prior accident years net claims and claim expenses | $ | ( | $ | ( | $ | ( | |||||||||||||||||
(1)“2024 Large Loss Events” includes Hurricanes Milton, Helene, Debby and Beryl, the Baltimore Bridge Collapse, a series of severe convective storms impacting the Southern and Midwest United States, the Hualien earthquake which impacted Taiwan in April 2024, a severe hailstorm which impacted Calgary in August 2024, and certain aggregate loss contracts triggered during 2024.
(2)“2023 Large Loss Events” includes earthquakes in Southern and Central Turkey, Cyclone Gabrielle, flooding in northern New Zealand, various wind and thunderstorm events in both the Southern and Midwest U.S., severe weather events in Texas and other Southern and Central U.S. states, wildfires in Hawaii, Hurricanes Idalia and Otis, Storm Ciaran, and certain aggregate loss contracts triggered during 2023.
(3)“2022 Weather-Related Large Losses” includes Hurricanes Ian, Fiona and Nicole, floods in Eastern Australia, Storm Eunice, severe weather in France, typhoons in Asia, Winter Storm Elliott, and loss estimates associated with certain aggregate loss contracts.
(4)“2021 Weather-Related Large Losses” includes Winter Storm Uri, European Floods, Hurricane Ida, hail storm in Europe, wildfires in California, tornadoes in the Central and Midwest U.S., the Midwest Derecho, and losses associated with aggregate loss contracts.
F-48
(5)“2020 Weather-Related Large Loss Events” includes Hurricanes Laura, Sally, Isaias, Delta, Zeta and Eta, the California, Oregon and Washington wildfires, Typhoon Maysak, the August 2020 Derecho, and losses associated with aggregate loss contracts.
(6)“2019 Large Loss Events” includes Hurricane Dorian and Typhoons Faxai and Hagibis and certain losses associated with aggregate loss contracts.
(7)“2018 Large Loss Events” includes Typhoons Jebi, Mangkhut and Trami, Hurricanes Florence and Michael, wildfires in California, and certain losses associated with aggregate loss contracts.
(8)“2017 Large Loss Events” includes Hurricanes Harvey, Irma and Maria, the Mexico City Earthquake, wildfires in California and certain losses associated with aggregate loss contracts.
(9)In 2025, total small catastrophe events and attritional loss movements included amortization of fair value adjustments of $10.3 million, principally related to the Validus Acquisition (2024 - $15.2 million, 2023 - $4.0 million).
2025
The net favorable development of prior accident years net claims and claim expenses on the large catastrophe events was primarily driven by better than expected loss emergence across the 2017 to 2024 accident years.
The net favorable development on small catastrophe events and attritional loss movements was primarily related to lines of business where the Company principally estimates net claims and claim expenses using traditional actuarial methods.
2024
The net favorable development of prior accident years net claims and claim expenses on the large catastrophe events was driven by better than expected loss emergence across the 2017 to 2023 accident years.
The net favorable development on small catastrophe events and attritional loss movements was primarily related to lines of business where the Company principally estimates net claims and claim expenses using traditional actuarial methods. Partially offsetting these net favorable developments was net adverse development related to actuarial assumption changes.
2023
The net favorable development of prior accident years net claims and claim expenses was driven by better than expected loss emergence.
The net favorable development on small catastrophe events and attritional loss movements was related to lines of business where the Company principally estimates net claims and claim expenses using traditional actuarial methods. Partially offsetting these net favorable developments was net adverse development related to actuarial assumption changes.
Casualty and Specialty Segment
The following table details the net (favorable) adverse development of prior accident years net claims and claim expenses of the Company’s prior accident years net claims and claim expenses for its Casualty and Specialty segment:
| Year ended December 31, | 2025 | 2024 | 2023 | ||||||||||||||||||||
Actuarial methods - actual reported claims less than expected claims (1) | $ | ( | $ | ( | $ | ( | |||||||||||||||||
Actuarial assumption changes | |||||||||||||||||||||||
| Total net (favorable) adverse development of prior accident years net claims and claim expenses | $ | ( | $ | ( | $ | ( | |||||||||||||||||
(1)In 2025, actuarial methods included amortization of fair value adjustments of $30.8 million, principally related to the Validus Acquisition (2024 - $44.7 million, 2023 - $15.6 million).
The Company principally estimates net claims and claim expenses for the Casualty and Specialty segment using traditional actuarial methods.
F-49
The net favorable development of prior accident years net claims and claim expenses during the three-year period ended December 31, 2025 was primarily due to reported losses generally coming in lower than expected on attritional net claims and claim expenses and was driven by favorable experience within the Company’s other specialty, credit and professional liability classes of business, partially offset by adverse experience in general liability.
Reconciliation of the Disclosure of Incurred and Paid Claims Development to the Reserve for Claims and Claim Expenses
The reconciliation of the net incurred and paid claims development tables to the reserve for claims and claim expenses in the consolidated balance sheet is as follows:
| At December 31, 2025 | |||||||||||
| Net Reserve for Claims and Claim Expenses | |||||||||||
| Property | $ | ||||||||||
Casualty and Specialty | |||||||||||
Net reserve for claims and claim expenses | $ | ||||||||||
| Reinsurance Recoverable | |||||||||||
Property | $ | ||||||||||
Casualty and Specialty | |||||||||||
Reinsurance recoverable | |||||||||||
Reserve for claims and claim expenses | $ | ||||||||||
Historical Claims Duration
The following is unaudited supplementary information about average historical claims duration by segment:
Average Annual Percentage Payout of Incurred Claims by Age, Net of Reinsurance (Number of Years) | |||||||||||||||||||||||||||||||||||||||||||||||||||||||||||||||||
| At December 31, 2025 | 1 | 2 | 3 | 4 | 5 | 6 | 7 | 8 | 9 | 10 | |||||||||||||||||||||||||||||||||||||||||||||||||||||||
| Property | % | % | % | % | % | % | % | % | % | ( | % | ||||||||||||||||||||||||||||||||||||||||||||||||||||||
Casualty and Specialty | % | % | % | % | % | % | % | % | % | % | |||||||||||||||||||||||||||||||||||||||||||||||||||||||
Claims Frequency
Both of the Company’s reportable segments are broadly considered to be reinsurance, where multiple claims are often aggregated, perhaps multiple times through retrocessional reinsurance, before ultimately being ceded to the Company. The nature, size, terms and conditions of contracts entered into by the Company changes from one accident year to the next, as do the quantum of contractual or policy limits, and accordingly the potential amount of claims and claim expenses associated with a reported claim, can range from nominal, to significant. These factors can impact the amount and timing of the claims and claim expenses to be recorded and accordingly, developing claim frequency information is highly subjective and is not prepared or utilized for internal purposes. In recent years, the Company has grown its Casualty and Specialty segment where a significant amount of the premium and net reserves come from proportional contracts. The Company does not have direct access to claim frequency information underlying certain of its proportional contracts given the nature of that business. In addition, the Company completed the acquisition of Validus on November 1, 2023. Historically, Validus has not kept nor had access to claim count and frequency information. As providing any claim count and frequency information would exclude the entirety of the legacy Validus portfolio as well as all proportional contracts for the Company, the Company has determined that it is impracticable to provide this information.
F-50
Assumed Reinsurance Contracts Classified As Deposit Contracts
Included in other income (loss) during 2025 was $0.2 million related to income earned on assumed reinsurance contracts that were classified as deposit contracts with underwriting risk only (2024 - $0.2 million, 2023 - $0.2 million). Deposit liabilities of $3.3 million are included in reinsurance balances payable at December 31, 2025 (2024 - $3.5 million).
NOTE 9. DEBT AND CREDIT FACILITIES
The agreements governing the Company’s debt obligations and credit facilities contain certain customary representations, warranties and covenants. At December 31, 2025, the Company believes that it was in compliance with its debt covenants.
Debt Obligations
A summary of the Company’s debt obligations on its consolidated balance sheets is set forth below:
| December 31, 2025 | December 31, 2024 | ||||||||||||||||||||||||||||
| Fair Value | Carrying Value | Fair Value | Carrying Value | ||||||||||||||||||||||||||
| $ | $ | $ | $ | ||||||||||||||||||||||||||
| Total senior notes | |||||||||||||||||||||||||||||
Medici Revolving Credit Facility (5) | |||||||||||||||||||||||||||||
| Total debt | $ | $ | $ | $ | |||||||||||||||||||||||||
(1)RenaissanceRe owns a noncontrolling economic interest in its joint venture Fontana. Because RenaissanceRe controls a majority of Fontana’s issued voting shares, the consolidated financial statements of Fontana are included in the consolidated financial statements of RenaissanceRe. RenaissanceRe has not provided any financial or other support to Fontana that it was not contractually required to provide. RenaissanceRe’s financial exposure to Fontana is limited to its investment in Fontana’s shares and counterparty credit risk arising from reinsurance transactions.
(2)RenaissanceRe owns a noncontrolling economic interest in its joint venture DaVinci. Because RenaissanceRe controls a majority of DaVinci’s issued voting shares, the consolidated financial statements of DaVinci are included in the consolidated financial statements of RenaissanceRe. However, RenaissanceRe does not guarantee or provide credit support for DaVinci and RenaissanceRe’s financial exposure to DaVinci is limited to its investment in DaVinci’s shares and counterparty credit risk arising from reinsurance transactions.
(3)The 3.700 % Senior Notes due 2025 were repaid in full at maturity on April 1, 2025.
(4)The 4.750 % Senior Notes due 2025 (DaVinci) were repaid in full at maturity on May 1, 2025.
(5)RenaissanceRe owns a noncontrolling economic interest in Medici. Because RenaissanceRe controls all of Medici’s issued voting shares, the financial statements of Medici are included in RenaissanceRe’s consolidated financial statements. On December 18, 2025, the Medici Revolving Credit Facility was terminated.
On November 3, 2025, Fontana Holdings L.P. issued $100.0 million principal amount of its 7.003 % Senior Notes due November 1, 2035, with interest on the notes payable on February 1, May 1, August 1 and November 1, commencing with February 1, 2026 (the “2035 Fontana Senior Notes”). The 2035 Fontana Senior Notes, which are senior obligations, may be redeemed at par at any time after November 1, 2030. The 2035 Fontana Senior Notes contain various covenants including restrictions as to the disposition of, and the placing of liens on, the stock of designated subsidiaries, limitations on mergers, amalgamations and consolidations, a leverage covenant and a covenant to maintain certain ratings. The net proceeds from this offering were used for general corporate purposes.
F-51
On March 5, 2025, DaVinciRe Holdings Ltd. (“DaVinci”) issued $300.0 million principal amount of its 5.950 % Senior Notes due April 15, 2035, with interest on the notes payable on April 15 and October 15, commencing with October 15, 2025 (the “2035 DaVinci Senior Notes”). The 2035 DaVinci Senior Notes, which are senior obligations, may be redeemed prior to maturity, subject to the payment of a “make-whole” premium if the notes are redeemed before January 15, 2035. The 2035 DaVinci Senior Notes contain various covenants including restrictions as to the disposition of, and the placing of liens on, the stock of designated subsidiaries, limitations on mergers, amalgamations and consolidations, limitations on third-party investor redemptions, a leverage covenant and a covenant to maintain certain ratings. The net proceeds from this offering were used to repay, in full, the $150.0 million outstanding principal amount of DaVinci’s 4.750 % Senior Notes due 2025 at maturity on May 1, 2025, and the remainder of the net proceeds were used for general corporate purposes.
On February 25, 2025, the Company issued $500.0 million of its 5.800 % Senior Notes due April 1, 2035, with interest on the notes payable on April 1 and October 1 of each year, commencing on October 1, 2025. The notes are redeemable at the applicable redemption price, subject to the terms described in the indenture for the notes. However, the notes (i) may not be redeemed at any time prior to February 25, 2028 without approval of the Bermuda Monetary Authority (the “BMA”) and (ii) may not be redeemed or repaid at any time if enhanced capital requirements, as established by the BMA, would be breached immediately before or after giving effect to the redemption or repayment of such notes, unless, in each case, RenaissanceRe replaces the capital represented by the notes to be redeemed or repaid with capital having equal or better capital treatment as the notes under applicable BMA rules. The notes contain various covenants including limitations on mergers and consolidations, and restrictions as to the disposition of, and the placing of liens on, the stock of designated subsidiaries. The Company received net proceeds of approximately $493.5 million from the offering of senior notes after deducting the underwriting discounts and estimated offering expenses payable by the Company.
On June 5, 2023, the Company issued $750.0 million of its 5.750 % Senior Notes due June 5, 2033, with interest on the notes payable on June 5 and December 5 of each year, commencing on December 5, 2023. The notes are redeemable at the applicable redemption price, subject to the terms described in the indenture for the notes. However, the notes (i) may not be redeemed at any time prior to June 5, 2026 without approval of the BMA and (ii) may not be redeemed or repaid at any time if enhanced capital requirements, as established by the BMA, would be breached immediately before or after giving effect to the redemption or repayment of such notes, unless, in each case, RenaissanceRe replaces the capital represented by the notes to be redeemed or repaid with capital having equal or better capital treatment as the notes under applicable BMA rules. The notes contain various covenants including limitations on mergers and consolidations, and restrictions as to the disposition of, and the placing of liens on, the stock of designated subsidiaries. The Company received net proceeds of approximately $741.0 million from the offering of senior notes after deducting the underwriting discounts and estimated offering expenses payable by the Company. The Company used the net proceeds from this offering to fund a portion of the cash consideration for the Validus Acquisition, which closed on November 1, 2023, to pay related costs and expenses, and for general corporate purposes. See “Note 3. Acquisition of Validus” for additional information regarding the Validus Acquisition.
On April 2, 2019, RenaissanceRe issued $400.0 million principal amount of its 3.600 % Senior Notes due April 15, 2029, with interest on the notes payable on April 15 and October 15 of each year, commencing on October 15, 2019. The notes are redeemable at the applicable redemption price, subject to the terms described in the indenture for the notes. However, the notes may not be redeemed at any time prior to their maturity if enhanced capital requirements, as established by the BMA, would be breached immediately before or after giving effect to the redemption of such notes, unless, in each case, RenaissanceRe replaces the capital represented by the notes to be redeemed with capital having equal or better capital treatment as the notes under applicable BMA rules. The notes contain various covenants including limitations on mergers
F-52
and consolidations, and restrictions as to the disposition of, and the placing of liens on, the stock of designated subsidiaries. The net proceeds from this offering were used to repay, in full, the $200.0 million outstanding under the Company’s revolving credit facility at March 31, 2019, which the Company used to partially fund the purchase price for the TMR Stock Purchase, and the remainder of the net proceeds was used for general corporate purposes.
On June 29, 2017, RenaissanceRe Finance Inc. (“RenaissanceRe Finance”) issued $300.0 million principal amount of its 3.450 % Senior Notes due July 1, 2027, with interest on the notes payable on July 1 and January 1 of each year. The notes are fully and unconditionally guaranteed by RenaissanceRe and may be redeemed by RenaissanceRe Finance prior to maturity, subject to the payment of a “make-whole” premium if the notes are redeemed prior to April 1, 2027. The notes contain various covenants, including limitations on mergers and consolidations, and restrictions as to the disposition of, and the placing of liens on, stock of designated subsidiaries.
On March 24, 2015, RenaissanceRe Finance issued $300.0 million principal amount of its 3.700 % Senior Notes due April 1, 2025, with interest on the notes payable on April 1 and October 1 of each year. The notes were fully and unconditionally guaranteed by RenaissanceRe. On April 1, 2025, RenaissanceRe Finance repaid in full at maturity the aggregate principal amount of $300.0 million, plus applicable accrued interest, of the 3.700 % Senior Notes due 2025.
DaVinci Senior Notes
On May 4, 2015, DaVinci issued $150.0 million principal amount of its 4.750 % Senior Notes due May 1, 2025, with interest on the notes payable on May 1 and November 1, commencing with November 1, 2015 (the “DaVinci Senior Notes”). On May 1, 2025, DaVinci repaid in full at maturity the aggregate principal amount of $150.0 million, plus applicable accrued interest of the 4.750 % DaVinci Senior Notes.
Scheduled Debt Maturity
The following table sets forth the scheduled maturity of the Company’s aggregate amount of its debt obligation reflected on its consolidated balance sheet at December 31, 2025:
| 2026 | $ | ||||||||||
| 2027 | |||||||||||
| 2028 | |||||||||||
| 2029 | |||||||||||
| 2030 | |||||||||||
| After 2030 | |||||||||||
| Unamortized discount and debt issuance expenses | ( | ||||||||||
| $ | |||||||||||
F-53
Credit Facilities
The outstanding amounts issued or drawn under each of the Company’s significant credit facilities are set forth below:
| At December 31, 2025 | Issued or Drawn | ||||||||||
Revolving Credit Facility (1) | $ | ||||||||||
Medici Revolving Credit Facility (2) | |||||||||||
Bilateral Letter of Credit Facilities | |||||||||||
Secured | |||||||||||
Unsecured | |||||||||||
| $ | |||||||||||
(1)At December 31, 2025, no amounts were issued or drawn under this facility.
RenaissanceRe Revolving Credit Facility
RenaissanceRe, Renaissance Reinsurance Ltd. (“Renaissance Reinsurance”), RenaissanceRe Specialty U.S. Ltd. (“RenaissanceRe Specialty U.S.”), Renaissance Reinsurance U.S. Inc. (“Renaissance Reinsurance U.S.”) and RenaissanceRe Europe AG (“RREAG”) are parties to a third amended and restated credit agreement dated November 18, 2022 (the “Revolving Credit Agreement”) with various banks, financial institutions and Wells Fargo Bank, National Association (“Wells Fargo”) as administrative agent, which amended and restated a previous credit agreement. The Revolving Credit Agreement provides for a revolving commitment to RenaissanceRe of $500.0 million, with a right, subject to satisfying certain conditions, to increase the size of the facility to $700.0 million. Amounts borrowed under the Revolving Credit Agreement bear interest at a rate selected by RenaissanceRe equal to the Base Rate or Term SOFR (each as defined in the Revolving Credit Agreement) plus a margin. In addition to revolving loans, the Revolving Credit Agreement provides that the entire facility will also be available for the issuance of standby letters of credit, subject to the terms and conditions set forth therein, and swingline loans, which are capped at $50.0 million for each of the swingline lenders. At December 31, 2025, RenaissanceRe had $Nil outstanding under the Revolving Credit Agreement.
The Revolving Credit Agreement contains representations, warranties and covenants customary for bank loan facilities of this type, including limits on the ability of RenaissanceRe and its subsidiaries to merge, consolidate, sell a substantial amount of assets, incur liens and declare or pay dividends under certain circumstances. The Revolving Credit Agreement also contains certain financial covenants which generally provide that the ratio of consolidated debt to capital shall not exceed 0.35 :1 and that the consolidated net worth of RenaissanceRe shall equal or exceed approximately $4.0 billion, subject to an annual adjustment.
If certain events of default occur, in some circumstances the lenders’ obligations to make loans may be terminated and the outstanding obligations of RenaissanceRe under the Revolving Credit Agreement may be accelerated. The scheduled commitment maturity date of the Revolving Credit Agreement is November 18, 2027.
RenaissanceRe Finance guarantees RenaissanceRe’s obligations under the Revolving Credit Agreement. Subject to certain exceptions, additional subsidiaries of RenaissanceRe are required to become guarantors if such subsidiaries issue or incur certain types of indebtedness.
Bilateral Letter of Credit Facilities
Uncommitted, Secured Standby Letter of Credit Facility with Wells Fargo
RenaissanceRe and certain of its subsidiaries and affiliates, including Renaissance Reinsurance, DaVinci Reinsurance Ltd. (“DaVinci Reinsurance”), Renaissance Reinsurance U.S., RREAG and RenaissanceRe Specialty U.S. were parties to an Amended and Restated Standby Letter of Credit Agreement dated June 21, 2019, as amended, with Wells Fargo, which provided for a secured, uncommitted facility under which
F-54
letters of credit may be issued from time to time for the respective accounts of the subsidiaries. On April 23, 2025, RenaissanceRe terminated the Wells Fargo Standby Letter of Credit Facility.
Secured Letter of Credit Facility with Citibank Europe
Certain subsidiaries and affiliates of RenaissanceRe, including Renaissance Reinsurance, DaVinci Reinsurance, Renaissance Reinsurance of Europe Designated Activity Company (“Renaissance Reinsurance of Europe DAC”) and RenaissanceRe Specialty U.S., are parties to a facility letter, dated December 19, 2022, as amended, with Citibank Europe plc (“Citibank Europe”), pursuant to which Citibank Europe has established a letter of credit facility under which Citibank Europe provides a commitment to issue letters of credit for the accounts of the participants in multiple currencies. On November 1, 2023, the aggregate committed amount of the facility was increased from $180.0 million to $320.0 million, with a right, subject to satisfying certain conditions, to increase the size of the facility to $350.0 million.
The letter of credit facility is scheduled to expire on December 31, 2027. At all times during which it is a party to the facility, each participant is obligated to pledge to Citibank Europe securities with a value that equals or exceeds the aggregate face amount of its then-outstanding letters of credit. In the case of an event of default under the facility with respect to a participant, Citibank Europe may exercise certain remedies, including terminating its commitment to such participant and taking certain actions with respect to the collateral pledged by such participant (including the sale thereof). In the facility letter, each participant makes representations and warranties that are customary for facilities of this type and agrees that it will comply with certain informational and other undertakings.
At December 31, 2025, $198.2 million aggregate face amount of letters of credit was outstanding and $121.8 million remained unused and available to the participants under this facility.
Uncommitted, Unsecured Letter of Credit Facility with Citibank Europe
Renaissance Reinsurance, RenaissanceRe Specialty U.S., Renaissance Reinsurance U.S. and RREAG are parties to a Master Agreement for Issuance of Payment Instruments and a Facility Letter for Issuance of Payment Instruments with Citibank Europe dated March 22, 2019, as amended, which established an uncommitted, unsecured letter of credit facility pursuant to which Citibank Europe or one of its correspondents may issue standby letters of credit or similar instruments in multiple currencies for the account of one or more of the applicants. The obligations of the applicants under this facility are guaranteed by RenaissanceRe.
Pursuant to the master agreement, each applicant makes representations and warranties that are customary for facilities of this type and agrees that it will comply with certain informational and other customary undertakings. The master agreement contains events of default customary for facilities of this type. In the case of an event of default under the facility, Citibank Europe may exercise certain remedies, including requiring that the relevant applicant pledge cash collateral in an amount equal to the maximum actual and contingent liability of the issuing bank under the letters of credit and similar instruments issued for such applicant under the facility, and taking certain actions with respect to the collateral pledged by such applicant (including the sale thereof). In addition, Citibank Europe may require that the relevant applicant pledge cash collateral if certain minimum ratings are not satisfied.
At December 31, 2025, the aggregate face amount of the payment instruments issued and outstanding under this facility was $241.3 million.
Unsecured Letter of Credit Facility with Credit Suisse
RREAG, Renaissance Reinsurance and RenaissanceRe were parties to a letter of credit facility agreement with Credit Suisse (Switzerland) Ltd. (“Credit Suisse”) dated December 16, 2021, as amended, and which provided for a $200.0 million committed, unsecured letter of credit facility pursuant to which Credit Suisse (or any other fronting bank acting on behalf of Credit Suisse) may issue letters of credit or similar instruments in multiple currencies for the account of RREAG or Renaissance Reinsurance. The obligations of RREAG and Renaissance Reinsurance under the agreement were guaranteed by RenaissanceRe. The facility was allowed to expire in accordance with its terms on December 31, 2024.
F-55
Uncommitted, Unsecured Standby Letter of Credit Facility with Nordea
RREAG, Renaissance Reinsurance and RenaissanceRe are parties to a standby letter of credit agreement with Nordea Bank Abp, New York Branch (“Nordea”) dated October 3, 2024 which provides for an uncommitted, unsecured facility pursuant to which Nordea may issue standby letters of credit in multiple currencies for the accounts of RREAG and Renaissance Reinsurance. Pursuant to the agreement, RREAG and Renaissance Reinsurance may request letters of credit up to an aggregate amount of $250.0 million. The obligations of RREAG and Renaissance Reinsurance under the agreement are guaranteed by RenaissanceRe.
At December 31, 2025, letters of credit issued by Nordea under the agreement were outstanding in the face amount of $81.0 million.
Uncommitted Letter of Credit Facility with Société Générale
Renaissance Reinsurance was a party to a letter of credit reimbursement agreement with Société Générale, New York Branch (“SocGen”), dated September 8, 2022, which provided for a $250.0 million uncommitted letter of credit facility under which Renaissance Reinsurance was able to request either secured or unsecured letters of credit in multiple currencies. On December 17, 2025, Renaissance Reinsurance terminated the SocGen letter of credit facility.
Vermeer Letter of Credit Facility with Citibank Europe
Vermeer Reinsurance Ltd. (“Vermeer”) is party to an uncommitted, secured letter of credit facility pursuant to which Citibank Europe or one of its correspondents may issue standby letters of credit or similar instruments in multiple currencies for the account of the applicant. The obligations of Vermeer under this facility are not guaranteed by RenaissanceRe.
At December 31, 2025, the aggregate face amount of letters of credit outstanding under this facility was $8.3 million.
Medici
Medici and RenaissanceRe Fund Management Ltd. (“RFM”) were parties to a revolving credit facility, as amended, pursuant to which National Australia Bank Limited provided for a revolving commitment to Medici of $75.0 million. The obligations of Medici and RFM under this facility were not guaranteed by RenaissanceRe. On December 18, 2025, Medici and RFM terminated this facility.
Top Layer
Renaissance Reinsurance is party to a collateralized letter of credit and reimbursement agreement in the amount of $37.5 million that supports the Company’s Top Layer joint venture. Renaissance Reinsurance is obligated to make a mandatory capital contribution of up to $50.0 million in the event that a loss reduces Top Layer’s capital below a specified level.
NOTE 10. NONCONTROLLING INTERESTS
A summary of the Company’s redeemable noncontrolling interests on its consolidated balance sheets is set forth below:
| At December 31, | 2025 | 2024 | |||||||||||||||
| Redeemable noncontrolling interest - DaVinci | $ | $ | |||||||||||||||
Redeemable noncontrolling interest - Medici | |||||||||||||||||
Redeemable noncontrolling interest - Vermeer | |||||||||||||||||
Redeemable noncontrolling interest - Fontana | |||||||||||||||||
| Redeemable noncontrolling interests | $ | $ | |||||||||||||||
F-56
A summary of the Company’s redeemable noncontrolling interests on its consolidated statements of operations is set forth below:
| Year ended December 31, | 2025 | 2024 | 2023 | ||||||||||||||||||||
| Redeemable noncontrolling interest - DaVinci | $ | $ | $ | ||||||||||||||||||||
Redeemable noncontrolling interest - Medici | |||||||||||||||||||||||
Redeemable noncontrolling interest - Vermeer | |||||||||||||||||||||||
Redeemable noncontrolling interest - Fontana | |||||||||||||||||||||||
| Net income (loss) attributable to redeemable noncontrolling interests | $ | $ | $ | ||||||||||||||||||||
Redeemable Noncontrolling Interest – DaVinci
DaVinci is a managed joint venture formed by RenaissanceRe principally to write property catastrophe reinsurance and certain casualty and specialty reinsurance lines of business on a global basis through its wholly-owned subsidiary, DaVinci Reinsurance. DaVinci is considered a VIE as the voting rights of its equity holders are not proportional to their obligations to absorb losses and rights to receive residual returns. The Company is the primary beneficiary of DaVinci, as it has the power to direct the activities of DaVinci that most significantly impact its economic performance, and has the obligation to absorb losses and the right to receive benefits that could potentially be significant to DaVinci. Accordingly, the Company consolidates DaVinci and all significant intercompany transactions have been eliminated. The portion of DaVinci’s earnings owned by third parties is recorded in the consolidated statements of operations as net income (loss) attributable to redeemable noncontrolling interests.
DaVinci shareholders are party to a shareholders’ agreement which provides DaVinci shareholders, excluding RenaissanceRe, with certain redemption rights that enable each shareholder to notify DaVinci of such shareholder’s desire for DaVinci to repurchase up to half of such shareholder’s initial aggregate number of shares held, subject to certain limitations, such as limiting the aggregate of all share repurchase requests to 25 % of DaVinci’s capital in any given year and satisfying all applicable regulatory requirements. If total shareholder requests exceed 25 % of DaVinci’s capital, the number of shares repurchased will be reduced among the requesting shareholders pro-rata, based on the amounts desired to be repurchased. Shareholders desiring to have DaVinci repurchase their shares must notify DaVinci before March 1 of each year. The repurchase price will be based on GAAP book value as of the end of the year in which the shareholder notice is given, and the repurchase will be effective as of December 31 of that year. The repurchase price can be subject to a holdback and true-up for potential development on loss reserves. Similarly, when shares are issued by DaVinci and sold to DaVinci shareholders, the sale price is based on GAAP book value and can be subject to a true-up for potential development on loss reserves. The Company has not provided any financial or other support to DaVinci that it was not contractually required to provide.
2025
During 2025, RenaissanceRe sold an aggregate of $69.7 million of its shares in DaVinci to third-party investors and purchased an aggregate of $26.9 million of shares from other third-party investors.
The timing of cash flows associated with equity capital transactions can vary from one period to the next. During 2025, RenaissanceRe received no cash inflows from subscriptions of shares in DaVinci by third-party investors, and paid $26.9 million as a result of redemptions of shares from and distributions to third-party investors.
At December 31, 2025, DaVinci’s standalone consolidated balance sheet included total assets and total liabilities of $7.2 billion and $2.3 billion, respectively (2024 - $6.1 billion and $2.0 billion, respectively). The total assets included $6.2 billion of investments and $978.5 million of all other aggregated assets (2024 - $5.3 billion and $805.4 million, respectively). The total liabilities included $1.5 billion of reserve for claims and claim expenses, $297.0 million of debt and $554.8 million of all other aggregated liabilities (2024 - $1.4 billion, $149.9 million and $440.7 million, respectively). The Company’s noncontrolling economic ownership in DaVinci was 24.3 % at December 31, 2025 (2024 - 25.4 %).
F-57
Refer to “Note 21. Subsequent Events” for additional information related to the Company’s noncontrolling economic ownership in DaVinci subsequent to December 31, 2025.
2024
During 2024, RenaissanceRe sold an aggregate of $300.0 million of its shares in DaVinci to third-party investors and purchased an aggregate of $225.9 million of shares from other third-party investors. In addition, DaVinci distributed $180.6 million to third-party investors and $69.4 million to the Company.
During 2024, RenaissanceRe received cash inflows of $69.7 million from subscriptions of shares in DaVinci by third-party investors, and paid $225.9 million as a result of redemptions of shares from and distributions to third-party investors.
The Company expects its noncontrolling economic ownership in DaVinci to fluctuate over time.
The activity in redeemable noncontrolling interest – DaVinci is detailed in the table below:
| Year ended December 31, | 2025 | 2024 | |||||||||||||||
| Beginning balance | $ | $ | |||||||||||||||
Redemption of shares from redeemable noncontrolling interests | ( | ( | |||||||||||||||
Sale of shares to redeemable noncontrolling interests, net of adjustments | |||||||||||||||||
Net income (loss) attributable to redeemable noncontrolling interest | |||||||||||||||||
| Ending balance | $ | $ | |||||||||||||||
Redeemable Noncontrolling Interest - Medici
Medici is an exempted company, incorporated in Bermuda and registered as an institutional fund. Medici invests, primarily on behalf of third-party investors, in various instruments that have returns primarily tied to property catastrophe risk. Medici is considered a VIE as the voting rights of its equity holders are not proportional to their obligations to absorb losses and rights to receive residual returns. The Company is the primary beneficiary of Medici, as it has the power to direct the activities of Medici that most significantly impact its economic performance, and has the obligation to absorb losses and the right to receive benefits that could potentially be significant to Medici. Accordingly, the Company consolidates Medici and all significant intercompany transactions have been eliminated. The portion of Medici’s earnings owned by third parties is recorded in the consolidated statements of operations as net income (loss) attributable to redeemable noncontrolling interests. Any shareholder may redeem all or any portion of its shares as of the last day of any calendar month, upon at least 30 calendar days’ prior irrevocable written notice to Medici. RenaissanceRe, Medici and RFM are parties to a revolving credit facility pursuant to which RenaissanceRe provides for a revolving commitment to Medici of up to $75.0 million. The Company has not provided any financial or other support to Medici that it was not contractually required to provide.
2025
During 2025, investors subscribed for $258.5 million of the participating, non-voting common shares of Medici, including $50.2 million from the Company. In addition, investors redeemed $804.4 million of the participating, non-voting common shares of Medici, including $200.0 million from the Company. Of the total redemption of $804.4 million, $316.5 million was immediately reinvested in Medici UCITS, including $140.0 million from the Company, and $260.4 million was immediately reinvested in Stratos. Third party investors also received $15.3 million in dividends. Refer to “Note 5. Investments” for additional information related to the Company’s investment in Medici UCITS and “Note 11. Variable Interest Entities” for additional information related to Stratos.
The timing of cash flows associated with equity capital transactions can vary from one period to the next. During 2025, RenaissanceRe received cash inflows of $212.2 million from subscriptions of shares in Medici by third-party investors and paid $639.9 million as a result of redemptions of shares from and dividends to third-party investors.
At December 31, 2025, Medici’s standalone balance sheet included total assets and total liabilities of $1.7 billion and $133.2 million, respectively (2024 - $2.1 billion and $151.1 million, respectively). The total assets
F-58
included $1.7 billion of investments and $23.3 million of all other aggregated assets (2024 - $2.1 billion and $26.7 million, respectively). The total liabilities included $133.2 million of all other aggregated liabilities (2024 - $151.1 million). The Company’s noncontrolling economic ownership in Medici was 11.3 % at December 31, 2025 (2024 - 15.8 %).
Refer to “Note 21. Subsequent Events” for additional information related to the Company’s noncontrolling economic ownership in Medici subsequent to December 31, 2025.
2024
During 2024, investors subscribed for $250.2 million of the participating, non-voting common shares of Medici, including $50.6 million from the Company. In addition, investors redeemed $382.0 million of the participating, non-voting common shares of Medici, including $0.3 million from the Company. Investors also received $24.6 million in dividends.
During 2024, RenaissanceRe received cash inflows of $163.6 million from subscriptions of shares in Medici by third-party investors, and paid $361.8 million as a result of redemptions of shares from and dividends to third-party investors.
The Company expects its noncontrolling economic ownership in Medici to fluctuate over time.
The activity in redeemable noncontrolling interest – Medici is detailed in the table below:
| Year ended December 31, | 2025 | 2024 | |||||||||||||||
| Beginning balance | $ | $ | |||||||||||||||
Redemption of shares from redeemable noncontrolling interests, net of adjustments | ( | ( | |||||||||||||||
Sale of shares to redeemable noncontrolling interests | |||||||||||||||||
Net income (loss) attributable to redeemable noncontrolling interest | |||||||||||||||||
Dividends on common shares | ( | ||||||||||||||||
| Ending balance | $ | $ | |||||||||||||||
Redeemable Noncontrolling Interest – Vermeer
Vermeer is a managed joint venture formed by RenaissanceRe to provide capacity focused on risk remote layers in the U.S. property catastrophe market. RenaissanceRe owns 100 % of the voting non-participating shares of Vermeer, while the sole third-party investor, Stichting Pensioenfonds Zorg en Welzijn (“PFZW”), a pension fund represented by PGGM Vermogensbeheer B.V., a Dutch pension fund manager, owns 100 % of the non-voting participating shares of Vermeer. Vermeer is considered a VIE as the voting rights of its equity holders are not proportional to their obligations to absorb losses and rights to receive residual returns. The Company is the primary beneficiary of Vermeer, as it has power to direct the activities of Vermeer that most significantly impact its economic performance, and has the obligation to absorb losses and the right to receive benefits that could potentially be significant to Vermeer. Accordingly, the Company consolidates Vermeer and all significant intercompany transactions have been eliminated. As PFZW owns all of the participating shares of Vermeer, all of Vermeer’s earnings are allocated to PFZW in the consolidated statements of operations as net income (loss) attributable to redeemable noncontrolling interests. The Company has not provided any financial or other support to Vermeer that it was not contractually required to provide.
2025
During 2025, there were no subscriptions for participating, non-voting common shares of Vermeer. In addition, there were no dividends declared or paid to PFZW.
At December 31, 2025, Vermeer’s standalone balance sheet included total assets and total liabilities of $2.3 billion and $411.4 million, respectively (2024 - $1.9 billion and $93.0 million, respectively). The total assets included $2.0 billion of investments and $332.7 million of all other aggregated assets (2024 - $1.8 billion and $68.5 million, respectively). The total liabilities included $91.2 million of reserve for claims and claim
F-59
expenses and $320.2 million of all other aggregated liabilities (2024 - $34.7 million and $58.4 million, respectively).
Refer to “Note 21. Subsequent Events” for additional information related to capital transactions in Vermeer subsequent to December 31, 2025.
2024
During 2025, Vermeer declared and paid dividends of $175.0 million to PFZW. In addition, PFZW subscribed for $175.0 million of participating, non-voting common shares of Vermeer.
The Company does not expect its noncontrolling economic ownership in Vermeer to fluctuate over time.
The activity in redeemable noncontrolling interest – Vermeer is detailed in the table below:
| Year ended December 31, | 2025 | 2024 | |||||||||||||||
| Beginning balance | $ | $ | |||||||||||||||
Dividends on common shares | ( | ||||||||||||||||
| Sale of shares to redeemable noncontrolling interest | |||||||||||||||||
| Net income (loss) attributable to redeemable noncontrolling interest | |||||||||||||||||
| Ending balance | $ | $ | |||||||||||||||
Redeemable Noncontrolling Interest – Fontana
Fontana Holdings L.P. and its subsidiaries (collectively, “Fontana”) are a managed joint venture formed by the Company to assume casualty and specialty risks in line with the Company’s book of business. Fontana is considered a VIE as the voting rights of its equity holders are not proportional to their obligations to absorb losses and rights to receive residual returns. The Company is the primary beneficiary of Fontana, as it has power to direct the activities of Fontana that most significantly impact its economic performance, and has the obligation to absorb losses and the right to receive benefits that could potentially be significant to Fontana. Accordingly, the Company consolidates Fontana and all significant intercompany transactions have been eliminated. The portion of Fontana’s earnings owned by third parties is recorded in the consolidated statements of operations as net income (loss) attributable to redeemable noncontrolling interests. The Company may be obligated to repurchase all or a portion of the limited partner interest held by limited partners of Fontana upon request, subject to certain restrictions. The Company has not provided any financial or other support to Fontana that it was not contractually required to provide.
2025
During 2025, investors subscribed for $100.0 million of the limited partner interest of Fontana, including $70.8 million from the Company. In addition, RenaissanceRe sold an aggregate of $100.0 million of its limited partner interest in Fontana to other third-party investors and purchased an aggregate of $72.0 million of its limited partner interest in Fontana from other third-party investors.
The timing of cash flows associated with equity capital transactions can vary from one period to the next. During 2025, RenaissanceRe received no cash inflows from subscriptions for the limited partner interest of Fontana by third-party investors, and paid $72.0 million as a result of redemptions of the limited partner interest from third-party investors.
At December 31, 2025, Fontana’s standalone consolidated balance sheet included total assets and total liabilities of $2.9 billion and $2.1 billion, respectively (2024 - $2.2 billion and $1.6 billion, respectively). The total assets included $2.0 billion of investments and $889.0 million of all other aggregated assets (2024 - $1.3 billion and $943.0 million, respectively). The total liabilities included $1.4 billion of reserve for claims and claim expenses, $99.2 million of debt and $620.6 million of all other aggregated liabilities (2024 - $913.1 million, $679.6 million, respectively). The Company’s noncontrolling economic ownership in Fontana was 28.7 % at December 31, 2025 (2024 - 26.5 %).
Refer to “Note 21. Subsequent Events” for additional information related to the Company’s noncontrolling economic ownership in Fontana subsequent to December 31, 2025.
F-60
2024
During 2024, investors subscribed for $100.0 million of the limited partner interest of Fontana, including $50.0 million from the Company. In addition, RenaissanceRe sold an aggregate of $50.0 million of its limited partner interest in Fontana to third-party investors.
During 2024, RenaissanceRe received $129.2 million in subscriptions for the limited partner interest of Fontana by third-party investors.
The Company’s investment in Fontana may fluctuate, perhaps materially, in future quarters.
The activity in redeemable noncontrolling interest – Fontana is detailed in the table below:
| Year ended December 31, | 2025 | 2024 | |||||||||||||||
| Beginning balance | $ | $ | |||||||||||||||
Redemption of shares from redeemable noncontrolling interest | ( | ||||||||||||||||
Sale of limited partner interest to redeemable noncontrolling interest | |||||||||||||||||
| Net income (loss) attributable to redeemable noncontrolling interest | |||||||||||||||||
| Ending balance | $ | $ | |||||||||||||||
NOTE 11. VARIABLE INTEREST ENTITIES
Managed Joint Ventures and Managed Funds
The Company has interests in various managed joint ventures and managed funds that are considered VIEs. The Company consolidates the results of DaVinci, Medici, Vermeer and Fontana, as the Company is deemed to be the primary beneficiary of each of those entities. Refer to “Note 10. Noncontrolling Interests” for additional information on those entities. The Company also consolidates certain segregated accounts of Upsilon RFO Re Ltd. (“Upsilon RFO”), which includes Upsilon RFO Diversified I, II and III, as the Company is deemed to be the primary beneficiary, as detailed below. The assets of DaVinci, Medici, Vermeer, Fontana and Upsilon RFO Diversified I, II and III can only be used to settle their respective obligations. The liabilities of each of those entities are non‑recourse to the Company, and creditors do not have recourse to the general credit of the Company.
Upsilon RFO
Upsilon RFO is an exempted company incorporated in Bermuda. It is registered as a segregated accounts company and as a collateralized insurer. Upsilon RFO currently has four segregated accounts (Upsilon RFO Diversified I, II, III and IV). RenaissanceRe indirectly owns a portion of the participating non-voting preference shares of three of the existing segregated accounts of Upsilon RFO (Upsilon RFO Diversified I, II and III) and all of Upsilon RFO’s voting Class A shares. The shareholders (other than the voting Class A shareholder) participate in all of the profits or losses of Upsilon RFO while their shares remain outstanding. The shareholders (other than the voting Class A shareholder) indemnify Upsilon RFO against losses relating to insurance risk, and therefore these shares have been accounted for as prospective reinsurance under FASB ASC Topic 944, Financial Services - Insurance.
Upsilon RFO is considered a VIE as it has insufficient equity capital to finance its activities without additional financial support. The Company is the primary beneficiary of Upsilon RFO Diversified I, II and III as it has the power to direct the activities of those segregated accounts that most significantly impact their economic performance, and has the obligation to absorb losses and the right to receive benefits that could potentially be significant to those segregated accounts. Accordingly, the Company consolidates Upsilon RFO Diversified I, II and III and all significant intercompany transactions have been eliminated.
The Company is not the primary beneficiary of Upsilon RFO Diversified IV, as it does not have the obligation to absorb losses and the right to receive benefits that could potentially be significant to that segregated account. Accordingly, the Company does not consolidate the financial position or results of operations of Upsilon RFO Diversified IV. The Company does not have, and does not expect to have, a material investment in Upsilon RFO Diversified IV. In addition, the Company expects its absolute and relative ownership in Upsilon RFO Diversified IV to remain minimal.
F-61
Other than its equity investments in Upsilon RFO, the Company has not provided financial or other support to Upsilon RFO that it was not contractually required to provide.
2025
During 2025, and following the release of collateral that was previously held by cedants associated with prior underwriting years’ contracts, Upsilon RFO returned $287.1 million of capital to investors of Upsilon RFO Diversified I, II and III, including $34.5 million to the Company, and returned $36.9 million to investors of Upsilon RFO Diversified IV.
At December 31, 2025, Upsilon’s balance sheet included total assets and total liabilities of Diversified I, II and III of $653.0 million and $652.1 million, respectively (2024 - $1.2 billion and $1.2 billion, respectively). The total assets included $526.8 million of investments and $126.2 million of all other aggregated assets (2024 - $908.6 million and $270.0 million, respectively). The total liabilities included $305.8 million of reserves and $346.3 million of all other aggregated liabilities (2024 - $637.0 million and $540.7 million, respectively). Of the total assets and liabilities of Upsilon RFO Diversified I, II and III, a net amount of $32.7 million (2024 - $60.5 million) is attributable to the Company, and $264.8 million (2024 - $282.2 million) is attributable to third-party investors. Of the total assets and liabilities of Upsilon RFO Diversified IV, a net amount of $101.8 million (2024 - $115.9 million) is attributable to third-party investors. At December 31, 2025, the Company’s participation in the risks assumed by Upsilon RFO Diversified I, II and III was 12.7 % (2024 - 12.7 %).
2024
During 2024, and following the release of collateral that was previously held by cedants associated with prior underwriting years’ contracts, Upsilon RFO returned $397.6 million of capital to investors of Upsilon RFO Diversified I, II and III, including $59.8 million to the Company, and returned $16.3 million of capital to investors of Upsilon RFO Diversified IV.
Upsilon Diversified
RenaissanceRe Upsilon Diversified Fund (“Upsilon Diversified”) is a segregated account of RenaissanceRe Upsilon Fund Ltd. (“Upsilon Fund”), an exempted company incorporated in Bermuda which is registered as a segregated accounts company and a Class A Professional Fund. Upsilon Diversified provides a fund structure through which investors can invest in reinsurance risk managed by the Company, which includes investments in Upsilon RFO and Medici. Upsilon Diversified is considered a VIE as the voting rights of its equity holders are not proportional to their obligations to absorb losses and rights to receive residual returns. The Company is not the primary beneficiary of Upsilon Diversified, as it does not have the obligation to absorb losses and the right to receive benefits that could potentially be significant to Upsilon Diversified. Accordingly, the Company does not consolidate the financial position or results of operations of Upsilon Diversified. Upsilon Diversified meets the definition of an investment company, and accordingly, is required to account for all of its investments, including its investments in Upsilon RFO and Medici, at fair value. The Company does not have, has not previously had, and does not expect to have, a material investment in Upsilon Diversified. In addition, the Company expects its absolute and relative ownership in Upsilon Diversified to remain minimal. Other than its current equity investment in Upsilon Diversified, the Company has not provided financial or other support to Upsilon Diversified that it was not contractually required to provide. The total assets of Upsilon Diversified principally reflect its investment in Upsilon RFO.
2025
During 2025, and following the release of collateral from Upsilon RFO, Upsilon Diversified returned $255.5 million of capital to investors, including $0.4 million to the Company. In addition, third-party investors subscribed for $17.5 million of non-voting preference shares.
The fair value of the Company’s indirect equity ownership in Upsilon Diversified is included in investments in other ventures and was $0.4 million at December 31, 2025 (2024 - $0.5 million). At December 31, 2025, the total assets and total liabilities of Upsilon Diversified were $278.4 million and $42.6 million, respectively (2024 - $440.6 million and $140.9 million, respectively). Upsilon Diversified’s investment in Upsilon RFO was valued at $254.7 million at December 31, 2025 (2024 - $304.0 million).
F-62
2024
During 2024, and following the release of collateral from Upsilon RFO, Upsilon Diversified returned $333.4 million of capital to investors, including $0.5 million to the Company. In addition, third-party investors subscribed for $16.9 million of non-voting preference shares.
NOC1
NOC1 is a segregated account of Upsilon Fund formed in 2023, that provides a fund structure through which investors can invest in a portfolio of insurance-linked securities, principally catastrophe bonds. NOC1 is considered a VIE as the voting rights of its equity holders are not proportional to their obligations to absorb losses and rights to receive residual returns. The Company is not the primary beneficiary of NOC1, as it does not have the obligation to absorb losses and the right to receive benefits that could potentially be significant to NOC1. Accordingly, the Company does not consolidate the financial position or results of operations of NOC1. The Company does not have, and does not expect to have, a material investment in NOC1 and expects its absolute and relative ownership in NOC1 to remain minimal. Other than its current equity investment in NOC1, the Company has not provided financial or other support to NOC1 that it was not contractually required to provide.
2025
The fair value of the Company’s indirect equity ownership in NOC1 is included in investments in other ventures and was $1.9 million at December 31, 2025 (2024 - $1.7 million). At December 31, 2025, the total assets and total liabilities of NOC1 were $192.7 million and $0.5 million, respectively (2024 - $173.4 million and $2.2 million, respectively).
2024
During 2024, investors subscribed for $20.0 million of non-voting preference shares, including $0.2 million from the Company. During 2024, NOC1 redeemed $48.8 million of non-voting preference shares from existing investors, including $0.5 million to the Company.
Stratos
Stratos is a segregated account of Upsilon Fund formed in 2025, that provides a fund structure through which investors can invest in a portfolio of insurance-linked securities, principally catastrophe bonds. Stratos is considered a VIE as the voting rights of its equity holders are not proportional to their obligations to absorb losses and rights to receive residual returns. The Company is not the primary beneficiary of Stratos, as it does not have the obligation to absorb losses and the right to receive benefits that could potentially be significant to Stratos. Accordingly, the Company does not consolidate the financial position or results of operations of Stratos. The Company does not have, and does not expect to have, a material investment in Stratos and expects its absolute and relative ownership in Stratos to remain minimal. The Company has not provided financial or other support to Stratos that it was not contractually required to provide.
2025
During 2025, investors subscribed for $260.4 million of non-voting preference shares. The full amount represented a transfer in kind from existing investors in Medici. At December 31, 2025, the total assets and total liabilities of Stratos were $261.9 million and $0.2 million, respectively.
Mona Lisa Re Ltd.
Mona Lisa Re Ltd. (“Mona Lisa Re”), a Bermuda domiciled special purpose insurer (“SPI”), provides reinsurance capacity to subsidiaries of RenaissanceRe through reinsurance agreements which are collateralized and funded by Mona Lisa Re through the issuance of one or more series of principal-at-risk variable rate notes to third-party investors.
Upon issuance of a series of notes by Mona Lisa Re, all of the proceeds from the issuance are deposited into collateral accounts, separated by series, to fund any potential obligation under the reinsurance agreements entered into with Renaissance Reinsurance and/or DaVinci Reinsurance underlying such
F-63
series of notes. The outstanding principal amount of each series of notes generally will be returned to holders of such notes upon the expiration of the risk period underlying such notes, unless an event occurs which causes a loss under the applicable series of notes, in which case the amount returned will be reduced by such noteholder’s pro rata share of such loss, as specified in the applicable governing documents of such notes. In addition, holders of such notes are generally entitled to interest payments, payable quarterly, as determined by the applicable governing documents of each series of notes.
Mona Lisa Re is considered a VIE as it has insufficient equity capital to finance its activities without additional financial support. The Company is not the primary beneficiary of Mona Lisa Re as it does not have the power to direct the activities of Mona Lisa Re that most significantly impact its economic performance. Accordingly, the financial position and results of operations of Mona Lisa Re are not consolidated by the Company.
The only transactions related to Mona Lisa Re that are recorded in the Company’s consolidated financial statements are the ceded reinsurance agreements entered into by Renaissance Reinsurance and DaVinci Reinsurance which are accounted for as prospective reinsurance under FASB ASC Topic 944, Financial Services - Insurance, and the fair value of the principal-at-risk variable rate notes owned by the Company. Other than its investment in the principal-at-risk variable rate notes of Mona Lisa Re, the Company has not provided financial or other support to Mona Lisa Re that it was not contractually required to provide.
Renaissance Reinsurance and DaVinci Reinsurance have together entered into ceded reinsurance contracts with Mona Lisa Re with ceded premiums written of $56.5 million and $14.1 million, respectively, during 2025 (2024 - $45.2 million and $11.7 million, respectively, 2023 - $32.8 million and $8.2 million, respectively). In addition, Renaissance Reinsurance and DaVinci Reinsurance recognized ceded premiums earned related to the ceded reinsurance contracts with Mona Lisa Re of $63.9 million and $16.0 million, respectively, during 2025 (2024 - $39.5 million and $10.3 million, respectively, 2023 - $32.8 million and $8.2 million, respectively).
At December 31, 2025, the total assets and total liabilities of Mona Lisa Re were $1.1 billion and $1.1 billion, respectively (2024 - $936.1 million and $936.1 million, respectively).
The fair value of the Company’s investment in the principal-at-risk variable rate notes of Mona Lisa Re is included in other investments. Net of third-party investors, the fair value of the Company’s investment in Mona Lisa Re was $3.4 million at December 31, 2025 (2024 - $7.0 million).
Tailwind Re Ltd.
Tailwind Re Ltd. (“Tailwind Re”), a Bermuda domiciled SPI provides reinsurance capacity to subsidiaries of RenaissanceRe through reinsurance agreements which are collateralized and funded by Tailwind Re through the issuance of one or more series of principal-at-risk variable rate notes to third-party investors and the Company. Upon issuance of a series of notes by Tailwind Re, all of the proceeds from the issuance were deposited into collateral accounts, separated by series, to fund any potential obligation under the reinsurance agreements entered into with certain former Validus entities underlying such series of notes. The outstanding principal amount of each series of notes generally will be returned to holders of such notes upon the expiration of the risk period underlying such notes, unless an event occurs which causes a loss under the applicable series of notes, in which case the amount returned will be reduced by such noteholder’s pro rata share of such loss, as specified in the applicable governing documents of such notes. In addition, holders of such notes are generally entitled to interest payments, payable quarterly, as determined by the applicable governing documents of each series of notes.
Tailwind Re is considered a VIE as it has insufficient equity capital to finance its activities without additional financial support. The Company is not the primary beneficiary of Tailwind Re as it does not have the power to direct the activities of Tailwind Re that most significantly impact its economic performance. Accordingly, the financial position and results of operations of Tailwind Re are not consolidated by the Company.
The only transactions related to Tailwind Re that are recorded in the Company’s consolidated financial statements are the ceded reinsurance agreements entered into by certain former Validus entities, which are accounted for as prospective reinsurance under FASB ASC Topic 944, Financial Services - Insurance. The Company fully redeemed its investments in principal-at-risk variable rate notes issued by Tailwind Re in the first quarter of 2024. Subsequently, Tailwind Re has commenced the process of liquidation. The Company has not provided financial or other support to Tailwind Re that it was not contractually required to provide.
F-64
The Company did not renew the ceded reinsurance contracts with Tailwind Re at the January 1, 2025 renewal. The Company recognized ceded premiums written and ceded premiums earned related to the ceded reinsurance contracts with Tailwind Re of $42.7 million and $42.7 million, respectively, during 2024. At December 31, 2025, the total assets and total liabilities of Tailwind Re were negligible (2024 - $416.8 million and $416.8 million, respectively).
AlphaCat
In connection with the Validus Acquisition, the Company acquired AlphaCat Managers Ltd. (“AlphaCat Managers”), which manages third-party capital in various forms, including through closed-end and open-end Bermuda mutual funds and one managed account (collectively, the “AlphaCat Funds”), which currently generates fee income. The AlphaCat Funds are primarily funded by third-party capital investors. The AlphaCat Funds are invested in various risk-linked instruments through variable funding notes issued by AlphaCat Reinsurance Ltd. (“AlphaCat Re”), AlphaCat Master Fund Ltd. and OmegaCat Reinsurance Ltd. (“OmegaCat Re”), which give investors access to a range of property catastrophe risks. Prior to the Validus Acquisition, substantially all of the AlphaCat Funds had received full redemption requests from their investors and capital was being released accordingly, subject to certain constraints. The Company expects to run off the business over a period of time.
The AlphaCat Funds, AlphaCat Re and OmegaCat Re are considered VIEs as the voting rights of their equity holders are not proportional to their obligations to absorb losses and rights to receive residual returns. The Company is not the primary beneficiary of the AlphaCat Funds, AlphaCat Re and OmegaCat Re as it does not have the obligation to absorb losses and the right to receive benefits that could potentially be significant to the AlphaCat Funds, AlphaCat Re and OmegaCat Re. Accordingly, the Company does not consolidate the financial position or results of operations of the AlphaCat Funds, AlphaCat Re and OmegaCat Re. The Company has not provided financial or other support to the AlphaCat Funds, AlphaCat Re and OmegaCat Re that it was not contractually required to provide.
The fair value of the Company’s direct equity ownership in the AlphaCat Funds and AlphaCat Re is included in other investments and was $2.2 million at December 31, 2025 (2024 - $3.6 million). At December 31, 2025, AlphaCat Funds, AlphaCat Re and OmegaCat Re had combined total assets and total liabilities of $1.1 billion and $0.5 billion, respectively (2024 - $3.0 billion and $1.3 billion, respectively).
Fund Investments
The Company’s fund investments represent variable interests in limited partnerships entities with unaffiliated fund managers in the normal course of business. Refer to “Note 5. Investments” for additional information.
NOTE 12. SHAREHOLDERS’ EQUITY
Authorized Capital
The aggregate authorized capital of RenaissanceRe is 325 million shares consisting of 225 million common shares and 100 million preference shares. The following table is a summary of changes in common shares issued and outstanding:
| Year ended December 31, | 2025 | 2024 | 2023 | ||||||||||||||||||||
| (thousands of shares) | |||||||||||||||||||||||
| Beginning balance | |||||||||||||||||||||||
Issuance of shares | |||||||||||||||||||||||
Repurchase of shares | ( | ( | |||||||||||||||||||||
Issuance of performance share and restricted stock awards | |||||||||||||||||||||||
| Ending balance | |||||||||||||||||||||||
F-65
Common Shares
On May 26, 2023, the Company completed an offering of 7,245,000 of its common shares at the public offering price of $192.00 per share. The Company received net proceeds of approximately $1,352 million from the equity offering after deducting the underwriting discounts and estimated offering expenses payable by the Company. The Company used the net proceeds from this offering to fund a portion of the cash consideration for the Validus Acquisition, which closed on November 1, 2023, to pay related costs and expenses, and for general corporate purposes.
On November 1, 2023, the Company issued 1,322,541 of its common shares to AIG pursuant to the Stock Purchase Agreement, as a part of the total consideration for the Validus Acquisition.
See “Note 3. Acquisition of Validus” for additional information regarding the Validus Acquisition.
Preference Shares
Series F Preference Shares
In June 2018, RenaissanceRe raised $250.0 million through the issuance of 10,000 shares of its 5.75 % Series F Preference Shares, $1.00 par value and liquidation preference $25,000 per share (equivalent to 10,000,000 Depositary Shares, each of which represents a 1/1,000th interest in a 5.75 % Series F Preference Share). The 5.75 % Series F Preference Shares may be redeemed at a redemption price of $25,000 per share (equivalent to $25.00 per Depositary Share), plus declared and unpaid dividends, at RenaissanceRe’s option on or after June 30, 2023, provided that no redemption may occur prior to June 30, 2028 unless certain redemption requirements are met.
Series G Preference Shares
In July 2021, RenaissanceRe raised $500.0 million through the issuance of 20,000 shares of its 4.20 % Series G Preference Shares, $1.00 par value and liquidation preference $25,000 per share (equivalent to 20,000,000 Depositary Shares, each of which represents a 1/1,000th interest in a 4.20 % Series G Preference Share). The 4.20 % Series G Preference Shares have no stated maturity date and may be redeemed at a redemption price of $25,000 per share (equivalent to $25.00 per Depositary Share), plus declared and unpaid dividends, at RenaissanceRe’s option on or after July 15, 2026, provided that no redemption may occur prior to July 15, 2026 unless certain redemption requirements are met.
The preference shares have no stated maturity and are not convertible into any other securities of RenaissanceRe. Generally, the preference shares have no voting rights. Whenever dividends payable on the preference shares are in arrears (whether or not such dividends have been earned or declared) in an amount equivalent to dividends for six full dividend periods (whether or not consecutive), the holders of the preference shares, voting as a single class regardless of class or series, will have the right to elect two directors to the Board of Directors of RenaissanceRe.
Dividends
The Board of RenaissanceRe declared quarterly dividends of $0.40
The Board of Directors approved the payment of quarterly dividends on each of the series of RenaissanceRe’s preference shares to preference shareholders of record in the amounts and on the quarterly record dates and dividend payment dates set forth in the prospectus supplement and Certificate of Designation for the applicable series of preference shares, unless and until further action is taken by the Board of Directors. The dividend payment dates for the preference shares will be the first day of March, June, September and December of each year (or if this date is not a business day, on the business day immediately following this date). The record dates for the preference share dividends are one day prior to the dividend payment dates.
The amount of the dividend on the 5.750 % Series F Preference Shares is an amount per share equal to 5.750 % of the liquidation preference per annum (the equivalent to $1,437.50 per 5.750 % Series F
F-66
Preference Share per annum, or $359.375 per 5.750 % Series F Preference Share per quarter, or $1.4375 per Depositary Share per annum, or $0.359375 per Depositary Share per quarter). The amount of the dividend on the 4.20 % Series G Preference Shares is an amount per share equal to 4.20 % of the liquidation preference per annum (the equivalent to $1,050 per 4.20 % Series G Preference Share per annum, or $262.50 per 4.20 % Series G Preference Share per quarter, or $1.05 per Depositary Share per annum, or $0.2625 per quarter).
During 2025, the Company paid $35.4 million in preference share dividends (2024 - $35.4 million, 2023 - $35.4 million) and $74.8 million in common share dividends (2024 - $80.8 million, 2023 - $75.1 million).
Share Repurchases
The Company’s share repurchase program may be effected from time to time, depending on market conditions and other factors, through open market purchases and privately negotiated transactions. On November 5, 2025, RenaissanceRe’s Board approved a renewal of its authorized share repurchase program for an aggregate amount of up to $750.0 million. Unless terminated earlier by RenaissanceRe’s Board, the program will expire when the Company has repurchased the full value of the common shares authorized. During 2025, the Company repurchased and cancelled 6.4 million common shares at an aggregate cost of $1.6 billion and an average price of $247.62 per common share. At December 31, 2025, $539.7 million remained available for repurchase under the share repurchase program. In the future, the Company may authorize additional purchase activities under the currently authorized share repurchase program, increase the amount authorized under the share repurchase program, or adopt additional trading plans. The Company’s decision to repurchase common shares will depend on, among other matters, the market price of the common shares and the capital requirements of the Company.
Refer to “Note 21. Subsequent Events” for additional information related to the share repurchase program subsequent to December 31, 2025.
NOTE 13. EARNINGS PER SHARE
The following table sets forth the computation of basic and diluted earnings per common share:
| Year ended December 31, | 2025 | 2024 | 2023 | ||||||||||||||||||||
| (common shares in thousands) | |||||||||||||||||||||||
| Numerator: | |||||||||||||||||||||||
| Net income (loss) available (attributable) to RenaissanceRe common shareholders | $ | $ | $ | ||||||||||||||||||||
Amount allocated to participating common shareholders (1) | ( | ( | ( | ||||||||||||||||||||
| Net income (loss) allocated to RenaissanceRe common shareholders | $ | $ | $ | ||||||||||||||||||||
| Denominator: | |||||||||||||||||||||||
Denominator for basic income (loss) per RenaissanceRe common share - weighted average common shares (2) | |||||||||||||||||||||||
Per common share equivalents of non-vested shares (2) | |||||||||||||||||||||||
Denominator for diluted income (loss) per RenaissanceRe common share - adjusted weighted average common shares and assumed conversions (2) | |||||||||||||||||||||||
Net income (loss) available (attributable) to RenaissanceRe common shareholders per common share – basic | $ | $ | $ | ||||||||||||||||||||
| Net income (loss) available (attributable) to RenaissanceRe common shareholders per common share – diluted | $ | $ | $ | ||||||||||||||||||||
(1)Represents earnings and dividends attributable to holders of unvested shares issued pursuant to the Company’s stock compensation plans.
(2)In periods for which the Company has net loss allocated to RenaissanceRe common shareholders, the denominator used in calculating net loss attributable to RenaissanceRe common shareholders per common share - basic is also used in calculating net loss attributable to RenaissanceRe common shareholders per common share - diluted.
F-67
NOTE 14. RELATED PARTY TRANSACTIONS AND MAJOR CUSTOMERS
Tower Hill
The Company has equity investments in Tower Hill Holdings Inc. (“Tower Hill”) and certain of its subsidiaries (collectively, the “Tower Hill Companies”), which are accounted for under the equity method of accounting. As a result, the Tower Hill Companies are considered related parties to the Company. The Company has entered into reinsurance agreements with certain subsidiaries and affiliates of Tower Hill and has also entered into reinsurance agreements with respect to business produced by the Tower Hill Companies.
The following table summarizes the significant balances resulting from these reinsurance agreements with the Tower Hill Companies:
| Year ended December 31, | 2025 | 2024 | 2023 | ||||||||||||||||||||
| Net premiums written | $ | $ | $ | ||||||||||||||||||||
| Net premiums earned | |||||||||||||||||||||||
| Net claims and claim expenses incurred | ( | ( | |||||||||||||||||||||
| Acquisition expenses | |||||||||||||||||||||||
| At December 31, | 2025 | 2024 | |||||||||||||||||||||
| Premiums receivable (payable) | $ | $ | |||||||||||||||||||||
| Reserve for claims and claim expenses | |||||||||||||||||||||||
During 2025, the Company received distributions of $32.6 million from the Tower Hill Companies (2024 - $34.4 million, 2023 - $22.6 million).
Top Layer
During 2025, the Company received distributions from Top Layer of $14.0 million (2024 - $16.8 million, 2023 - $7.8 million), and recorded a management fee of $2.5 million (2024 - $3.0 million, 2023 - $3.4 million). The management fee reimburses the Company for services it provides to Top Layer.
Broker Concentration
During 2025, the Company received 81.3 % of its gross premiums written (2024 - 82.1 %, 2023 - 84.3 %) from three brokers. Subsidiaries and affiliates of Aon plc, Marsh & McLennan Companies, Inc. and Arthur J. Gallagher accounted for 34.5 %, 33.8 % and 13.0 %, respectively, of the Company’s gross premiums written in 2025 (2024 - 32.0 %, 36.5 % and 13.6 %, respectively).
NOTE 15. TAXATION
The Company is subject to income taxes in the jurisdictions in which it operates. The significant jurisdictions in which the Company is subject to tax are Bermuda, the U.S., Switzerland, and the U.K. Through December 31, 2024, RenaissanceRe and its Bermuda subsidiaries were not subject to any income or capital gains taxes in Bermuda. As a result of the enactment of the Bermuda Corporate Income Tax Act 2023 (“CIT”) on December 27, 2023, a 15% corporate income tax applies to tax years beginning on or after January 1, 2025 and is applicable to the Company’s Bermuda operations, except for the Bermuda operations of the Company’s joint ventures and managed funds. Furthermore, the Company’s profits generated in Bermuda on or after January 1, 2025 by the Company’s consolidated joint ventures and managed funds, except to the extent those profits are attributable to redeemable noncontrolling interests, are also taxed at 15% as a result of the enactment of Pillar II Rules by many of the jurisdictions in which the Company operates. The Company’s consolidated effective tax rate has increased in 2025 as a result of these changes.
RenaissanceRe Finance and its subsidiaries are subject to income taxes imposed by U.S. federal and state authorities and file a consolidated U.S. federal income tax return. Should RenaissanceRe Finance pay a dividend to its parent, withholding taxes would apply to the extent of current year or accumulated earnings and profits at an expected tax rate of 5.0 %. The Company has not accrued withholding taxes on the
F-68
unremitted earnings of RenaissanceRe Finance to date as there is no intention to remit such earnings. The cumulative amount that would be subject to withholding tax, if distributed, is not practicable to compute.
The Company’s operations in the U.K. and Switzerland are subject to income taxes imposed by the respective jurisdictions in which they operate. Withholding taxes would not be expected to apply to dividends paid to RenaissanceRe from its operations in the U.K. and Switzerland.
Income Tax Expense
The following is a summary of the Company’s income (loss) before taxes allocated between domestic and foreign operations:
| Year ended December 31, | 2025 | 2024 | 2023 | ||||||||||||||||||||
Domestic (Bermuda) (1) | $ | $ | $ | ||||||||||||||||||||
Foreign (1) | |||||||||||||||||||||||
| Income (loss) before taxes | $ | $ | $ | ||||||||||||||||||||
(1)In prior years, the Company disclosed income (loss) before taxes disaggregated by jurisdiction. In 2025, in conjunction with the prospective adoption of ASU 2023-09 and the January 1, 2025 effective date of the CIT, the Company revised its presentation to disclose income (loss) before taxes disaggregated between Bermuda and foreign jurisdictions. This change is intended to more accurately reflect the geographic location where income (loss) before taxes is earned. Prior period amounts have been conformed to the current year presentation for comparability.
Income tax benefit (expense) is comprised as follows:
| Year ended December 31, | 2025 | 2024 | 2023 | ||||||||||||||||||||
| Current income tax benefit (expense) | |||||||||||||||||||||||
Federal (Bermuda) (1) | $ | ( | $ | $ | |||||||||||||||||||
| Foreign | ( | ( | ( | ||||||||||||||||||||
| Total current income tax benefit (expense) | ( | ( | ( | ||||||||||||||||||||
| Deferred income tax benefit (expense) | |||||||||||||||||||||||
Federal (Bermuda) (1) | ( | ( | |||||||||||||||||||||
| Foreign | ( | ||||||||||||||||||||||
| Total deferred income tax benefit (expense) | ( | ||||||||||||||||||||||
| Total income tax benefit (expense) | $ | ( | $ | ( | $ | ||||||||||||||||||
(1)All Bermuda income taxes are levied by the Government of Bermuda and are considered federal income taxes in the context of FASB ASC 740, Income Taxes. As none of the parishes of Bermuda impose an income tax, the Company has not incurred any Bermuda state income tax benefit (expense).
The Company’s effective income tax rate, which it calculates as income tax benefit (expense) divided by income (loss) before taxes, may fluctuate from period to period depending on the geographic distribution of pre-tax income (loss) in any given period between different jurisdictions and the varying tax rates in each jurisdiction. The geographic distribution of pre-tax income (loss) can vary significantly between periods due to, but not limited to, the following factors: the business mix of net premiums written and earned; the geographic location, the size and the nature of net claims and claim expenses incurred; the amount and geographic location of operational expenses, net investment income, and net realized and unrealized gains (losses) on investments. A significant portion of the Company’s gross and net premiums are written and earned in Bermuda, which, prior to 2025, did not have a corporate income tax, resulting in a minimal income tax impact on the Company’s operations. As a result of the enactment of the CIT, the Company’s profits generated on or after January 1, 2025 in Bermuda (except for profits earned by the Company’s joint ventures and managed funds) are subject to a 15% corporate income tax. Furthermore, the profits generated in Bermuda on or after January 1, 2025 by its consolidated joint ventures and managed funds, except to the extent those profits are attributable to redeemable noncontrolling interests, are generally taxed at 15% as a result of the enactment of Pillar II Rules by many of the jurisdictions in which the Company operates.
F-69
A reconciliation of the difference between the provision for income taxes and the expected tax provision at the Bermuda statutory tax rate for 2025 after the adoption of ASU 2023-09 is as follows:
| Year ended December 31, | 2025 | ||||||||||||||||
| $ | % | ||||||||||||||||
| Expected income tax benefit (expense) at Bermuda statutory tax rate | $ | ( | % | ||||||||||||||
Nontaxable or nondeductible items | |||||||||||||||||
| Nontaxable income attributable to noncontrolling interests | ( | % | |||||||||||||||
| Subtotal | ( | % | |||||||||||||||
Other nontaxable or nondeductible items | |||||||||||||||||
Other nontaxable income earned by excluded entities | ( | % | |||||||||||||||
Other | ( | % | |||||||||||||||
| Foreign tax effects | |||||||||||||||||
U.K. | |||||||||||||||||
Pillar II top-up tax | ( | % | |||||||||||||||
| Change in valuation allowance | ( | % | |||||||||||||||
| Other | ( | % | |||||||||||||||
Luxembourg | |||||||||||||||||
| Change in valuation allowance | ( | % | |||||||||||||||
| Other | ( | % | |||||||||||||||
U.S. | ( | % | |||||||||||||||
Switzerland | ( | % | |||||||||||||||
| Other foreign jurisdictions | ( | % | |||||||||||||||
| Effect of changes in tax laws or rates enacted in the current period | ( | % | |||||||||||||||
| Tax credits | |||||||||||||||||
Creditable foreign (non-Bermuda) taxes | ( | % | |||||||||||||||
Changes in valuation allowances | % | ||||||||||||||||
| Other adjustments | |||||||||||||||||
| Other | ( | % | |||||||||||||||
| Income tax benefit (expense) and effective tax rate | $ | ( | % | ||||||||||||||
A reconciliation of the difference between the provision for income taxes and the expected tax provision at the weighted average tax rate as presented in 2024 and 2023 prior to the adoption of ASU 2023-09 is as follows:
| Year ended December 31, | 2024 | 2023 | |||||||||||||||
| Expected income tax benefit (expense) | $ | ( | $ | ( | |||||||||||||
| Nondeductible expenses | ( | ( | |||||||||||||||
| Reinsurance adjustment | |||||||||||||||||
| Effect of change in tax rate | ( | ( | |||||||||||||||
| Pillar II top-up tax | ( | ||||||||||||||||
| GAAP to statutory accounting difference | ( | ( | |||||||||||||||
| Withholding tax | ( | ( | |||||||||||||||
| Recognition of Bermuda net deferred tax asset | |||||||||||||||||
| Change in valuation allowance | |||||||||||||||||
| Foreign branch adjustments | ( | ( | |||||||||||||||
| Other | |||||||||||||||||
| Income tax benefit (expense) | $ | ( | $ | ||||||||||||||
F-70
The Company’s expected income tax benefit (expense) shown in the table above was computed on pre-tax income (loss) at the weighted average tax rate calculated as the sum of the pre-tax income (loss) in each jurisdiction multiplied by that jurisdiction’s applicable statutory tax rate in effect for the relevant period.
Deferred Tax Assets and Liabilities
The tax effects of temporary differences that give rise to significant portions of the deferred tax assets and deferred tax liabilities are presented below:
| At December 31, | 2025 | 2024 | |||||||||||||||
| Deferred tax assets | |||||||||||||||||
| Intangible assets | $ | $ | |||||||||||||||
| Value of in-force business | |||||||||||||||||
| Tax loss carryforwards | |||||||||||||||||
| Reserve for claims and claim expenses | |||||||||||||||||
| Unearned premiums | |||||||||||||||||
| Amortization and depreciation | |||||||||||||||||
| Deferred finance charges | |||||||||||||||||
| Other | |||||||||||||||||
| Deferred tax liabilities | |||||||||||||||||
| Deferred acquisition expenses | ( | ( | |||||||||||||||
| Investments | ( | ||||||||||||||||
| Deferred underwriting results | ( | ||||||||||||||||
| Deferred revenue | ( | ( | |||||||||||||||
| VOBA | ( | ||||||||||||||||
| Other | ( | ( | |||||||||||||||
| ( | ( | ||||||||||||||||
| Net deferred tax asset (liability) before valuation allowance | |||||||||||||||||
| Valuation allowance | ( | ( | |||||||||||||||
| Net deferred tax asset (liability) | $ | $ | |||||||||||||||
At December 31, 2025, the Company recorded a net deferred tax asset of $666.9 million (2024 - $675.5 million), consisting of a deferred tax asset of $701.9 million (2024 - $701.1 million) and a deferred tax liability of $35.0 million (2024 - $25.6 million), which is included in other liabilities on the consolidated balance sheets.
The Company’s valuation allowance assessment is based on all available information including projections of future GAAP taxable income from each tax-paying component in each tax jurisdiction. A valuation allowance has been provided against certain deferred tax assets primarily related to deferred tax assets of RREAG, US Branch and certain net operating loss carryforwards in the U.K. During 2025, the Company recorded a net decrease to the valuation allowance of $67.0 million (2024 - decrease of $66.2 million, 2023 - increase of $19.6 million).
Net Operating Loss and Net Capital Loss Carryforwards
The Company has U.S. net operating loss carryforwards of $230.5 million which, under applicable law, will begin to expire in 2037. Additionally, the Company has net operating loss carryforwards of $102.3 million in the U.K. and $130.7 million in Luxembourg which, under applicable law, can be carried forward indefinitely. The Company has capital loss carryforwards of $126.1 million in the U.S. that begin to expire in 2026.
F-71
Income Taxes Paid
The Company made the following net tax payments in 2025 after the adoption of ASU 2023-09:
| Year ended December 31, | 2025 | ||||||||||
Federal (Bermuda) | $ | ||||||||||
| Foreign | |||||||||||
| U.S. | |||||||||||
| Switzerland | |||||||||||
| Other | |||||||||||
| Total net payment (refund) of income taxes | $ | ||||||||||
The Company made net tax payments in 2024 and 2023 of $99.5 million and $26.8 million, respectively.
Unrecognized Tax Benefits
The Company had no unrecognized tax benefits that if recognized would affect the annual effective tax rate at December 31, 2025 (2024 - $Nil l, 2023 - $Nil ). Interest and penalties related to unrecognized tax benefits would be recorded in income tax benefit (expense) in the Company’s consolidated statements of operations. At December 31, 2025, there were no interest or penalties accrued on unrecognized tax benefits (2024 - $Nil , 2023 - $Nil ).
Open Tax Years
The following tax years were open to examination by the local tax authorities as of February 6, 2026:
| Tax Jurisdiction | Open Tax Years | |||||||||||||
| Singapore | 2021-2025 | |||||||||||||
| Ireland | 2021-2025 | |||||||||||||
| U.S. | 2018-2025 | |||||||||||||
| Australia | 2021-2025 | |||||||||||||
| Switzerland | 2020-2025 | |||||||||||||
| Luxembourg | 2020-2025 | |||||||||||||
| Canada | 2021-2025 | |||||||||||||
U.K. | 2022-2025 | |||||||||||||
Bermuda | 2025 | |||||||||||||
The Company does not expect the resolution of these open years to have a significant impact on its consolidated statements of operations and financial condition.
NOTE 16. SEGMENT REPORTING
The Company’s reportable segments are defined as follows: (1) Property, which is comprised of catastrophe and other property (re)insurance written on behalf of the Company’s consolidated operating subsidiaries, joint ventures and managed funds, and (2 ) Casualty and Specialty, which is comprised of casualty and specialty (re)insurance written on behalf of the Company’s consolidated operating subsidiaries, joint ventures and managed funds. In addition to its reportable segments, the Company has an Other category, which primarily includes its investments unit, strategic investments, corporate expenses, certain expenses related to acquisitions and dispositions, capital servicing costs, income tax benefit (expense) and noncontrolling interests.
The Company’s reportable segments each have executive leadership who are responsible for the overall performance of their respective segments and who are directly accountable to the Company’s chief operating decision maker (“CODM”), the Chief Executive Officer of RenaissanceRe, who is ultimately responsible for reviewing the business to assess performance, make operating decisions and allocate
F-72
resources. The Company reports the results of its operations consistent with the manner in which the CODM reviews the business.
The Company does not manage its assets by segment; accordingly, net investment income and total assets are not allocated to the segments.
A summary of the significant components of the Company’s revenues and expenses by segment is as follows:
| Year ended December 31, 2025 | Property | Casualty and Specialty | Other | Total | |||||||||||||||||||||||||
| Gross premiums written | $ | $ | $ | $ | |||||||||||||||||||||||||
| Net premiums written | $ | $ | $ | $ | |||||||||||||||||||||||||
| Net premiums earned | $ | $ | $ | $ | |||||||||||||||||||||||||
Net claims and claim expenses incurred | |||||||||||||||||||||||||||||
| Acquisition expenses | |||||||||||||||||||||||||||||
| Operational expenses | |||||||||||||||||||||||||||||
| Underwriting income (loss) | $ | $ | ( | $ | |||||||||||||||||||||||||
| Net investment income | |||||||||||||||||||||||||||||
| Net foreign exchange gains (losses) | ( | ( | |||||||||||||||||||||||||||
Equity in earnings (losses) of other ventures | |||||||||||||||||||||||||||||
| Other income (loss) | |||||||||||||||||||||||||||||
| Net realized and unrealized gains (losses) on investments | |||||||||||||||||||||||||||||
| Corporate expenses | ( | ( | |||||||||||||||||||||||||||
| Interest expense | ( | ( | |||||||||||||||||||||||||||
Income (loss) before taxes | |||||||||||||||||||||||||||||
Income tax benefit (expense) | ( | ( | |||||||||||||||||||||||||||
| Net (income) loss attributable to redeemable noncontrolling interests | ( | ( | |||||||||||||||||||||||||||
| Dividends on preference shares | ( | ( | |||||||||||||||||||||||||||
| Net income (loss) available (attributable) to RenaissanceRe common shareholders | $ | ||||||||||||||||||||||||||||
Net claims and claim expenses incurred – current accident year | $ | $ | $ | $ | |||||||||||||||||||||||||
Net claims and claim expenses incurred – prior accident years | ( | ( | ( | ||||||||||||||||||||||||||
Net claims and claim expenses incurred – total | $ | $ | $ | $ | |||||||||||||||||||||||||
Net claims and claim expense ratio – current accident year | % | % | % | ||||||||||||||||||||||||||
Net claims and claim expense ratio – prior accident years | ( | % | % | ( | % | ||||||||||||||||||||||||
Net claims and claim expense ratio – calendar year | % | % | % | ||||||||||||||||||||||||||
| Underwriting expense ratio | % | % | % | ||||||||||||||||||||||||||
| Combined ratio | % | % | % | ||||||||||||||||||||||||||
F-73
| Year ended December 31, 2024 | Property | Casualty and Specialty | Other | Total | |||||||||||||||||||||||||
| Gross premiums written | $ | $ | $ | $ | |||||||||||||||||||||||||
| Net premiums written | $ | $ | $ | $ | |||||||||||||||||||||||||
| Net premiums earned | $ | $ | $ | $ | |||||||||||||||||||||||||
Net claims and claim expenses incurred | |||||||||||||||||||||||||||||
| Acquisition expenses | |||||||||||||||||||||||||||||
| Operational expenses | |||||||||||||||||||||||||||||
| Underwriting income (loss) | $ | $ | ( | $ | |||||||||||||||||||||||||
| Net investment income | |||||||||||||||||||||||||||||
| Net foreign exchange gains (losses) | ( | ( | |||||||||||||||||||||||||||
Equity in earnings (losses) of other ventures | |||||||||||||||||||||||||||||
| Other income (loss) | |||||||||||||||||||||||||||||
| Net realized and unrealized gains (losses) on investments | ( | ( | |||||||||||||||||||||||||||
| Corporate expenses | ( | ( | |||||||||||||||||||||||||||
| Interest expense | ( | ( | |||||||||||||||||||||||||||
Income (loss) before taxes | |||||||||||||||||||||||||||||
Income tax benefit (expense) | ( | ( | |||||||||||||||||||||||||||
| Net (income) loss attributable to redeemable noncontrolling interests | ( | ( | |||||||||||||||||||||||||||
| Dividends on preference shares | ( | ( | |||||||||||||||||||||||||||
| Net income (loss) available (attributable) to RenaissanceRe common shareholders | $ | ||||||||||||||||||||||||||||
Net claims and claim expenses incurred – current accident year | $ | $ | $ | $ | |||||||||||||||||||||||||
Net claims and claim expenses incurred – prior accident years | ( | ( | ( | ||||||||||||||||||||||||||
Net claims and claim expenses incurred – total | $ | $ | $ | $ | |||||||||||||||||||||||||
Net claims and claim expense ratio – current accident year | % | % | % | ||||||||||||||||||||||||||
Net claims and claim expense ratio – prior accident years | ( | % | ( | % | ( | % | |||||||||||||||||||||||
Net claims and claim expense ratio – calendar year | % | % | % | ||||||||||||||||||||||||||
| Underwriting expense ratio | % | % | % | ||||||||||||||||||||||||||
| Combined ratio | % | % | % | ||||||||||||||||||||||||||
F-74
| Year ended December 31, 2023 | Property | Casualty and Specialty | Other | Total | |||||||||||||||||||||||||
| Gross premiums written | $ | $ | $ | $ | |||||||||||||||||||||||||
| Net premiums written | $ | $ | $ | $ | |||||||||||||||||||||||||
| Net premiums earned | $ | $ | $ | $ | |||||||||||||||||||||||||
Net claims and claim expenses incurred | |||||||||||||||||||||||||||||
| Acquisition expenses | |||||||||||||||||||||||||||||
| Operational expenses | |||||||||||||||||||||||||||||
| Underwriting income (loss) | $ | $ | $ | ||||||||||||||||||||||||||
| Net investment income | |||||||||||||||||||||||||||||
| Net foreign exchange gains (losses) | ( | ( | |||||||||||||||||||||||||||
Equity in earnings (losses) of other ventures | |||||||||||||||||||||||||||||
| Other income (loss) | ( | ( | |||||||||||||||||||||||||||
| Net realized and unrealized gains (losses) on investments | |||||||||||||||||||||||||||||
| Corporate expenses | ( | ( | |||||||||||||||||||||||||||
| Interest expense | ( | ( | |||||||||||||||||||||||||||
Income (loss) before taxes | |||||||||||||||||||||||||||||
Income tax benefit (expense) | |||||||||||||||||||||||||||||
| Net (income) loss attributable to redeemable noncontrolling interests | ( | ( | |||||||||||||||||||||||||||
| Dividends on preference shares | ( | ( | |||||||||||||||||||||||||||
| Net income (loss) available (attributable) to RenaissanceRe common shareholders | $ | ||||||||||||||||||||||||||||
Net claims and claim expenses incurred – current accident year | $ | $ | $ | $ | |||||||||||||||||||||||||
Net claims and claim expenses incurred – prior accident years | ( | ( | ( | ||||||||||||||||||||||||||
Net claims and claim expenses incurred – total | $ | $ | $ | $ | |||||||||||||||||||||||||
Net claims and claim expense ratio – current accident year | % | % | % | ||||||||||||||||||||||||||
Net claims and claim expense ratio – prior accident years | ( | % | ( | % | ( | % | |||||||||||||||||||||||
Net claims and claim expense ratio – calendar year | % | % | % | ||||||||||||||||||||||||||
| Underwriting expense ratio | % | % | % | ||||||||||||||||||||||||||
| Combined ratio | % | % | % | ||||||||||||||||||||||||||
F-75
The following is a summary of the Company’s gross premiums written by territory of coverage exposure:
| Year ended December 31, | 2025 | 2024 | 2023 | ||||||||||||||||||||||||||||||||||||||
| Gross Premiums Written | Percentage of Gross Premiums Written | Gross Premiums Written | Percentage of Gross Premiums Written | Gross Premiums Written | Percentage of Gross Premiums Written | ||||||||||||||||||||||||||||||||||||
| Property | |||||||||||||||||||||||||||||||||||||||||
| U.S. and Caribbean | $ | % | $ | % | $ | % | |||||||||||||||||||||||||||||||||||
| Worldwide | % | % | % | ||||||||||||||||||||||||||||||||||||||
| Europe | % | % | % | ||||||||||||||||||||||||||||||||||||||
Worldwide (excluding U.S.) (1) | % | % | % | ||||||||||||||||||||||||||||||||||||||
| Japan | % | % | % | ||||||||||||||||||||||||||||||||||||||
| Australia and New Zealand | % | % | % | ||||||||||||||||||||||||||||||||||||||
| Other | % | % | % | ||||||||||||||||||||||||||||||||||||||
| Total Property | % | % | % | ||||||||||||||||||||||||||||||||||||||
| Casualty and Specialty | |||||||||||||||||||||||||||||||||||||||||
| U.S. and Caribbean | % | % | % | ||||||||||||||||||||||||||||||||||||||
| Worldwide | % | % | % | ||||||||||||||||||||||||||||||||||||||
| Europe | % | % | % | ||||||||||||||||||||||||||||||||||||||
Worldwide (excluding U.S.) (1) | % | % | % | ||||||||||||||||||||||||||||||||||||||
| Australia and New Zealand | % | % | % | ||||||||||||||||||||||||||||||||||||||
| Other | % | % | % | ||||||||||||||||||||||||||||||||||||||
| Total Casualty and Specialty | % | % | % | ||||||||||||||||||||||||||||||||||||||
| Total gross premiums written | $ | % | $ | % | $ | % | |||||||||||||||||||||||||||||||||||
(1)The category “Worldwide (excluding U.S.)” consists of contracts that cover more than one geographic region (other than the U.S.).
NOTE 17. STOCK INCENTIVE COMPENSATION AND EMPLOYEE BENEFIT PLANS
Stock Incentive Compensation Plans and Awards
The Company is authorized to issue restricted stock awards, restricted stock units, performance share awards, stock options and other share-based awards to its employees and directors pursuant to various stock incentive compensation plans.
On May 16, 2022, the Company’s shareholders approved the Company’s First Amended and Restated 2016 Long-Term Incentive Plan, which amended and restated the plan initially approved by the shareholders in May 2016 (as amended from time to time, the “2016 Long-Term Incentive Plan”). The Company is authorized to issue up to 3,060,092 common shares pursuant to the 2016 Long-Term Incentive Plan. The 2016 Long-Term Incentive Plan permits the grant of restricted stock awards, restricted stock units, performance share awards (including cash-based performance awards), stock options and other share-based awards to employees, officers, non-employee directors and consultants or advisors of the Company and its affiliates.
In November 2016, the Company instituted a cash settled restricted stock unit (“CSRSU”) plan, the 2016 Restricted Stock Unit Plan, which allows for the issuance of equity awards in the form of CSRSUs. There are currently no outstanding awards under this plan.
Restricted Stock Awards
Restricted stock awards granted to employees under the 2016 Long-Term Incentive Plan generally vest ratably over a four-year period. Restricted stock awards granted to non-employee directors generally vest ratably over a three-year period.
Performance Share Awards
Performance share awards granted to certain of the Company’s executive officers pursuant to the 2016 Long-Term Incentive Plan are subject to vesting conditions based on both continued service and the attainment of pre-established performance goals. If performance goals are achieved, the performance share awards will vest up to a maximum of 200 % of target. Performance share awards generally cliff vest at
F-76
the end of a three-year vesting period based on the attainment of performance goals over the three-year performance period.
Performance Share Awards Granted Beginning in March 2020
Beginning with awards granted in March 2020, performance share awards have performance conditions, which are the average percentage change in the Company’s book value per common share plus change in accumulated dividends over three years and the three-year average underwriting expense ratio rank compared to peers, or, in the event of a change in control, a market condition, which is the Company’s total shareholder return relative to its peer group. The performance conditions are calculated in accordance with the terms of the applicable award agreement.
Performance Share Awards Granted to CEO in November 2023
On November 7, 2023, the Board of Directors granted performance-based restricted stock awards to the Company’s Chief Executive Officer. The performance condition is the average percentage change in the Company’s tangible book value per common share plus change in accumulated dividends over four years , commencing on January 1, 2023 and ending on December 31, 2026, or, in the event of a change in control, a market condition, which is the Company’s total shareholder return relative to its peer group. The performance conditions are calculated in accordance with the terms of the applicable award agreement.
Valuation Assumptions
Performance Share Awards Granted Beginning in March 2020
For performance share awards granted beginning in March 2020, the performance metrics relate to (i) the percentage change in book value per share plus change in accumulated dividends and (ii) average underwriting expense ratio rank compared to peers, both of which are classified as performance conditions under FASB ASC Topic 718, Compensation - Stock Compensation. As a result, the fair value of the performance share awards is determined based on the fair market value of RenaissanceRe’s common shares on the grant date. The estimated fair value of performance share awards is amortized as an expense over the requisite service period.
Restricted Stock Awards
The fair value of restricted stock awards is determined based on the fair market value of RenaissanceRe’s common shares on the grant date. The estimated fair value of restricted stock awards is amortized as an expense over the requisite service period. The Company has elected to recognize forfeitures as they occur rather than estimating service-based forfeitures over the requisite service period.
F-77
Summary of Stock Compensation Activity
Performance Share Awards
The following table provides a roll forward of the Company’s nonvested performance share awards:
Number of Shares (1) | Weighted Average Grant Date Fair Value | ||||||||||||||||
| Nonvested at December 31, 2022 | $ | ||||||||||||||||
| Awards granted | |||||||||||||||||
| Awards forfeited | ( | ||||||||||||||||
| Nonvested at December 31, 2023 | |||||||||||||||||
| Awards granted | |||||||||||||||||
| Awards vested | ( | ||||||||||||||||
| Awards forfeited | ( | ||||||||||||||||
| Nonvested at December 31, 2024 | |||||||||||||||||
| Awards granted | |||||||||||||||||
| Awards vested | ( | ||||||||||||||||
| Awards forfeited | ( | ||||||||||||||||
| Nonvested at December 31, 2025 | |||||||||||||||||
(1)For performance share awards, the number of shares is stated at the maximum number that can be attained if the performance conditions are fully met. Forfeitures represent shares forfeited due to vesting below the maximum attainable as a result of the Company not fully meeting the performance conditions.
Restricted Stock Awards
The following table provides a roll forward of the Company’s nonvested restricted stock awards:
| Employee Restricted Stock Awards | Non-Employee Director Restricted Stock Awards | Total Restricted Stock Awards | |||||||||||||||||||||||||||||||||||||||
| Number of Shares | Weighted Average Grant Date Fair Value | Number of Shares | Weighted Average Grant Date Fair Value | Number of Shares | Weighted Average Grant Date Fair Value | ||||||||||||||||||||||||||||||||||||
| Nonvested at December 31, 2022 | $ | $ | $ | ||||||||||||||||||||||||||||||||||||||
| Awards granted | |||||||||||||||||||||||||||||||||||||||||
| Awards vested | ( | ( | ( | ||||||||||||||||||||||||||||||||||||||
| Awards forfeited | ( | ( | |||||||||||||||||||||||||||||||||||||||
| Nonvested at December 31, 2023 | |||||||||||||||||||||||||||||||||||||||||
| Awards granted | |||||||||||||||||||||||||||||||||||||||||
| Awards vested | ( | ( | ( | ||||||||||||||||||||||||||||||||||||||
| Awards forfeited | ( | ( | |||||||||||||||||||||||||||||||||||||||
| Nonvested at December 31, 2024 | |||||||||||||||||||||||||||||||||||||||||
| Awards granted | |||||||||||||||||||||||||||||||||||||||||
| Awards vested | ( | ( | ( | ||||||||||||||||||||||||||||||||||||||
| Awards forfeited | ( | ( | |||||||||||||||||||||||||||||||||||||||
| Nonvested at December 31, 2025 | |||||||||||||||||||||||||||||||||||||||||
There were 0.6 million shares available for issuance under the 2016 Long-Term Incentive Plan at December 31, 2025.
The aggregate fair value of restricted stock awards and performance share awards vested during 2025 was $82.9 million (2024 - $82.8 million, 2023 - $70.0 million). In connection with share vestings, there was a
F-78
$1.5 million excess windfall tax benefit realized by the Company in 2025 (2024 - $2.0 million, 2023 - $1.7 million).
The total stock compensation expense recognized in the Company’s consolidated statements of operations during 2025 was $77.5 million (2024 - $71.4 million, 2023 - $60.3 million). As of December 31, 2025, there was $112.3 million of total unrecognized compensation cost related to restricted stock awards and $15.0 million related to performance share awards, which will be recognized on a weighted average basis during the next 1.7 years and 1.4 years, respectively.
All of the Company’s employees are eligible for defined contribution pension plans. Contributions are primarily based upon a percentage of eligible compensation. The Company contributed $12.7 million to its defined contribution pension plans in 2025 (2024 - $12.0 million, 2023 - $9.5 million).
NOTE 18. STATUTORY REQUIREMENTS
The Company’s (re)insurance operations are subject to insurance laws and regulations in the jurisdictions in which they operate, the most significant of which currently include Bermuda, Switzerland, the U.K. and the U.S. These regulations include certain restrictions on the amount of dividends or other distributions, such as loans or cash advances, available to shareholders without prior approval of the respective regulatory authorities.
The following table summarizes the statutory capital and surplus and required minimum statutory capital and surplus of the Company’s primary regulated insurance operations in its most significant regulatory jurisdictions:
Bermuda (1) | Switzerland (2) | U.K. (3) | U.S. (4) | ||||||||||||||||||||||||||||||||||||||||||||||||||
| At December 31, | 2025 | 2024 | 2025 | 2024 | 2025 | 2024 | 2025 | 2024 | |||||||||||||||||||||||||||||||||||||||||||||
Statutory capital and surplus | $ | $ | $ | $ | $ | $ | $ | $ | |||||||||||||||||||||||||||||||||||||||||||||
Required statutory capital and surplus | $ | $ | $ | $ | $ | $ | $ | $ | |||||||||||||||||||||||||||||||||||||||||||||
(1)Includes Renaissance Reinsurance, DaVinci Reinsurance, RenaissanceRe Specialty U.S., Vermeer, Fontana and Validus Re (which was acquired in on November 1, 2023). The Company’s primary Bermuda-domiciled insurance subsidiaries’ required statutory capital and surplus is based on the minimum solvency margin. On October 1, 2024, Renaissance Reinsurance and Validus Re were amalgamated.
(2)Includes RREAG and its branches in Australia, Bermuda, the U.K. and the U.S., and Validus Reinsurance (Switzerland) Ltd (“Validus Switzerland”) (which was acquired on November 1, 2023) and its Bermuda Branch. On June 21, 2024, Validus Switzerland merged into RREAG.
(3)Includes Syndicate 1458. With respect to statutory capital and surplus and required statutory capital and surplus, underwriting capacity of a member of Lloyd’s must be supported by providing a deposit in the form of cash, securities or letters of credit, which are referred to as FAL. Syndicate 1458 is capitalized by its FAL, with the related assets not held on its balance sheet.
(4)Includes Renaissance Reinsurance U.S.
The following table summarizes the statutory net income (loss) of the Company’s primary regulated insurance operations in its most significant regulatory jurisdictions:
| Statutory Net Income (Loss) | |||||||||||||||||||||||||||||
Bermuda (1) | Switzerland (2) | U.K. (3) | U.S. (4) | ||||||||||||||||||||||||||
Year ended December 31, 2025 | $ | $ | $ | $ | |||||||||||||||||||||||||
Year ended December 31, 2024 | $ | $ | $ | $ | ( | ||||||||||||||||||||||||
Year ended December 31, 2023 | $ | $ | $ | $ | ( | ||||||||||||||||||||||||
(1)Includes Renaissance Reinsurance, DaVinci Reinsurance, RenaissanceRe Specialty U.S., Vermeer, Fontana and Validus Re (which was acquired in on November 1, 2023). On October 1, 2024, Renaissance Reinsurance and Validus Re were amalgamated.
(2)Includes RREAG and its branches in Australia, Bermuda, the U.K. and the U.S., and Validus Switzerland and its Bermuda Branch (which was acquired on November 1, 2023). On June 21, 2024 Validus Switzerland merged into RREAG.
(3)Includes Syndicate 1458.
(4)Includes Renaissance Reinsurance U.S.
F-79
The difference between statutory financial statements and financial statements prepared in accordance with GAAP varies by jurisdiction. For the Company’s regulated entities, the primary difference is that statutory financial statements generally do not recognize goodwill and intangible assets. In the U.S., fixed maturity investments are generally recorded at amortized cost, deferred income taxes are charged directly to equity and deferred acquisition costs are generally not recognized in the statutory financial statements. In Switzerland, currency translation adjustment losses are directly charged to net income (loss), while translation gains are not admissible and are recorded as a translation reserve on the statutory balance sheet. In addition, fixed maturity investments are carried at the lower of amortized cost and market value and the recognition of equalization reserves is allowed. The prudence principle standard also allows for valuating certain assets below their nominal value. None of the Company’s insurance subsidiaries used permitted practices that prevented the trigger of a regulatory event during the years ended December 31, 2025, 2024 and 2023.
Dividend Restrictions of RenaissanceRe
As a Bermuda-domiciled holding company, RenaissanceRe has limited operations of its own. Its assets consist primarily of investments in subsidiaries and cash and securities. As a result, the Company relies primarily on dividends and distributions (and other statutorily permissible payments) from its subsidiaries, investment income and fee income to meet its liquidity requirements, which primarily include making principal and interest payments on its debt, and dividend payments to its preference and common shareholders.
The payment of dividends by the Company’s subsidiaries is, under certain circumstances, limited by the applicable laws and regulations in the various jurisdictions in which the subsidiaries operate, including Bermuda, the U.S., the U.K., Switzerland, Australia, Singapore and Ireland. In addition, insurance laws require the Company’s insurance subsidiaries to maintain certain measures of solvency and liquidity.
Bermuda
Bermuda-registered insurance companies are regulated under the Bermuda Insurance Act 1978, as amended, and related regulations (collectively, the “Insurance Act”), which impose various requirements depending on a company’s classification under the Insurance Act. The Company and certain of its Bermuda-registered insurers are generally required to maintain available statutory economic capital and surplus at a level at least equal to their enhanced capital requirement (“ECR”), which may be adjusted by the BMA. The ECR is established by reference to the Bermuda Solvency Capital Requirement (“BSCR”) model. Renaissance Reinsurance and DaVinci Reinsurance are registered as Class 4 general business insurers, RenaissanceRe Specialty U.S. and Vermeer are registered as Class 3B general business insurers, and Fontana Reinsurance Ltd. and Fontana Reinsurance U.S. Ltd. are registered as Class 3A general business insurers under the Insurance Act. Class 4, Class 3B and Class 3A insurers are required to maintain available statutory economic capital and surplus at a target capital level equal to 120 % of the ECR. Failure to maintain statutory capital at least equal to the target capital level would likely result in increased BMA regulatory oversight. RenaissanceRe Europe AG, Bermuda Branch, a Class 3B general business insurer, has modified requirements, which are addressed under Switzerland, below. The Company and certain of its Bermuda-registered insurers are generally required to file an annual BSCR with the BMA. The Company’s 2024 group BSCR was filed with the BMA on May 30, 2025 with a BSCR ratio of 242 %.
Class 4, Class 3B and Class 3A insurers are generally prohibited from declaring or paying any dividends if the declaring or paying such dividend would cause the insurer to fail to meet the required minimum solvency margin or minimum liquidity ratio, or if certain solvency requirements are not met. Additional restrictions apply to any dividend and any reduction in statutory capital over applicable thresholds.
Switzerland
RREAG is a reinsurance company licensed and supervised by the Swiss Financial Market Supervisory Authority FINMA (“FINMA”).The minimum capital requirement for a Swiss reinsurance company under the Insurance Supervisory Act for reinsurance license class C1 is CHF 10 million. RREAG must further maintain adequate solvency and provide for sufficient free and unencumbered capital in relation to its activities in accordance with the Swiss Solvency Test (“SST”). The solvency requirement is met if the available risk-bearing capital exceeds the required target capital. It is then assessed whether the identified available
F-80
capital can meet the SST requirements and is sufficient to cover the company’s obligations in less favorable scenarios. RREAG maintains branch operations in Australia, Bermuda, the U.K. and the U.S., each in accordance with applicable local regulations, which may include statutory capital requirements.
RREAG may only distribute dividends out of its retained earnings or distributable reserves based on the audited annual accounts of the company. Any distribution of dividends may be subject to the approval of FINMA (as a change of the regulatory business plan) if they have a bearing on the solvency of the reinsurer and/or the interests of the insured. The solvency and capital requirements must still be met following any distribution.
U.K.
The underwriting capacity of a member of Lloyd’s must be supported by providing a deposit, referred to as “Funds at Lloyd’s” or “FAL,” in the form of cash, securities or letters of credit in an amount determined under the capital adequacy regime of the U.K. Prudential Regulatory Authority. The amount of such deposit is calculated for each member through the completion of a quarterly capital adequacy exercise. Under these requirements, Lloyd’s must demonstrate that each member has sufficient assets to meet its underwriting liabilities plus a required solvency margin. The amount of FAL for RenaissanceRe Syndicate 1458 (“Syndicate 1458”) is determined by Lloyd’s and is based on Syndicate 1458’s solvency and capital requirement as calculated through its internal model.
Dividends from a Lloyd’s managing agent and a Lloyd’s corporate member can be declared and paid provided the relevant company has sufficient profits available for distribution.
U.S.
Renaissance Reinsurance U.S. is required to meet certain minimum statutory capital and surplus requirements under Maryland law, including risk-based capital (“RBC”) requirements, and must file an annual report of its RBC levels. If the report shows Renaissance Reinsurance U.S.’s statutory capital and surplus or total adjusted capital is below certain levels, Renaissance Reinsurance U.S. may be required to take certain corrective action or the Maryland Insurance Administration (“MIA”) may be permitted or required to take certain regulatory action.
Maryland law places limitations on the amounts of dividends or distributions payable by Renaissance Reinsurance U.S. At December 31, 2025, Renaissance Reinsurance U.S. had an ordinary dividend capacity of $130.2 million which can be paid in 2026. Payment of ordinary dividends by Renaissance Reinsurance U.S. requires notice to the MIA. Declaration of an extraordinary dividend, which must be paid out of earned surplus, generally requires thirty days’ prior notice to and approval or non-disapproval of the MIA.
Multi-Beneficiary Reinsurance Trusts
Each of Renaissance Reinsurance, DaVinci Reinsurance, and RREAG was approved as a Trusteed Reinsurer and established a multi-beneficiary reinsurance trust (“MBRT”) to collateralize its (re)insurance liabilities. The MBRTs are subject to rules and regulations including but not limited to certain minimum capital funding requirements, investment guidelines, capital distribution restrictions and regulatory reporting requirements.
The following table summarizes the assets held under trust and minimum amount required with respect to the MBRTs:
| At December 31. | 2025 | 2024 | |||||||||||||||||||||||||||
Assets Held Under Trust | Minimum Amount Required | Assets Held Under Trust | Minimum Amount Required | ||||||||||||||||||||||||||
RREAG (1) | $ | $ | $ | $ | |||||||||||||||||||||||||
Renaissance Reinsurance (2) | $ | $ | $ | $ | |||||||||||||||||||||||||
| DaVinci Reinsurance | $ | $ | $ | $ | |||||||||||||||||||||||||
(1)RREAG and Validus Switzerland merged on June 21, 2024, with RREAG being the successor to the MBRTs held by Validus Switzerland.
(2)Renaissance Reinsurance and Validus Re amalgamated on October 1, 2024, with Renaissance Reinsurance being the successor to the MBRTs held by Validus Re.
F-81
Multi-Beneficiary Reduced Collateral Reinsurance Trusts
Each of Renaissance Reinsurance, RREAG and DaVinci Reinsurance has been approved as a “certified reinsurer” eligible for collateral reduction in certain states, and are authorized to provide reduced collateral equal to 20 %, 20 % and 50 %, respectively, of their net outstanding insurance liabilities to insurers domiciled in each of those states. Each of Renaissance Reinsurance, RREAG and DaVinci Reinsurance has established a multi-beneficiary reduced collateral reinsurance trust to collateralize its (re)insurance liabilities associated with cedants domiciled in those states. The reduced collateral reinsurance trusts are subject to rules and regulations including but not limited to certain minimum capital funding requirements, investment guidelines, capital distribution restrictions and regulatory reporting requirements.
The following table summarizes the assets held under trust and minimum amount required with respect to the reduced collateral reinsurance trusts:
| At December 31. | 2025 | 2024 | |||||||||||||||||||||||||||
Assets Held Under Trust | Minimum Amount Required | Assets Held Under Trust | Minimum Amount Required | ||||||||||||||||||||||||||
| Renaissance Reinsurance | $ | $ | $ | $ | |||||||||||||||||||||||||
| RREAG | $ | $ | $ | $ | |||||||||||||||||||||||||
| DaVinci Reinsurance | $ | $ | $ | $ | |||||||||||||||||||||||||
NOTE 19. DERIVATIVE INSTRUMENTS
The Company may enter into derivative instruments to manage its foreign currency exposure, obtain exposure to a particular financial market, or for trading and to assume or hedge risk. The Company’s derivative instruments are primarily exchange traded futures, centrally cleared credit default swaps or over-the-counter foreign currency forward contracts. The over-the-counter derivatives are generally traded under International Swaps and Derivatives Association master agreements, which establish the terms of the transactions entered into with the Company’s derivative counterparties. In the event a party becomes insolvent or otherwise defaults on its obligations, a master agreement generally permits the non-defaulting party to accelerate and terminate all outstanding transactions and net the transactions’ marked-to-market values so that a single sum in a single currency will be owed by, or owed to, the non-defaulting party. Effectively, this contractual close-out netting reduces credit exposure from gross to net exposure. Where the Company has entered into master netting agreements with counterparties, or the Company has the legal and contractual right to offset positions, the derivative positions are generally netted by counterparty and are reported accordingly in other assets and other liabilities.
The Company is not aware of the existence of any credit-risk related contingent features that it believes would be triggered in its derivative instruments that are in a net liability position at December 31, 2025.
F-82
The tables below show the gross and net amounts of recognized derivative assets and liabilities at fair value for the Company’s derivative instruments:
| At December 31, 2025 | Gross Amounts Recognized | Gross Amounts Offset in the Balance Sheet | Net Amounts Presented in the Balance Sheet (1) | Collateral Received | Net Amount | ||||||||||||||||||||||||||||||
Derivative instruments not designated as hedges | |||||||||||||||||||||||||||||||||||
Interest rate futures | $ | $ | $ | $ | $ | ||||||||||||||||||||||||||||||
Interest rate swaps | |||||||||||||||||||||||||||||||||||
Foreign currency forward contracts (2) | |||||||||||||||||||||||||||||||||||
Foreign currency forward contracts (3) | |||||||||||||||||||||||||||||||||||
Credit default swaps | |||||||||||||||||||||||||||||||||||
| Total | $ | $ | $ | $ | $ | ||||||||||||||||||||||||||||||
| At December 31, 2025 | Gross Amounts Recognized | Gross Amounts Offset in the Balance Sheet | Net Amounts Presented in the Balance Sheet | Collateral Pledged | Net Amount | ||||||||||||||||||||||||||||||
Derivative instruments not designated as hedges | |||||||||||||||||||||||||||||||||||
Interest rate futures | $ | $ | $ | $ | $ | ||||||||||||||||||||||||||||||
Foreign currency forward contracts (2) | |||||||||||||||||||||||||||||||||||
Foreign currency forward contracts (3) | |||||||||||||||||||||||||||||||||||
Credit default swaps | |||||||||||||||||||||||||||||||||||
Equity futures | |||||||||||||||||||||||||||||||||||
Commodity futures | |||||||||||||||||||||||||||||||||||
Total derivative instruments not designated as hedges | |||||||||||||||||||||||||||||||||||
Derivative instruments designated as hedges | |||||||||||||||||||||||||||||||||||
Foreign currency forward contracts (4) | |||||||||||||||||||||||||||||||||||
| Total | $ | $ | $ | $ | $ | ||||||||||||||||||||||||||||||
(1)Net derivative assets and liabilities are included within other assets and other liabilities, respectively, in the consolidated balance sheets.
(2)Contracts used to manage foreign currency risks in underwriting and non-investment operations.
(3)Contracts used to manage foreign currency risks in investment operations.
(4)Contracts designated as hedges of net investments in a foreign operation.
F-83
| At December 31, 2024 | Gross Amounts Recognized | Gross Amounts Offset in the Balance Sheet | Net Amounts Presented in the Balance Sheet (1) | Collateral Received | Net Amount | ||||||||||||||||||||||||||||||
| Derivative instruments not designated as hedges | |||||||||||||||||||||||||||||||||||
Interest rate futures | $ | $ | $ | $ | $ | ||||||||||||||||||||||||||||||
Foreign currency forward contracts (2) | |||||||||||||||||||||||||||||||||||
Foreign currency forward contracts (3) | |||||||||||||||||||||||||||||||||||
| Commodity futures | |||||||||||||||||||||||||||||||||||
| Commodity options | |||||||||||||||||||||||||||||||||||
| Total derivative instruments not designated as hedges | |||||||||||||||||||||||||||||||||||
| Derivative instruments designated as hedges | |||||||||||||||||||||||||||||||||||
Foreign currency forward contracts (4) | |||||||||||||||||||||||||||||||||||
Total | $ | $ | $ | $ | $ | ||||||||||||||||||||||||||||||
| At December 31, 2024 | Gross Amounts Recognized | Gross Amounts Offset in the Balance Sheet | Net Amounts Presented in the Balance Sheet (1) | Collateral Received | Net Amount | ||||||||||||||||||||||||||||||
| Derivative instruments not designated as hedges | |||||||||||||||||||||||||||||||||||
Interest rate futures | $ | $ | $ | $ | $ | ||||||||||||||||||||||||||||||
Foreign currency forward contracts (2) | |||||||||||||||||||||||||||||||||||
Foreign currency forward contracts (3) | |||||||||||||||||||||||||||||||||||
Credit default swaps | |||||||||||||||||||||||||||||||||||
| Equity futures | |||||||||||||||||||||||||||||||||||
Total | $ | $ | $ | $ | $ | ||||||||||||||||||||||||||||||
(1)Net derivative assets and liabilities are included within other assets and other liabilities, respectively, in the consolidated balance sheets.
(2)Contracts used to manage foreign currency risks in underwriting and non-investment operations.
(3)Contracts used to manage foreign currency risks in investment operations.
(4)Contracts designated as hedges of net investments in a foreign operation.
F-84
The table below shows the notional exposure by underlying risk of the Company’s recognized derivative contracts:
| At December 31, | 2025 | 2024 | |||||||||||||||||||||||||||
Notional Long Exposure | Notional Short Exposure | Notional Long Exposure | Notional Short Exposure | ||||||||||||||||||||||||||
Derivative instruments not designated as hedges | |||||||||||||||||||||||||||||
Interest rate risk | |||||||||||||||||||||||||||||
Interest rate futures | $ | $ | $ | $ | |||||||||||||||||||||||||
Interest rate swaps (1) | |||||||||||||||||||||||||||||
Foreign currency risk | |||||||||||||||||||||||||||||
Foreign currency forward contracts - underwriting and non-investment operations | |||||||||||||||||||||||||||||
Foreign currency forward contracts - investment operations | |||||||||||||||||||||||||||||
Credit risk | |||||||||||||||||||||||||||||
Credit default swaps (2) | |||||||||||||||||||||||||||||
Equity price risk | |||||||||||||||||||||||||||||
| Equity futures | |||||||||||||||||||||||||||||
Commodity price risk | |||||||||||||||||||||||||||||
Commodity futures | |||||||||||||||||||||||||||||
Commodity options (3) | |||||||||||||||||||||||||||||
Derivative instruments designated as hedges | |||||||||||||||||||||||||||||
Foreign currency risk | |||||||||||||||||||||||||||||
Foreign currency forward contracts - net investments in foreign operations | |||||||||||||||||||||||||||||
(1)Notional long exposure amounts are positions receiving a fixed rate and notional short exposure amounts are positions paying a fixed rate.
(2)Notional long exposure amounts are positions which assume credit risk and notional short exposure amounts are positions to protect the investment portfolio against increasing credit risk.
(3)Notional exposure for commodity options are based on the fair value of the underlying commodities as if the options were exercised at the reporting date.
F-85
The location and amount of the gain (loss) recognized in the Company’s consolidated statements of operations and consolidated statements of changes in shareholders’ equity related to its derivative instruments are shown in the following table:
Amount of Gain (Loss) Recognized on Derivatives | |||||||||||||||||||||||
| Year ended December 31, | 2025 | 2024 | 2023 | ||||||||||||||||||||
| Derivative instruments not designated as hedges | |||||||||||||||||||||||
Net realized and unrealized gains (losses) on investments (1) | |||||||||||||||||||||||
| Interest rate futures | $ | $ | ( | $ | |||||||||||||||||||
| Credit default swaps | ( | ( | |||||||||||||||||||||
| Interest rate swaps | ( | ||||||||||||||||||||||
Total fixed maturity investment-related derivatives | ( | ( | |||||||||||||||||||||
| Equity futures | ( | ||||||||||||||||||||||
| Warrants | ( | ||||||||||||||||||||||
Total equity investment-related derivatives | ( | ||||||||||||||||||||||
| Commodity futures | |||||||||||||||||||||||
| Commodity options | ( | ( | ( | ||||||||||||||||||||
Total commodity-related derivatives | |||||||||||||||||||||||
Total net realized and unrealized gains (losses) on investments (1) | ( | ( | |||||||||||||||||||||
| Net foreign exchange gains (losses) | |||||||||||||||||||||||
Foreign currency forward contracts (2) | ( | ( | |||||||||||||||||||||
Foreign currency forward contracts (3) | ( | ( | ( | ||||||||||||||||||||
| Total net foreign exchange gains (losses) | ( | ( | |||||||||||||||||||||
Total derivative instruments not designated as hedges | ( | ( | |||||||||||||||||||||
| Derivative instruments designated as hedges | |||||||||||||||||||||||
| Accumulated other comprehensive income (loss) | |||||||||||||||||||||||
Foreign currency forward contracts (4) | ( | ||||||||||||||||||||||
| $ | $ | ( | $ | ( | |||||||||||||||||||
(1)Amount of gain (loss) is included in net realized and unrealized gains (losses) on investment-related derivatives. See “Note 5. Investments” for additional information.
(2)Contracts used to manage foreign currency risks in underwriting and non-investment operations.
(3)Contracts used to manage foreign currency risks in investment operations.
(4)Contracts designated as hedges of net investments in a foreign operation. Amount of gain (loss) is included in foreign currency translation adjustments, net of tax.
Derivative Instruments Not Designated as Hedges
Interest Rate Derivatives
The Company uses interest rate futures within its portfolio of fixed maturity investments to manage its exposure to interest rate risk, which may result in increasing or decreasing its exposure to this risk.
Interest Rate Futures
The fair value of interest rate futures is determined using exchange traded prices. The Company’s exposure is primarily in U.S. treasury and non-U.S. government bond futures contracts.
Interest Rate Swaps
The fair value of interest rate swaps is determined using the relevant exchange traded price where available or a discounted cash flow model based on the terms of the contract and inputs, including, where applicable, observable yield curves.
F-86
Foreign Currency Derivatives
The Company’s functional currency is the U.S. dollar. The Company writes a portion of its business in currencies other than U.S. dollars and may, from time to time, experience foreign exchange gains and losses in the Company’s consolidated financial statements. The impact of changes in exchange rates on the Company’s assets and liabilities denominated in currencies other than the U.S. dollar, excluding non-monetary assets and liabilities, are recognized in the Company’s consolidated statements of operations.
Underwriting and Non-investment Operations Related Foreign Currency Contracts
The Company’s foreign currency policy with regard to its underwriting operations is generally to enter into foreign currency forward and option contracts for notional values that approximate the foreign currency liabilities, including claims and claim expense reserves and reinsurance balances payable, net of any cash, investments and receivables held in the respective foreign currency. The Company’s use of foreign currency forward and option contracts is intended to minimize the effect of fluctuating foreign currencies on the value of non-U.S. dollar denominated assets and liabilities associated with its underwriting and non-investment operations. The Company may determine not to match a portion of its projected underwriting and non-investments related assets or liabilities with underlying foreign currency exposure with investments in the same currencies, which would increase its exposure to foreign currency fluctuations and potentially increase the impact and volatility of foreign exchange gains and losses on its results of operations. The fair value of the Company’s underwriting and non-investment operations related foreign currency contracts is determined using indicative pricing obtained from counterparties or broker quotes.
Investment Operations Related Foreign Currency Forward Contracts
The Company’s investment operations are exposed to currency fluctuations through its investments in non-U.S. dollar fixed maturity investments, short term investments and other investments. From time to time, the Company may employ foreign currency forward contracts in its investment portfolio to either assume foreign currency risk or to economically hedge its exposure to currency fluctuations from these investments. The fair value of the Company’s investment portfolio related foreign currency forward contracts is determined using an interpolated rate based on closing forward market rates.
Credit Derivatives
The Company’s exposure to credit risk is primarily due to its fixed maturity investments, short term investments, premiums receivable and reinsurance recoverable. From time to time, the Company may purchase credit derivatives to manage its exposures in the insurance industry, and to assist in managing the credit risk associated with ceded reinsurance. The Company also employs credit derivatives in its investment portfolio to either assume credit risk or manage its credit exposure.
Credit Default Swaps
The fair value of the Company’s credit default swaps is determined using industry valuation models, broker bid indications or internal pricing valuation techniques. The fair value of these credit default swaps can change based on a variety of factors including changes in credit spreads, default rates and recovery rates, the correlation of credit risk between the referenced credit and the counterparty, and market rate inputs such as interest rates.
Equity Derivatives
Equity Futures
From time to time, the Company uses equity derivatives in its investment portfolio to either assume equity risk or hedge its equity exposure. The fair value of the Company’s equity futures is determined using market-based prices from pricing vendors.
F-87
Commodity Derivatives
The Company uses commodity derivatives within its investments portfolio to assume or hedge risk. Commodity derivatives expose the Company to potentially unfavorable price changes to the underlying commodities.
Commodity Futures
The fair value of the Company’s commodity futures is determined using market-based prices from pricing vendors. The Company’s exposure is primarily in gold futures contracts.
Commodity Options
The fair value of these derivatives is determined using market-based prices from pricing vendors.
Derivative Instruments Designated as Hedges of Net Investments in Foreign Operations
Foreign Currency Derivatives
Hedges of Net Investments in Foreign Operations
One of the Company’s subsidiaries currently uses a non-U.S. dollar functional currency. The Company, from time to time, enters into foreign exchange forwards to hedge non-U.S. dollar functional currencies, on an after-tax basis, from changes in the exchange rate between the U.S. dollar and these currencies.
As of December 31, 2025 and 2024, this included the Australian dollar net investment in a foreign operation. These foreign exchange forward contracts were formally designated as hedges of its investment in subsidiaries with non-U.S. dollar functional currencies and there was no ineffectiveness in these transactions. The weighted average U.S. dollar equivalent of foreign denominated net assets (liabilities) that were hedged during the year ended December 31, 2025 was $60.2 million (2024 - $61.1 million).
NOTE 20. COMMITMENTS, CONTINGENCIES AND OTHER ITEMS
Concentration of Credit Risk
Instruments which potentially subject the Company to concentration of credit risk consist principally of investments, including the Company’s equity method investments, cash, premiums receivable and reinsurance balances. The Company limits the amount of credit exposure to any one financial institution and, except for the securities of the U.S. Government and the Federal National Mortgage Association, none of the Company’s fixed maturity and short term investments exceeded 10% of shareholders’ equity at December 31, 2025. Refer to “Note 7. Reinsurance,” for information with respect to reinsurance recoverable.
Employment Agreements
The Board has authorized the execution of employment agreements between the Company and certain officers. These agreements provide for, among other things, severance payments under certain circumstances, as well as accelerated vesting of options and certain restricted stock grants, upon a change in control, as defined in the employment agreements and the Company’s stock incentive plan.
Letters of Credit and Other Commitments
At December 31, 2025, the Company’s banks have issued secured and unsecured letters of credit totaling $528.8 million in favor of certain ceding companies. In connection with the Company’s Top Layer joint venture, Renaissance Reinsurance has committed $37.5 million of collateral to support a letter of credit and is obligated to make a mandatory capital contribution of up to $50.0 million in the event that a loss reduces Top Layer’s capital and surplus below a specified level.
Refer to “Note 9. Debt and Credit Facilities” for additional information related to the Company’s debt and credit facilities.
F-88
Investment Commitments
The Company has unfunded commitments, primarily to fund investments and certain externally managed fixed maturity investment portfolios of $3.9 billion at December 31, 2025. These commitments do not have a defined contractual commitment date. In the future, the Company may enter into additional commitments in respect of these investments or individual portfolio company investment opportunities.
Indemnifications and Warranties
In the ordinary course of its business, the Company may enter into contracts or agreements that contain indemnifications or warranties. Future events could occur that lead to the execution of these provisions against the Company. Based on past experience, management currently believes that the likelihood of such an event is remote.
Leases
The Company’s operating leases primarily relate to office space for its global underwriting platforms principally in Bermuda, Australia, Ireland, Singapore, Switzerland, the U.K. and the U.S. These leases expire at various dates through 2039 with a weighted average lease term of 5.6 years. Included in and at December 31, 2025 is a right-of-use asset of $97.1 million and a lease liability of $127.4 million, respectively, associated with the Company’s operating leases (2024 - $83.8 million and $114.3 million, respectively). During 2025, the Company recorded an operating lease expense of $15.6 million included in operational expenses (2024 - $14.8 million).
The Company’s financing leases primarily relate to office space in Bermuda with an initial lease term of 20 years, ending in 2028, and a bargain renewal option for an additional 30 years. Included in and at December 31, 2025 is a right-of-use asset of $15.6 million and a lease liability of $20.4 million, respectively, associated with the Company’s finance leases (2024 - $16.1 million and $21.0 million, respectively). During 2025, the Company recorded interest expense of $2.1 million associated with its finance leases (2024 - $2.1 million) included in interest expense and amortization of its finance leases right-to-use asset of $0.5 million included in operational expenses (2024 - $0.5 million).
Future minimum lease payments under existing operating and finance leases are detailed below, excluding the bargain renewal option on the finance lease related to office space in Bermuda:
| Future Minimum Lease Payments | |||||||||||||||||
| Operating Leases | Finance Leases | ||||||||||||||||
| 2026 | $ | $ | |||||||||||||||
| 2027 | |||||||||||||||||
| 2028 | |||||||||||||||||
| 2029 | |||||||||||||||||
| 2030 | |||||||||||||||||
| After 2030 | |||||||||||||||||
Future minimum lease payments under existing leases | $ | $ | |||||||||||||||
Legal Proceedings
The Company and its subsidiaries are subject to lawsuits and regulatory actions in the normal course of business that do not arise from or directly relate to claims on reinsurance treaties or contracts or direct surplus lines insurance policies. In the Company’s industry, business litigation may involve allegations of underwriting or claims-handling errors or misconduct, disputes relating to the scope of, or compliance with, the terms of delegated underwriting agreements, employment claims, regulatory actions or disputes arising from the Company’s business ventures. The Company’s operating subsidiaries are subject to claims litigation involving, among other things, disputed interpretations of policy coverages. Generally, the Company’s direct surplus lines insurance operations are subject to greater frequency and diversity of claims and claims-related litigation than its reinsurance operations and, in some jurisdictions, may be subject to
F-89
direct actions by allegedly injured persons or entities seeking damages from policyholders. These lawsuits, involving or arising out of claims on policies issued by the Company’s subsidiaries which are typical to the insurance industry in general and in the normal course of business, are considered in its loss and loss expense reserves. In addition, the Company may from time to time engage in litigation or arbitration related to its claims for payment in respect of ceded reinsurance, including disputes that challenge the Company’s ability to enforce its underwriting intent. Such matters could result, directly or indirectly, in providers of protection not meeting their obligations to the Company or not doing so on a timely basis. The Company may also be subject to other disputes from time to time, relating to operational or other matters distinct from insurance or reinsurance claims. Any litigation or arbitration, or regulatory process, contains an element of uncertainty, and the value of an exposure or a gain contingency related to a dispute is difficult to estimate. The Company believes that no individual litigation or arbitration to which it is presently a party is likely to have a material adverse effect on its financial condition, business or operations.
NOTE 21. SUBSEQUENT EVENTS
Share Repurchase Program
Subsequent to December 31, 2025 and through the period ended February 6, 2026, the Company repurchased 470,930 common shares at an aggregate cost of $130.0 million and an average price of $276.04 per common share.
On February 11, 2026, the Board approved a renewal of the authorized share repurchase program for an aggregate amount of up to $750.0 million.
DaVinci
Effective January 1, 2026, DaVinci repurchased an aggregate of $750.0 million of its shares from investors, including $182.5 million from the Company. In addition, RenaissanceRe purchased an aggregate of $81.3 million of shares from third-party investors. The Company’s noncontrolling economic ownership in DaVinci subsequent to these transactions was 26.3 %.
Fontana
Effective January 1, 2026, RenaissanceRe purchased an aggregate of $79.3 million of limited partner interest in Fontana from third-party investors. The Company’s noncontrolling economic ownership in Fontana subsequent to these transactions was 38.4 %.
Medici
Effective in January 2026, Medici issued an aggregate of $43.0 million of non-voting preference shares to investors and redeemed an aggregate of $27.4 million. At December 31, 2025, $43.0 million, representing the amount received from investors other than the Company prior to January 1, 2026, is included in other liabilities on the Company’s consolidated balance sheet, and also included in cash flows provided by financing activities on the Company’s consolidated statements of cash flows for 2025. The Company’s noncontrolling economic ownership in Medici subsequent to these transactions was 11.5 %.
Vermeer
In January 2026, Vermeer declared and paid a dividend of $150.0 million, all of which was paid to a third-party investor.
F-90
RENAISSANCERE HOLDINGS LTD. AND SUBSIDIARIES
INDEX TO SCHEDULES TO CONSOLIDATED FINANCIAL STATEMENTS
| Page | |||||||||||
| I | |||||||||||
| II | |||||||||||
| III | |||||||||||
| IV | |||||||||||
| VI | |||||||||||
Schedules other than those listed above are omitted for the reason that they are not applicable.
S-1
SCHEDULE I
RENAISSANCERE HOLDINGS LTD. AND SUBSIDIARIES
SUMMARY OF INVESTMENTS
OTHER THAN INVESTMENTS IN RELATED PARTIES
(THOUSANDS OF UNITED STATES DOLLARS)
| December 31, 2025 | |||||||||||||||||
Type of Investment | Amortized Cost or Cost | Fair Value | Amount at Which Shown in the Balance Sheet | ||||||||||||||
Fixed maturity investments trading | |||||||||||||||||
| U.S. treasuries | $ | $ | $ | ||||||||||||||
| Corporate | |||||||||||||||||
| Residential mortgage-backed | |||||||||||||||||
| Asset-backed | |||||||||||||||||
| Non-U.S. government | |||||||||||||||||
| Agencies | |||||||||||||||||
| Commercial mortgage-backed | |||||||||||||||||
Total fixed maturity investments trading | |||||||||||||||||
| Short term investments | |||||||||||||||||
| Equity investments | |||||||||||||||||
| Fixed income exchange traded funds | |||||||||||||||||
Common stock | |||||||||||||||||
Total equity investments | |||||||||||||||||
| Other investments | |||||||||||||||||
| Fund investments | |||||||||||||||||
| Catastrophe bonds | |||||||||||||||||
| Direct private equity investments | |||||||||||||||||
| Total other investments | |||||||||||||||||
| Investments in other ventures, under equity method | |||||||||||||||||
| Total investments | $ | $ | |||||||||||||||
S-2
SCHEDULE II
RENAISSANCERE HOLDINGS LTD.
CONDENSED FINANCIAL INFORMATION OF REGISTRANT
RENAISSANCERE HOLDINGS LTD.
BALANCE SHEETS
AT DECEMBER 31, 2025 AND 2024
(PARENT COMPANY)
(THOUSANDS OF UNITED STATES DOLLARS)
| At December 31, | |||||||||||
| 2025 | 2024 | ||||||||||
| Assets | |||||||||||
Fixed maturity investments trading, at fair value - amortized cost $ | $ | $ | |||||||||
Short term investments, at fair value - amortized cost $ | |||||||||||
| Total investments | |||||||||||
Cash and cash equivalents | |||||||||||
Investments in subsidiaries | |||||||||||
Due from subsidiaries | |||||||||||
Accrued investment income | |||||||||||
Deferred tax asset | |||||||||||
Receivable for investments sold | |||||||||||
Other assets | |||||||||||
Goodwill and other intangible assets | |||||||||||
| Total assets | $ | $ | |||||||||
| Liabilities and Shareholders’ Equity | |||||||||||
| Liabilities | |||||||||||
Debt | $ | $ | |||||||||
Due to subsidiaries | |||||||||||
Other liabilities | |||||||||||
| Total liabilities | |||||||||||
| Shareholders’ Equity | |||||||||||
Preference shares: $ | |||||||||||
Common shares: $ | |||||||||||
| Additional paid-in capital | |||||||||||
| Accumulated other comprehensive income (loss) | ( | ( | |||||||||
| Retained earnings | |||||||||||
Total shareholders’ equity attributable to RenaissanceRe | |||||||||||
| Total liabilities and shareholders’ equity | $ | $ | |||||||||
S-3
SCHEDULE II
RENAISSANCERE HOLDINGS LTD.
CONDENSED FINANCIAL INFORMATION OF REGISTRANT – CONTINUED
RENAISSANCERE HOLDINGS LTD.
STATEMENTS OF OPERATIONS
FOR THE YEARS ENDED DECEMBER 31, 2025, 2024 AND 2023
(PARENT COMPANY)
(THOUSANDS OF UNITED STATES DOLLARS)
| Year ended December 31, | |||||||||||||||||
| 2025 | 2024 | 2023 | |||||||||||||||
| Revenues | |||||||||||||||||
Net investment income | $ | $ | $ | ||||||||||||||
Net foreign exchange gains (losses) | ( | ||||||||||||||||
Other income (loss) | ( | ( | |||||||||||||||
| Net realized and unrealized gains (losses) on investments | ( | ( | ( | ||||||||||||||
| Total revenues | |||||||||||||||||
| Expenses | |||||||||||||||||
Operational expenses | |||||||||||||||||
Corporate expenses | |||||||||||||||||
Interest expense | |||||||||||||||||
| Total expenses | |||||||||||||||||
Income (loss) before equity in net income (loss) of subsidiaries | ( | ( | ( | ||||||||||||||
| Equity in net income (loss) of subsidiaries | |||||||||||||||||
Income (loss) before taxes | |||||||||||||||||
Income tax benefit (expense) | ( | ||||||||||||||||
| Net income (loss) | |||||||||||||||||
Dividends on preference shares | ( | ( | ( | ||||||||||||||
| Net income (loss) available (attributable) to RenaissanceRe common shareholders | $ | $ | $ | ||||||||||||||
RENAISSANCERE HOLDINGS LTD.
STATEMENTS OF COMPREHENSIVE INCOME (LOSS)
FOR THE YEARS ENDED DECEMBER 31, 2025, 2024 AND 2023
(PARENT COMPANY)
(THOUSANDS OF UNITED STATES DOLLARS)
| Year ended December 31, | |||||||||||||||||
| 2025 | 2024 | 2023 | |||||||||||||||
| Comprehensive income (loss) | |||||||||||||||||
| Net income (loss) | $ | $ | $ | ||||||||||||||
| Change in net unrealized gains (losses) on investments, net of tax | |||||||||||||||||
| Foreign currency translation adjustments, net of tax | ( | ||||||||||||||||
| Comprehensive income (loss) attributable to RenaissanceRe | $ | $ | $ | ||||||||||||||
S-4
SCHEDULE II
RENAISSANCERE HOLDINGS LTD.
CONDENSED FINANCIAL INFORMATION OF REGISTRANT – CONTINUED
RENAISSANCERE HOLDINGS LTD.
STATEMENTS OF CASH FLOWS
FOR THE YEARS ENDED DECEMBER 31, 2025, 2024 AND 2023
(PARENT COMPANY)
(THOUSANDS OF UNITED STATES DOLLARS)
| Year ended December 31, | |||||||||||||||||
| 2025 | 2024 | 2023 | |||||||||||||||
Cash flows provided by (used in) operating activities | |||||||||||||||||
| Net income (loss) | $ | $ | $ | ||||||||||||||
Less: equity in net income (loss) of subsidiaries | ( | ( | ( | ||||||||||||||
| ( | ( | ( | |||||||||||||||
| Adjustments to reconcile net income (loss) to net cash provided by (used in) operating activities | |||||||||||||||||
| Net realized and unrealized (gains) losses on investments | |||||||||||||||||
| Other | |||||||||||||||||
| Net cash provided by (used in) operating activities | ( | ( | ( | ||||||||||||||
Cash flows provided by (used in) investing activities | |||||||||||||||||
Proceeds from sales and maturities of fixed maturity investments trading | |||||||||||||||||
| Purchases of fixed maturity investments trading | ( | ( | ( | ||||||||||||||
| Net sales (purchases) of short term investments | ( | ||||||||||||||||
| Dividends and return of capital from subsidiaries | |||||||||||||||||
| Contributions to subsidiaries | ( | ( | ( | ||||||||||||||
Due to (from) subsidiary | ( | ( | ( | ||||||||||||||
Due to (from) subsidiary for the purchase of Validus Specialty | ( | ||||||||||||||||
Purchase of Validus Holdings and Talbot Treaty Renewal Rights | ( | ||||||||||||||||
| Net cash provided by (used in) investing activities | ( | ||||||||||||||||
Cash flows provided by (used in) financing activities | |||||||||||||||||
| Dividends paid – RenaissanceRe common shares | ( | ( | ( | ||||||||||||||
| Dividends paid – preference shares | ( | ( | ( | ||||||||||||||
| RenaissanceRe common share repurchases | ( | ( | |||||||||||||||
RenaissanceRe common share issuance, net of expenses | |||||||||||||||||
| Issuance of debt, net of expenses | |||||||||||||||||
| Drawdown of Medici Revolving Credit Facility | ( | ||||||||||||||||
| Taxes paid on withholding shares | ( | ( | ( | ||||||||||||||
| Net cash provided by (used in) financing activities | ( | ( | |||||||||||||||
| Effect of exchange rate changes on foreign currency cash | |||||||||||||||||
| Net increase (decrease) in cash and cash equivalents | ( | ||||||||||||||||
| Cash and cash equivalents, beginning of year | |||||||||||||||||
| Cash and cash equivalents, end of year | $ | $ | $ | ||||||||||||||
S-5
SCHEDULE III
RENAISSANCERE HOLDINGS LTD. AND SUBSIDIARIES
SUPPLEMENTARY INSURANCE INFORMATION
(THOUSANDS OF UNITED STATES DOLLARS)
| December 31, 2025 | Year ended December 31, 2025 | ||||||||||||||||||||||||||||||||||||||||||||||||||||
| Deferred Policy Acquisition Costs | Future Policy Benefits, Losses, Claims and Loss Expenses | Unearned Premiums | Premium Revenue | Net Investment Income | Benefits, Claims, Losses and Settlement Expenses | Amortization of Deferred Policy Acquisition Costs | Other Operating Expenses | Net Written Premiums | |||||||||||||||||||||||||||||||||||||||||||||
| Property | $ | $ | $ | $ | $ | $ | $ | $ | $ | ||||||||||||||||||||||||||||||||||||||||||||
| Casualty and Specialty | |||||||||||||||||||||||||||||||||||||||||||||||||||||
| Other | |||||||||||||||||||||||||||||||||||||||||||||||||||||
| Total | $ | $ | $ | $ | $ | $ | $ | $ | $ | ||||||||||||||||||||||||||||||||||||||||||||
| December 31, 2024 | Year ended December 31, 2024 | ||||||||||||||||||||||||||||||||||||||||||||||||||||
| Deferred Policy Acquisition Costs | Future Policy Benefits, Losses, Claims and Loss Expenses | Unearned Premiums | Premium Revenue | Net Investment Income | Benefits, Claims, Losses and Settlement Expenses | Amortization of Deferred Policy Acquisition Costs | Other Operating Expenses | Net Written Premiums | |||||||||||||||||||||||||||||||||||||||||||||
| Property | $ | $ | $ | $ | $ | $ | $ | $ | $ | ||||||||||||||||||||||||||||||||||||||||||||
| Casualty and Specialty | |||||||||||||||||||||||||||||||||||||||||||||||||||||
| Other | |||||||||||||||||||||||||||||||||||||||||||||||||||||
| Total | $ | $ | $ | $ | $ | $ | $ | $ | $ | ||||||||||||||||||||||||||||||||||||||||||||
| December 31, 2023 | Year ended December 31, 2023 | ||||||||||||||||||||||||||||||||||||||||||||||||||||
| Deferred Policy Acquisition Costs | Future Policy Benefits, Losses, Claims and Loss Expenses | Unearned Premiums | Premium Revenue | Net Investment Income | Benefits, Claims, Losses and Settlement Expenses | Amortization of Deferred Policy Acquisition Costs | Other Operating Expenses | Net Written Premiums | |||||||||||||||||||||||||||||||||||||||||||||
| Property | $ | $ | $ | $ | $ | $ | $ | $ | $ | ||||||||||||||||||||||||||||||||||||||||||||
| Casualty and Specialty | |||||||||||||||||||||||||||||||||||||||||||||||||||||
| Other | |||||||||||||||||||||||||||||||||||||||||||||||||||||
| Total | $ | $ | $ | $ | $ | $ | $ | $ | $ | ||||||||||||||||||||||||||||||||||||||||||||
S-6
SCHEDULE IV
RENAISSANCERE HOLDINGS LTD. AND SUBSIDIARIES
SUPPLEMENTAL SCHEDULE OF REINSURANCE PREMIUMS
(THOUSANDS OF UNITED STATES DOLLARS)
Property and Liability Premiums Earned | Gross Amounts | Ceded to Other Companies | Assumed From Other Companies | Net Amount | Percentage of Amount Assumed to Net | ||||||||||||||||||||||||
| Year ended December 31, 2025 | $ | $ | $ | $ | % | ||||||||||||||||||||||||
| Year ended December 31, 2024 | $ | $ | $ | $ | % | ||||||||||||||||||||||||
| Year ended December 31, 2023 | $ | $ | $ | $ | % | ||||||||||||||||||||||||
SCHEDULE VI
RENAISSANCERE HOLDINGS LTD. AND SUBSIDIARIES
SUPPLEMENTARY INSURANCE INFORMATION CONCERNING
PROPERTY-CASUALTY INSURANCE OPERATIONS
(THOUSANDS OF UNITED STATES DOLLARS)
| Affiliation with Registrant | Deferred Policy Acquisition Costs | Reserves for Unpaid Claims and Claim Adjustment Expenses | Discount, if any, Deducted | Unearned Premiums | Earned Premiums | Net Investment Income | |||||||||||||||||||||||||||||
| Consolidated Subsidiaries | |||||||||||||||||||||||||||||||||||
| Year ended December 31, 2025 | $ | $ | $ | $ | $ | $ | |||||||||||||||||||||||||||||
| Year ended December 31, 2024 | $ | $ | $ | $ | $ | $ | |||||||||||||||||||||||||||||
| Year ended December 31, 2023 | $ | $ | $ | $ | $ | $ | |||||||||||||||||||||||||||||
| Claims and Claim Adjustment Expenses Incurred Related to | Amortization of Deferred Policy Acquisition Costs | Paid Claims and Claim Adjustment Expenses | Net Premiums Written | ||||||||||||||||||||||||||||||||
| Affiliation with Registrant | Current Year | Prior Year | |||||||||||||||||||||||||||||||||
| Consolidated Subsidiaries | |||||||||||||||||||||||||||||||||||
| Year ended December 31, 2025 | $ | $ | ( | $ | $ | $ | |||||||||||||||||||||||||||||
| Year ended December 31, 2024 | $ | $ | ( | $ | $ | $ | |||||||||||||||||||||||||||||
| Year ended December 31, 2023 | $ | $ | ( | $ | $ | $ | |||||||||||||||||||||||||||||
S-7