10-K: Annual report pursuant to Section 13 and 15(d)
Published on February 20, 2009
Table of Contents
UNITED STATES
SECURITIES AND EXCHANGE COMMISSION
WASHINGTON, D.C. 20549
FORM 10-K
x ANNUAL REPORT PURSUANT TO SECTION 13 OR 15(d) OF
THE SECURITIES EXCHANGE ACT OF 1934
For The Fiscal Year Ended December 31, 2008
OR
¨ TRANSITION REPORT PURSUANT TO SECTION 13 OR 15(d) OF
THE SECURITIES EXCHANGE ACT OF 1934
For the transition period from to
Commission File No. 001-14428
RENAISSANCERE HOLDINGS LTD.
(Exact Name Of Registrant As Specified In Its Charter)
| Bermuda | 98-014-1974 | |
| (State or Other Jurisdiction of | (I.R.S. Employer | |
| Incorporation or Organization) | Identification Number) |
Renaissance House, 8-20 East Broadway, Pembroke HM 19 Bermuda
(Address of Principal Executive Offices)
(441) 295-4513
(Registrants telephone number)
Securities registered pursuant to Section 12(b) of the Act:
| Title of each class | Name of each exchange on which registered | |
| Common Shares, Par Value $1.00 per share |
New York Stock Exchange, Inc. | |
| Series B 7.30% Preference Shares, Par Value $1.00 per share |
New York Stock Exchange, Inc. | |
| Series C 6.08% Preference Shares, Par Value $1.00 per share |
New York Stock Exchange, Inc. | |
| Series D 6.60% Preference Shares, Par Value $1.00 per share |
New York Stock Exchange, Inc. |
Securities registered pursuant to Section 12(g) of the Act: None
Indicate by check mark if the registrant is a well-known seasoned issuer (as defined in Rule 405 of the Act).
Yes x No ¨
Indicate by check mark if the registrant is not required to file reports pursuant to Section 13 or Section 15(d) of the Act. Yes ¨ No x
Indicate by check mark whether the registrant (1) has filed all reports required to be filed by Section 13 or 15(d) of the Securities Exchange Act of 1934 during the preceding 12 months (or for such shorter period that the registrant was required to file such reports), and (2) has been subject to such filing requirements for the past 90 days.
Yes x No ¨
Indicate by check mark if disclosure of delinquent filers pursuant to Item 405 of Regulation S-K is not contained herein, and will not be contained, to the best of registrants knowledge, in definitive proxy or information statements incorporated by reference in Part III of this Form 10-K or any amendment to this Form 10-K. ¨
Indicate by check mark whether the registrant is a large accelerated filer, an accelerated filer, a non-accelerated filer, or a smaller reporting company, as defined in Rule 12b-2 of the Act. Large accelerated filer x, Accelerated filer ¨, Non-accelerated filer ¨, Smaller reporting company ¨
Indicate by check mark whether the registrant is a shell company (as defined in Rule 12b-2 of the Act).
Yes ¨ No x
The aggregate market value of Common Shares held by nonaffiliates of the registrant at June 30, 2008 was $2,677.0 million based on the closing sale price of the Common Shares on the New York Stock Exchange on that date.
The number of Common Shares outstanding at February 11, 2009 was 61,500,840.
The information required by Part III of this report, to the extent not set forth herein, is incorporated by reference to the registrants Definitive Proxy Statement to be filed in respect of our 2009 Annual General Meeting of Shareholders.
Table of Contents
RENAISSANCERE HOLDINGS LTD.
| Page | ||||
| 3 | ||||
| ITEM 1. |
7 | |||
| ITEM 1A. |
38 | |||
| ITEM 1B. |
53 | |||
| ITEM 2. |
61 | |||
| ITEM 3. |
61 | |||
| ITEM 4. |
62 | |||
| 62 | ||||
| ITEM 5. |
62 | |||
| ITEM 6. |
65 | |||
| ITEM 7. |
MANAGEMENTS DISCUSSION AND ANALYSIS OF FINANCIAL CONDITION AND RESULTS OF OPERATIONS |
67 | ||
| ITEM 7A. |
129 | |||
| ITEM 8. |
131 | |||
| ITEM 9. |
CHANGES IN AND DISAGREEMENTS WITH ACCOUNTANTS ON ACCOUNTING AND FINANCIAL DISCLOSURE |
131 | ||
| ITEM 9A. |
132 | |||
| ITEM 9B. |
132 | |||
| 133 | ||||
| ITEM 10. |
133 | |||
| ITEM 11. |
133 | |||
| ITEM 12. |
SECURITY OWNERSHIP OF CERTAIN BENEFICIAL OWNERS AND MANAGEMENT AND RELATED SHAREHOLDER MATTERS |
133 | ||
| ITEM 13. |
CERTAIN RELATIONSHIPS AND RELATED TRANSACTIONS, AND DIRECTOR INDEPENDENCE |
133 | ||
| ITEM 14. |
133 | |||
| 134 | ||||
| ITEM 15. |
134 | |||
| 138 | ||||
Table of Contents
Unless the context otherwise requires, references in this Form 10-K to RenaissanceRe or the Company mean RenaissanceRe Holdings Ltd. and its subsidiaries, which include, but are not limited to, the following entities named herein.
Agro National Inc. (Agro National)
Accurate Environmental Forecasting Inc. (AEF)
Glencoe Group Claims Management Inc. (Glencoe Claims)
Glencoe Group Holdings Ltd. (Glencoe Group)
Glencoe Insurance Ltd. (Glencoe)
Glencoe Specialty Holdings Inc. (Glencoe Holdings)
Glencoe Specialty Services Inc. (Glencoe Specialty Services)
Glencoe U.S. Holdings Inc. (Glencoe U.S.)
Lantana Insurance Ltd. (Lantana)
Renaissance Investment Holdings Ltd. (RIHL)
Renaissance Investment Management Company Limited. (RIMCO)
Renaissance Other Investments Holdings Ltd. (ROIHL)
Renaissance Reinsurance Ltd. (Renaissance Reinsurance)
Renaissance Reinsurance of Europe (Renaissance Europe)
Renaissance Trading Ltd. (RTL)
Renaissance Underwriting Managers, Ltd. (RUM)
RenaissanceRe Capital Trust (Capital Trust)
RenaissanceRe Services Ltd. (Renaissance Services)
RenaissanceRe Ventures Ltd. (Ventures)
RenRe Investment Managers Ltd. (RIM)
RenTech U.S. Holdings Inc. (RenTech)
Starbound Reinsurance Ltd. (Starbound Re)
Starbound Reinsurance II Ltd. (Starbound II)
Stonington Insurance Company (Stonington)
Timicuan Reinsurance Ltd. (Tim Re)
Weather Predict Inc. (Weather Predict)
WeatherPredict Consulting Inc. (WP Consulting)
We also underwrite reinsurance on behalf of joint ventures, principally including Top Layer Reinsurance Ltd. (Top Layer Re), recorded under the equity method of accounting, and DaVinci Reinsurance Ltd. (DaVinci). The financial results of DaVinci and DaVincis parent company, DaVinciRe Holdings Ltd. (DaVinciRe), are consolidated in our financial statements. For your convenience, we have included a glossary beginning on page 54 of selected insurance and reinsurance terms. All dollar amounts referred to in this Form 10-K are in U.S. dollars unless otherwise indicated. Any discrepancies in the tables included herein between the amounts listed and the totals thereof are due to rounding.
NOTE ON FORWARD-LOOKING STATEMENTS
This Form 10-K contains forward-looking statements within the meaning of Section 27A of the Securities Act of 1933, as amended, and Section 21E of the Securities Exchange Act of 1934, as amended (the Exchange Act). Forward-looking statements are necessarily based on estimates and assumptions that are inherently subject to significant business, economic and competitive uncertainties and contingencies, many of which, with respect to future business decisions, are subject to change. These uncertainties and contingencies can affect actual results and could cause actual results to differ materially from those expressed in any forward-looking statements made by, or on behalf of, us.
In particular, statements using words such as may, should, estimate, expect, anticipate, intends, believe, predict, potential, or words of similar import generally involve forward-looking statements. For example, we may include certain forward-looking statements in Managements Discussion and Analysis of Financial Condition and Results of Operations with regard to trends in results, prices, volumes, operations, investment results, margins, combined ratios, reserves, overall market trends, risk management and exchange rates. This Form 10-K also contains forward-looking statements with respect to
3
Table of Contents
our business and industry, such as those relating to our strategy and management objectives, trends in market conditions, market standing and product volumes, investment results, government initiatives and regulatory matters, and pricing conditions in the reinsurance and insurance industries.
In light of the risks and uncertainties inherent in all future projections, the inclusion of forward-looking statements in this report should not be considered as a representation by us or any other person that our objectives or plans will be achieved. Numerous factors could cause our actual results to differ materially from those addressed by the forward-looking statements, including the following:
| | we are exposed to significant losses from catastrophic events and other exposures that we cover, which we expect to cause significant volatility in our financial results from time to time; |
| | the frequency and severity of catastrophic events or other events which we cover could exceed our estimates and cause losses greater than we expect; |
| | risks associated with implementing our business strategies and initiatives, including risks related to developing or enhancing the operations, controls and other infrastructure necessary in respect of our more recent, new or proposed initiatives; |
| | risks relating to adverse legislative developments including, the risk of new legislation in Florida continuing to expand the reinsurance coverages offered by the Florida Hurricane Catastrophe Fund (FHCF) and the insurance policies written by the state-sponsored Citizens Property Insurance Corporation (Citizens); failing to reduce such coverages or implementing new programs which reduce the size of the private market; and the risk that new, state based or federal legislation will be enacted and adversely impact us; |
| | the risk of the lowering or loss of any of the ratings of RenaissanceRe or of one or more of our subsidiaries or changes in the policies or practices of the rating agencies; |
| | risks relating to our strategy of relying on third party program managers, third party administrators, and other vendors to support our Individual Risk operations; |
| | risks due to our dependence on a few insurance and reinsurance brokers for a large portion of our revenue, a risk we believe is increasing as a larger portion of our business is provided by a small number of these brokers, a trend which we believe has been accelerated by the recent merger of AON Corporation (AON) and Benfield Group Limited (Benfield); |
| | the risk we might be bound to policyholder obligations beyond our underwriting intent, and the risk that our third party program managers or agents may elect not to continue or renew their programs with us; |
| | the inherent uncertainties in our reserving process, including those related to the 2005 and 2008 catastrophes, which uncertainties we believe are increasing as we diversify into new product classes; |
| | failures of our reinsurers, brokers, third party program managers or other counterparties to honor their obligations to us, including their obligations to make third party payments for which we might be liable, the risk of which may be heightened during the current period of financial market dislocation; |
| | risks resulting from the fact that our portfolio of business continues to be increasingly characterized by a relatively small number of relatively large transactions with reinsurance clients, third party program managers or companies with whom we do business; |
| | risks associated with appropriately modeling, pricing for, and contractually addressing new or potential factors in loss emergence, such as the trend toward potentially significant global warming and other aspects of climate change which have the potential to adversely affect our business, or the ongoing financial crisis, which could cause us to underestimate our exposures and potentially adversely impact our financial results; |
| | risks associated with a sustained weakness or weakening in business and economic conditions, specifically in the principal markets in which we do business, which may adversely affect the demand for our products and ultimately our business and operating results; |
4
Table of Contents
| | risks relating to continuing deterioration in the investment markets and current economic conditions which could adversely affect our net investment income and lead to investment losses, particularly with respect to our illiquid investments in asset classes experiencing significant volatility; |
| | risks associated with highly subjective judgments, such as valuing our more illiquid assets, and determining the impairments taken on our investments, which could impact our financial position or operating results; |
| | risks associated with our investment portfolio, including the risk that investment managers may breach our investment guidelines, or the inability of such guidelines to mitigate risks arising out of the ongoing financial crisis; |
| | changes in economic conditions, including interest rate, currency, equity and credit conditions which could affect our investment portfolio or declines in our investment returns for other reasons which could reduce our profitability and hinder our ability to pay claims promptly in accordance with our strategy, which risks we believe are currently enhanced in light of the ongoing financial crisis, both globally and in the U.S.; |
| | we are exposed to counterparty credit risk, including with respect to reinsurance brokers, clients, agents, retrocessionaires, capital providers and parties associated with our investment portfolio, which risks we believe to be currently heightened as a result of the global economic downturn; |
| | risks relating to the availability and collectability of third party reinsurance and other coverages purchased by our Reinsurance and Individual Risk operations; |
| | emerging claims and coverage issues, which could expand our obligations beyond the amount we intend to underwrite; |
| | loss of services of any one of our key executive officers, or difficulties associated with the transition of new members of our senior management team; |
| | a contention by the U.S. Internal Revenue Service that Renaissance Reinsurance, or any of our other Bermuda subsidiaries, is subject to U.S. taxation; |
| | the passage of federal or state legislation subjecting Renaissance Reinsurance or our other Bermuda subsidiaries to supervision, regulation or taxation in the U.S. or other jurisdictions in which we operate; |
| | changes in insurance regulations in the U.S. or other jurisdictions in which we operate, including the risks that U.S. federal or state governments will take actions to diminish the size of the private markets in respect of the coverages we offer, the risk of potential challenges to the Companys claim of exemption from insurance regulation under current laws and the risk of increased global regulation of the insurance and reinsurance industry; |
| | operational risks, including system or human failures; |
| | risks that we may require additional capital in the future, particularly after a catastrophic event or to support potential growth opportunities in our business, which may not be available or may be available only on unfavorable terms, risks which we believe to be heightened during the ongoing financial market crisis; |
| | risks relating to failure to comply with covenants in our debt agreements; |
| | risks relating to the inability of our operating subsidiaries to declare and pay dividends to the Company; |
| | acquisitions or strategic investments that we have made or may make could turn out to be unsuccessful; |
| | the risk that ongoing or future industry regulatory developments will disrupt our business, or that of our business partners, or mandate changes in industry practices in ways that increase our costs, decrease our revenues or require us to alter aspects of the way we do business; |
5
Table of Contents
| | we operate in a highly competitive environment, which we expect to increase over time, including from the relatively new entrants formed following hurricane Katrina, from new competition from non-traditional participants as capital markets products provide alternatives and replacements for our more traditional reinsurance and insurance products and as a result of consolidation in the (re)insurance industry; |
| | risks arising out of possible changes in the distribution or placement of risks due to increased consolidation of clients or insurance and reinsurance brokers, or third party program managers, or from potential changes in their business practices which may be required by future regulatory changes; |
| | the risk that there could be regulations or legislative changes adversely impacting us, as a Bermuda-based company, relative to our competitors, or actions taken by multinational organizations having such an impact; |
| | extraordinary events affecting our clients or brokers, such as bankruptcies and liquidations, and the risk that we may not retain or replace our large clients, the risk of which may be heightened during the ongoing financial market crisis; |
| | acts of terrorism, war or political unrest; |
| | risks relating to changes in regulatory regimes and/or accounting rules, such as the roadmap to International Financial Reporting Standards (IFRS), which could result in significant changes to our financial results; and |
| | the risk that we could be deemed to have failed to comply with the terms of the Companys settlement agreement, or otherwise to have cooperated, with the Securities and Exchange Commission (SEC). |
The factors listed above should not be construed as exhaustive. Certain of these risk factors and others are described in more detail in Item 1A. Risk Factors below. We undertake no obligation to release publicly the results of any future revisions we may make to forward-looking statements to reflect events or circumstances after the date hereof or to reflect the occurrence of unanticipated events.
6
Table of Contents
GENERAL
RenaissanceRe, established in Bermuda in 1993 to write principally property catastrophe reinsurance, is today a leading global provider of reinsurance and insurance coverages and related services. Through our operating subsidiaries, we seek to obtain a portfolio of reinsurance, insurance and financial risks in each of our businesses that are significantly better than the market average and produce an attractive return on equity. We accomplish this by leveraging our core capabilities of risk assessment and information management, and by investing in our capabilities to serve our customers across the cycles that have historically characterized our markets. Overall, our strategy focuses on superior risk selection, marketing, capital management and joint ventures. We provide value to our clients and joint venture partners in the form of financial security, innovative products, and responsive service. We are known as a leader in paying valid reinsurance claims promptly. We principally measure our financial success through long-term growth in tangible book value per common share plus accumulated dividends, which we believe is the most appropriate measure of our Companys performance, and believe we have delivered superior performance in respect of this measure over time.
Our core products include property catastrophe reinsurance, which we write through our principal operating subsidiary Renaissance Reinsurance and joint ventures, principally DaVinci and Top Layer Re; specialty reinsurance risks written through Renaissance Reinsurance and DaVinci; and primary insurance and quota share reinsurance, which we write through the operating subsidiaries of the Glencoe Group. We believe that we are one of the worlds leading providers of property catastrophe reinsurance. We also believe we have a strong position in certain specialty reinsurance lines of business and are building a unique franchise in the U.S. program business. Our reinsurance and insurance products are principally distributed through intermediaries, with whom we seek to cultivate strong relationships.
We conduct our business through two reportable segments, Reinsurance and Individual Risk. For the year ended December 31, 2008, our Reinsurance and Individual Risk segments accounted for approximately 66% and 34%, respectively, of our total consolidated gross premiums written. Our segments are more fully described in Business Segments below.
CORPORATE STRATEGY
We seek to generate long-term growth in tangible book value per common share plus accumulated dividends for our shareholders by pursuing the following strategic objectives:
| |
Superior Risk Selection. We seek to underwrite our reinsurance, insurance and financial risks through the use of sophisticated risk selection techniques, including computer models and databases, such as the Renaissance Exposure Management System (REMS©) and the Program Analysis Central Repository (PACeR). We pursue a disciplined approach to underwriting and only select those risks that we believe will produce an attractive return on equity, subject to prudent risk constraints. |
| | Superior Marketing. We believe our modeling and technical expertise, and the risk management advice that we provide to our clients, has enabled us to become a provider of first choice in many lines of business to our customers worldwide. We seek to offer stable, predictable and consistent risk-based pricing and a prompt turnaround on our claims. |
| | Superior Capital Management. We generally seek to write as much attractively priced business as is available to us and then manage our capital accordingly. Accordingly, we generally seek to raise capital when we forecast an increased demand in the market, at times by accessing capital through joint ventures or other structures and seek to return capital to our shareholders or joint venture investors when the demand for our coverages appears to decline, and we believe a return of capital would be beneficial to our shareholders or joint venture investors. |
| | Superior Joint Ventures. Building upon our relationships and expertise in risk selection, marketing and capital management, we seek to pursue and execute on joint venture and investment opportunities, which include new partners and diversifying classes of business. We believe our focus on our joint ventures allows us to leverage our access to business and our |
7
Table of Contents
| underwriting capabilities on an efficient capital base, develop fee income, and diversify our portfolio. We routinely evaluate and expect that we may in the future pursue additional joint venture opportunities and strategic investments. |
We believe we are well positioned to fulfill these objectives by virtue of the experience and skill of our management team, our significant financial strength, and our strong relationships with brokers and clients. In addition, we believe our superior service, our proprietary modeling technology, and our extensive business relationships, which have enabled us to become a leader in the property catastrophe reinsurance market, will be instrumental in allowing us to achieve our strategic objectives. In particular, we believe our strategy, high performance and ethical culture, and commitment to our clients and joint venture partners permit us to differentiate ourselves by offering specialized services and products at times and in markets where capacity and alternatives may be limited.
BUSINESS SEGMENTS
We conduct our business through two reportable segments, Reinsurance and Individual Risk. Financial data relating to our two segments is included in Item 7. Managements Discussion and Analysis of Financial Condition and Results of Operations.
Reinsurance Segment
Our Reinsurance operations are comprised of three units: 1) property catastrophe reinsurance, primarily written through Renaissance Reinsurance and DaVinci; 2) specialty reinsurance, primarily written through Renaissance Reinsurance and DaVinci; and 3) certain other activities of ventures as described herein. Our Reinsurance operations are managed by the President of Renaissance Reinsurance, who leads a team of underwriters, risk modelers and other industry professionals, who have access to our proprietary risk management, underwriting and modeling resources and tools. We believe the expertise of our underwriting and modeling team and our proprietary analytic tools, together with superior customer service, provide us with a significant competitive advantage.
Our portfolio of business has continued to be increasingly characterized by relatively large transactions with ceding companies with whom we do business, although no current relationship exceeds 15% of our gross premiums written. Accordingly, our gross premiums written are subject to significant fluctuations depending on our success in maintaining or expanding our relationships with these large customers. We believe that recent market dynamics, and trends in our industry in respect of potential future consolidation, have increased our exposure to the risks of broker, client and counterparty concentration.
The following table shows our total catastrophe and specialty reinsurance gross premiums written:
| Year ended December 31, |
2008 | 2007 | 2006 | ||||||
| (in thousands) | |||||||||
| Renaissance catastrophe premiums |
$ | 633,611 | $ | 662,987 | $ | 773,638 | |||
| Renaissance specialty premiums |
153,701 | 277,882 | 198,111 | ||||||
| Total Renaissance premiums |
787,312 | 940,869 | 971,749 | ||||||
| DaVinci catastrophe premiums |
361,010 | 340,117 | 325,476 | ||||||
| DaVinci specialty premiums |
6,069 | 9,434 | 23,938 | ||||||
| Total DaVinci premiums |
367,079 | 349,551 | 349,414 | ||||||
| Total Reinsurance premiums |
$ | 1,154,391 | $ | 1,290,420 | $ | 1,321,163 | |||
| Total specialty premiums (1) |
$ | 159,770 | $ | 287,316 | $ | 222,049 | |||
| Total catastrophe premiums (2) |
$ | 994,621 | $ | 1,003,104 | $ | 1,099,114 | |||
8
Table of Contents
| (1) | Total specialty premiums written includes $nil, $0.4 million and $2.3 million of premiums assumed from our Individual Risk segment for the years ended December 31, 2008, 2007 and 2006, respectively. |
| (2) | Total catastrophe premiums written includes $5.7 million, $37.0 million and $64.6 million of premiums assumed from our Individual Risk segment for the years ended December 31, 2008, 2007 and 2006, respectively. |
Property Catastrophe Reinsurance
We believe we are one of the largest providers of property catastrophe reinsurance in the world, based on our total catastrophe premium. Our principal property catastrophe reinsurance products include catastrophe excess of loss reinsurance and excess of loss retrocessional reinsurance as described below:
Catastrophe Excess of Loss Reinsurance. We principally write catastrophe reinsurance on an excess of loss basis, which means we provide coverage to our insureds when aggregate claims and claim expenses from a single occurrence of a covered peril exceed the attachment point specified in a particular contract. Under these contracts we indemnify an insurer for a portion of the losses on insurance policies in excess of a specified loss amount, and up to an amount per loss specified in the contract. The coverage provided under excess of loss reinsurance contracts may be on a worldwide basis or limited in scope to selected geographic areas. Coverage can also vary from all property perils to limited coverage on selected perils, such as earthquake only coverage.
Excess of Loss Retrocessional Reinsurance. We also write retrocessional reinsurance contracts that provide property catastrophe coverage to other reinsurers or retrocedants. In providing retrocessional reinsurance, we focus on property catastrophe retrocessional reinsurance which covers the retrocedant on an excess of loss basis when aggregate claims and claim expenses from a single occurrence of a covered peril and from a multiple number of reinsureds exceed a specified attachment point. The coverage provided under excess of loss retrocessional contracts may be on a worldwide basis or limited in scope to selected geographic areas. Coverage can also vary from all property perils to limited coverage on selected perils, such as earthquake only coverage. The information available to retrocessional underwriters concerning the original primary risk can be less precise than the information received from primary companies directly. Moreover, exposures from retrocessional business can change within a contract term as the underwriters of a retrocedant alter their book of business after retrocessional coverage has been bound.
Our property catastrophe reinsurance contracts are generally all risk in nature. Our most significant exposure is to losses from earthquakes and hurricanes and other windstorms, although we are also exposed to claims arising from other catastrophes, such as tsunamis, freezes, floods, fires, tornadoes, explosions and acts of terrorism in connection with the coverages we provide. Our predominant exposure under such coverage is to property damage. However, other risks, including business interruption and other non-property losses, may also be covered under our property reinsurance contracts when arising from a covered peril. We offer our coverages on a worldwide basis.
Because of the wide range of possible catastrophic events to which we are exposed, including the size of such events and because of the potential for multiple events to occur in the same time period, our catastrophe reinsurance business is volatile and our results of operations reflect this volatility. Further, our financial condition may be impacted by this volatility over time or at any point in time. The effects of claims from one or a number of severe catastrophic events could have a material adverse effect on us. We expect that increases in the values and concentrations of insured property and the effects of inflation will increase the severity of such occurrences in the future.
Catastrophe-Linked Securities. We also invest in catastrophe-linked securities (cat-linked securities). Cat-linked securities are generally privately placed fixed income securities as to which all or a portion of the repayment of the principal is linked to catastrophic events; for example, the occurrence of one or more hurricanes or earthquakes producing industry losses exceeding certain specified thresholds. We underwrite, model, evaluate and monitor these securities using the same tools and techniques used to evaluate our more traditional property catastrophe reinsurance business assumed. In addition, we may enter into derivative transactions, such as total return swaps, that are based on or referenced to underlying cat-linked securities. Based on an evaluation of the specific features of each cat-linked security, we account for these
9
Table of Contents
securities as reinsurance or at fair value, as applicable, in accordance with U.S. generally accepted accounting principles (GAAP). In addition, in future periods we may utilize the growing market for cat-linked securities to expand our ceded reinsurance buying if we find the pricing and terms of such coverage attractive.
We seek to moderate the volatility of our risk portfolio through superior risk selection, diversification and the purchase of retrocessional coverages and other protections. In furtherance of our strategy, we may increase or decrease our presence in the catastrophe reinsurance business based on market conditions and our assessment of risk-adjusted pricing adequacy. We frequently seek to purchase reinsurance or other protection for our own account to further reduce the financial impact that a large catastrophe or a series of catastrophes could have on our results.
As a result of our position in the market and reputation for superior customer service, we believe we have superior access to business we view as desirable compared to the market as a whole. As described above, we use our proprietary underwriting tools and guidelines to attempt to construct an attractive portfolio from these opportunities. We dynamically model policy submissions against our current in-force underwriting portfolio, comparing our estimate of the modeled expected returns of the contract against the amount of capital that we allocate to the contract, based on our estimate of its marginal impact on our overall risk portfolio. At times, our approach to portfolio management has resulted and may result in the future in our having a relatively large market share of catastrophe reinsurance exposure in a particular geographic region, such as Florida, or to a particular peril, such as U.S. hurricane risk, where we believe supply and demand characteristics promote our providing significant capacity, or where the risks or class of risks otherwise adds efficiency to our portfolio. Conversely, from time to time we may have a disproportionately low market share in certain regions or perils where we believe our capital would be less effectively deployed.
Specialty Reinsurance
We write a number of lines of reinsurance other than property catastrophe, such as catastrophe exposed workers compensation, surety, terrorism, medical malpractice, catastrophe exposed personal lines property, casualty clash, certain other casualty lines and other specialty lines of reinsurance, which we collectively refer to as specialty reinsurance. As with our catastrophe business, our team of experienced professionals seek to underwrite these lines using a disciplined underwriting approach and sophisticated analytical tools.
We generally target lines of business where we believe we can adequately quantify the risks assumed and where potential losses could be characterized as low frequency and high severity, similar to our catastrophe reinsurance coverages. We also seek to identify market dislocations and write new lines of business whose risk and return characteristics are estimated to exceed our hurdle rates. We also seek to manage the correlations of this business with our overall portfolio, including our aggregate exposure to single and aggregated catastrophe events. We believe that our underwriting and analytical capabilities have positioned us well to manage this business.
We offer our specialty reinsurance products principally on an excess of loss basis, as described above with respect to our catastrophe reinsurance products, and also provide some proportional coverage. In a proportional reinsurance arrangement (also referred to as quota share reinsurance and pro-rata reinsurance), the reinsurer shares a proportional part of the original premiums and losses of the reinsured. The reinsurer pays the cedant a commission which is generally based on the cedants cost of acquiring the business being reinsured (including commissions, premium taxes, assessments and miscellaneous administrative expenses) and may also include a profit factor. Our products generally include tailored features such as limits or sub-limits which we believe help us manage our exposures. Any liability exceeding, or otherwise not subject to, such limits reverts to the cedant. As with our catastrophe reinsurance business, our specialty reinsurance frequently provides coverage for relatively large limits or exposures, and thus we are subject to potential significant claims volatility.
We generally seek to write significant lines on our specialty reinsurance treaties. As a result of our financial strength, we have the ability to offer significant capacity and, for select risks, we have made available significant limits. We believe these capabilities, the strength of our specialty reinsurance underwriting team, and our demonstrated ability and willingness to pay valid claims are competitive advantages of our specialty reinsurance business.
10
Table of Contents
Ventures
We pursue a number of other opportunities through our ventures unit, which has responsibility for managing our joint venture relationships, executing customized reinsurance transactions to assume or cede risk and managing certain investments directed at classes of risk other than catastrophe reinsurance.
Property Catastrophe Managed Joint Ventures. We actively manage property catastrophe-oriented joint ventures, which provide us with an additional presence in the market, enhance client relationships and generate fee income. These joint ventures allow us to leverage our access to business and our underwriting capabilities on a larger capital base. Currently, our joint ventures include Top Layer Re and DaVinci. RUM, a wholly owned subsidiary of the Company, acts as the exclusive underwriting manager for each of these joint ventures.
DaVinci was established in 2001 and principally writes property catastrophe reinsurance and certain low frequency, high severity specialty reinsurance lines of business on a global basis. In general, we seek to construct for DaVinci a property catastrophe reinsurance portfolio with risk characteristics similar to those of Renaissance Reinsurances property catastrophe reinsurance portfolio and certain lines of specialty reinsurance such as terrorism and catastrophe exposed workers compensation. In accordance with DaVincis underwriting guidelines, it can only participate in business that is underwritten by Renaissance Reinsurance. We maintain majority voting control of DaVinciRe and, accordingly, consolidate the results of DaVinciRe into our consolidated results of operations and financial position. We seek to manage DaVincis capital efficiently over time in light of the market opportunities and needs we perceive and believe we are able to serve. Our ownership in DaVinciRe was 22.8% and 20.5% at December 31, 2008 and 2007, respectively. On January 30, 2009, we purchased the shares of certain third party DaVinciRe shareholders for $145.5 million, less a $21.8 million reserve holdback. The purchase price was based on GAAP book value as of December 31, 2008. As a result of these purchases, our ownership interest in DaVinciRe increased to 37.6%. We expect our ownership in DaVinciRe to fluctuate over time.
Top Layer Re writes high excess non-U.S. property catastrophe reinsurance. Top Layer Re is owned 50% by State Farm Mutual Automobile Insurance Company (State Farm) and 50% by ROIHL, a wholly owned subsidiary of the Company. State Farm provides $3.9 billion of stop loss reinsurance coverage to Top Layer Re. We account for our equity ownership in Top Layer Re under the equity method of accounting and our proportionate share of its results are reflected in equity in (losses) earnings of other ventures in our consolidated statements of operations.
During 2007 and 2006, we participated in the formation of Starbound II and Starbound Re, respectively. These joint ventures provided capacity to the U.S. property catastrophe market, primarily for the 2007 and 2006 U.S. hurricane seasons, respectively. While these joint ventures were active we owned a minority interest share of the entities and accounted for them as investments in other ventures, under equity method. These joint ventures have subsequently terminated and have returned capital to the joint venture shareholders. Effective July 31, 2008 and August 31, 2007 we repurchased all of the issued and outstanding share capital of Starbound II and Starbound Re, respectively. We now account for these entities as consolidated subsidiaries.
In addition, in May 2006, the Company sold third-party capital in Tim Re, currently a wholly owned subsidiary, to provide additional capacity to accept property catastrophe excess of loss reinsurance business for the 2006 hurricane season, in return for a profit commission. In January 2007, the Company purchased all of the issued and outstanding equity securities of Tim Re. The Company accounts for Tim Re as a consolidated subsidiary.
Ventures works on a range of other customized reinsurance transactions. For example, we have participated, and continuously analyze other attractive opportunities to participate, in the market for cat-linked securities and derivatives. We also offer products through which we cede participations in the performance of our catastrophe reinsurance portfolio. We believe our products contain a number of customized features designed to fit the needs of our partners, as well as our risk management objectives.
11
Table of Contents
Strategic Investments. Ventures also pursues strategic investments where, rather than assuming exclusive management responsibilities ourselves, we instead partner with other market participants. These investments are directed at classes of risk other than catastrophe, and at times may also be directed at non-insurance risks. We find these investments attractive both for their expected returns, and also because they provide us diversification benefits and information and exposure to other aspects of the market.
An example of these investments includes our investment in Tower Hill Insurance Group, LLC (THIG), Tower Hill Claims Services, LLC (THCS) and Tower Hill Claims Management, LLC (THCM) (collectively, the Tower Hill Companies), which operate primarily in the State of Florida. THIG is a managing general agency specializing in insurance coverage for site built and manufactured homes. THCS and THCM provide claim adjustment services through exclusive agreements with THIG. During the third quarter of 2008, we invested $50.0 million in the Tower Hill Companies, representing a 25.0% ownership interest, to expand our core platforms by obtaining ownership in an additional distribution channel for the Florida homeowners market and to enhance our relationships with other stakeholders.
Weather-Related Activities. We undertake weather-related consulting and trading activities through our operating companies including Weather Predict, WP Consulting, AEF, RIM and RTL. Weather Predict, WP Consulting and AEF provide fee-based consulting services, sell weather-related information and forecasts, and engage in education, research and development, and loss mitigation activities, such as the RenaissanceRe Wall of Wind research facility located in southern Florida and the Stormstruck® interactive weather experience at the Walt Disney World® Resort in Florida. RTL sells certain financial products primarily to address weather risks, and engages in certain weather, energy and commodity derivatives trading activities. Principally through RTL, we expect that our participation will increase in the trading markets for securities and derivatives linked to energy, commodities, weather, other natural phenomena, and/or products or indices linked in part to such phenomena. As this unit grows, we are seeking to develop client and customer relationships, continuing to invest in operating and control environment systems and procedures, hire staff and develop and install management information and other systems. We are also taking numerous other steps to implement our strategies. Success in executing our strategies in respect of this unit requires us to develop new expertise in certain areas.
Business activities that appear in our consolidated underwriting results, such as DaVinci and certain reinsurance transactions, are included in our Reinsurance segment results; the results of our investments, such as Top Layer Re, ChannelRe Holdings Ltd. (ChannelRe), Starbound II, Platinum Underwriters Holdings Ltd. (Platinum), our weather-related activities and other ventures are included in the Other category of our segment results.
Competition
The markets in which we operate are highly competitive, and we believe that competition is increasing and becoming more robust. With respect to our Reinsurance operations, we believe that our principal competitors include other companies active in the Bermuda market including Ace Limited (Ace), Allied World Assurance Company Ltd. (Allied World), Arch Capital Group (Arch), Axis Capital Holdings (Axis), Endurance Specialty Holdings Ltd. (Endurance), Everest Re Group Ltd. (Everest Re), IPC Holdings, Ltd. (IPC), Montpelier Re Holdings Ltd. (Montpelier Re), PartnerRe Ltd. (Partner Re), Platinum, Transatlantic Holdings Inc. (Transatlantic), Validus Holdings, Ltd. (Validus), White Mountains Insurance Group Ltd. (White Mountains) and XL Capital Ltd. (XL) We also compete with certain Lloyds syndicates active in the London market, as well as with a number of other industry participants, such as American International Group, Inc. (AIG), Berkshire Hathaway (Berkshire), Hannover Re, Munich Re Group and Swiss Re. As our business evolves over time we expect our competitors to change as well.
While their participation in the reinsurance market may be decreasing somewhat due to the current issues facing the capital and credit markets, hedge funds, investment banks, exchanges and other capital market participants have also shown increasing interest over the past several years in entering the reinsurance market. For example, over the last several years there has been substantial growth in financial products such as exchange traded catastrophe options, cat-linked securities, catastrophe-linked derivative agreements and other financial products, intended to compete with traditional reinsurance. We believe that competition from non-traditional sources such as these will continue to increase in the future. Many of
12
Table of Contents
these new competitors have greater financial, marketing and management resources than we do. In addition, the tax policies of the countries where our clients operate, as well as government sponsored or backed catastrophe funds, affect demand for reinsurance. We are unable to predict the extent to which the foregoing new, proposed or potential initiatives may affect the demand for our products or the risks which may be available for us when providing coverage.
Individual Risk Segment
We define our Individual Risk segment to include underwriting that involves understanding the characteristics of the original underlying insurance policy. Our Individual Risk segment is managed by the Chief Executive Officer of the Glencoe Group. Our Individual Risk operations seek to identify and write classes of business which are attractively priced relative to the risk exposure and, particularly in the case of catastrophe-exposed risks, where our expertise in modeling, analytical tools and information systems may provide a competitive advantage.
The following table shows our Individual Risk gross premiums written by major type of business:
| 2008 | 2007 | 2006 | ||||||||||||||||
| Year ended December 31, |
Gross Premiums Written |
Percentage of Gross Premiums Written |
Gross Premiums Written |
Percentage of Gross Premiums Written |
Gross Premiums Written |
Percentage of Gross Premiums Written |
||||||||||||
| (in thousands, except percentages) | ||||||||||||||||||
| Individual Risk gross premiums written |
||||||||||||||||||
| Multi-peril crop |
$ | 272,559 | 46.4 | % | $ | 178,728 | 32.1 | % | $ | 129,908 | 18.9 | % | ||||||
| Commercial property |
134,601 | 23.0 | 164,438 | 29.5 | 226,205 | 32.8 | ||||||||||||
| Commercial multi-line |
119,987 | 20.4 | 162,422 | 29.2 | 229,079 | 33.2 | ||||||||||||
| Personal lines property |
60,162 | 10.2 | 51,006 | 9.2 | 104,200 | 15.1 | ||||||||||||
| Total Individual Risk gross premiums written |
$ | 587,309 | 100.0 | % | $ | 556,594 | 100.0 | % | $ | 689,392 | 100.0 | % | ||||||
Our Individual Risk business is written by the Glencoe Group through its principal operating subsidiaries:
| | Agro National a managing general underwriter of multi-peril crop insurance that participates in the U.S. Federal governments Multi-Peril Crop Insurance Program; |
| | Glencoe a Bermuda-domiciled excess and surplus lines insurance company that is currently eligible to do business on an excess and surplus lines basis in 51 U.S. jurisdictions; |
| | Lantana a Bermuda-domiciled insurance company currently eligible as an excess and surplus lines carrier in 49 U.S. jurisdictions; |
| | Stonington a Texas domiciled insurance company that is licensed on an admitted basis in all 50 states and the District of Columbia; and |
| | Stonington Lloyds Insurance Company (Stonington Lloyds) a Texas domiciled Lloyds plan insurer. |
Our principal contracts include insurance policies and quota share reinsurance with respect to risks including: 1) multi-peril crop, which includes multi-peril crop insurance, crop hail and other named peril agriculture risk management products; 2) commercial property, which principally includes catastrophe-exposed commercial property products; 3) commercial multi-line, which includes commercial property and liability coverage, such as general liability, automobile liability and physical damage, building and contents, professional liability and various specialty products; and 4) personal lines property, which principally includes homeowners personal lines property coverage and catastrophe exposed personal lines property coverage.
13
Table of Contents
Our Individual Risk business is produced primarily through four distribution channels:
| 1) | Wholly owned program manager We write specialty lines primary insurance through a wholly owned specialized program manager; |
| 2) | Third party program managers We write specialty lines primary insurance through third party specialized program managers, who produce business pursuant to agreed-upon underwriting guidelines and provide related back-office functions; |
| 3) | Quota share reinsurance We write quota share reinsurance with primary insurers who produce business pursuant to agreed-upon underwriting guidelines and provide most back-office functions; and |
| 4) | Broker-produced business We write primary insurance produced through brokers on a risk-by-risk basis. |
The following table shows the percentage of our Individual Risk gross premiums written by distribution channel:
| 2008 | 2007 | 2006 | ||||||||||||||||
| Year ended December 31, |
Gross Premiums Written |
Percentage of Gross Premiums Written |
Gross Premiums Written |
Percentage of Gross Premiums Written |
Gross Premiums Written |
Percentage of Gross Premiums Written |
||||||||||||
| (in thousands, except percentages) | ||||||||||||||||||
| Individual Risk gross premiums written |
||||||||||||||||||
| Program manager wholly owned (1) |
$ | 272,559 | 46.4 | % | $ | 178,728 | 32.1 | % | $ | 129,908 | 18.9 | % | ||||||
| Program managers third party |
216,880 | 36.9 | 235,849 | 42.4 | 305,299 | 44.3 | ||||||||||||
| Quota share reinsurance |
97,444 | 16.6 | 139,952 | 25.1 | 238,066 | 34.5 | ||||||||||||
| Broker-produced business |
426 | 0.1 | 2,065 | 0.4 | 16,119 | 2.3 | ||||||||||||
| Total Individual Risk gross premiums written |
$ | 587,309 | 100.0 | % | $ | 556,594 | 100.0 | % | $ | 689,392 | 100.0 | % | ||||||
| (1) | Program manager wholly owned represents Agro National which we acquired in an asset purchase on June 2, 2008. The table above is presented as if Agro National has been a wholly-owned subsidiary since the first period presented. |
We seek to identify and do business with third party program managers and quota share reinsurance cedants whom we believe utilize superior underwriting methodologies. We rely on these third parties for services including policy issuance, premium collection, claims processing, and compliance with various state laws and regulations including licensing. We seek to work closely with these partners, attempting to employ our analytical methodologies and, where appropriate, our expertise in catastrophe risk, to arrive at adequate pricing for the risks being underwritten. We seek to structure these relationships to provide value to both parties and meaningful protections to us. Historically, our strategy relating to program manager relationships has been to pursue a relatively small number of relatively large relationships. Currently, we are investing in initiatives to strengthen our operating platform, enhance our internal capabilities, and expand the resources we commit to our Individual Risk operations. In furtherance of these initiatives, in 2008 we completed the acquisition of substantially all the net assets of Agro National, LLC and Claims Management Services, Inc. (CMS).
We actively oversee our third party relationships through an operations review team at Glencoe Specialty Services and through the use of proprietary tools such as PACeR. Our operations review team includes professionals from diverse disciplines including actuarial science, accounting, claims management, law, regulatory compliance and underwriting. This group assists with the initial due diligence as well as the ongoing monitoring of these third parties. Our ongoing monitoring includes periodic audits of our third party program managers and third party administrators. In addition, for our large third party program managers
14
Table of Contents
we maintain an employee in an underwriting capacity on-site at the program manager to oversee the program managers compliance with our prescribed underwriting guidelines. We generally seek to have contractual performance standards for each of our programs and third party administrators whose compensation is subject to adjustment based on meeting these standards. The program operations team audits compliance with our underwriting guidelines and contractually agreed operating guidelines and performance standards. The program operations team also seeks to ensure corrective action is taken quickly to resolve issues identified during the audit process.
Competition
In our Individual Risk business, we face competition from independent insurance companies, subsidiaries or affiliates of major worldwide companies and others, some of which have greater financial and other resources than we do. Primary insurers compete on the basis of various factors including distribution channels, product, price, service, financial strength and reputation. Many of our Reinsurance segment competitors listed above also compete for the program business and quota share reinsurance we write within our Individual Risk segment. We believe that our principal competitors in the program business of our Individual Risk segment include operating subsidiaries of AIG, Arch, WR Berkley Corp. (Berkley), Berkshire, Endurance, Hannover Re and Zurich Financial Services Group (Zurich). In our Individual Risk business, we compete not only in respect of the insurance and reinsurance products we offer, but in respect of the contractual relationships with the third party program managers with whom we seek to partner. Increased competition in respect of our products could result in decreased premium rates, less attractive terms and conditions, and a decrease in our share of attractive programs. Increased competition in respect of our program manager partners, as to whom we are extremely selective and whose relationship we seek to tightly manage in a disciplined, consistent fashion, could result in less favorable terms and conditions in respect of our contractual arrangements with our partners, the loss of existing program manager relationships, or constrain our ability to add new relationships to our operations. In addition, there has been a growing trend of insurance and reinsurance companies acquiring third party program managers. Acquisitions of third party program managers with whom we do business by other insurance or reinsurance companies could result in us losing that program manager relationship. Any of the foregoing could adversely impact the growth and profitability of our Individual Risk segment.
RATINGS
Financial strength ratings are an important factor in respect of the competitive position of reinsurance and insurance companies. Rating organizations continually review the financial positions of our reinsurers and insurers. Over the last five years, we have received high claims-paying and financial strength ratings from A.M. Best Co. (A.M. Best), Standard & Poors Rating Agency (S&P), Moodys and Fitch. These ratings represent independent opinions of an insurers financial strength, operating performance and ability to meet policyholder obligations, and are not an evaluation directed toward the protection of investors or a recommendation to buy, sell or hold any of our securities.
15
Table of Contents
Presented below are the ratings of our principal operating subsidiaries and joint ventures by segment and the senior debt ratings of RenaissanceRe as of February 11, 2009. See Managements Discussion and Analysis of Financial Condition and Results of Operations Capital Resources Credit Ratings for information about recent ratings actions.
| At February 11, 2009 |
A.M. Best | A.M. Best Financial Size Category |
S&P | Moodys | Fitch | |||||
| REINSURANCE SEGMENT (1) |
||||||||||
| Renaissance Reinsurance |
A+ | XIV | AA- | A2 | A | |||||
| DaVinci |
A | XII | A+ | | | |||||
| Top Layer Re |
A+ | VII | AA | | | |||||
| Renaissance Europe |
A+ | XIV | AA- | | | |||||
| INDIVIDUAL RISK SEGMENT (1) |
||||||||||
| Glencoe |
A | XI | | | | |||||
| Stonington |
A | XI | | | | |||||
| Stonington Lloyds |
A | XI | | | | |||||
| Lantana |
A | XI | | | | |||||
| RENAISSANCERE (2) |
a- | | A | Baa1 | BBB+ | |||||
| (1) | The A.M. Best, S&P, Moodys and Fitch ratings for the companies in the Reinsurance and Individual Risk segments reflect the insurers financial strength rating (see explanation of the rating levels below). |
| (2) | The A.M. Best, S&P, Moodys and Fitch ratings for RenaissanceRe represent the credit ratings on its senior unsecured debt. |
A.M. Best. A+ is the second highest designation of A.M. Bests sixteen rating levels. A+ rated insurance companies are defined as Superior companies and are considered by A.M. Best to have a very strong ability to meet their obligations to policyholders. A is the third highest designation assigned by A.M. Best, representing A.M. Bests opinion that the insurer has an excellent ability to meet its ongoing obligations to policyholders.
A.M. Best also assigns a financial size category to each of the insurance companies rated. VII represents a company with $50.0 $100.0 million in capital, XI represents a company with $750.0 million $1.0 billion in capital, XII represents a company with $1.0 $1.25 billion in capital and XIV represents a company with $1.5 $2.0 billion in capital. The outlooks for all companies rated by A.M. Best are stable.
In addition, A.M. Best assigns an issuer credit rating (ICR) to an entity which is an opinion on the ability of an entity to meet its senior obligations. RenaissanceRe has been assigned a- which is defined as Excellent by A.M. Best and the outlook is considered stable.
S&P. The AA range (AA+, AA, AA-), which has been assigned by S&P to Renaissance Reinsurance, Renaissance Europe and Top Layer Re, is the second highest rating assigned by S&P, and indicates that S&P believes the insurers have very strong financial security characteristics, differing only slightly from those rated higher. DaVinci has been assigned a rating of A+ by S&P, indicating the insurer has strong financial security characteristics but is somewhat more likely to be affected by adverse business conditions than are insurers with higher ratings.
S&P also assigns an issuer credit rating to an entity which is an opinion on the credit worthiness of obligor with respect to a specific financial obligation. RenaissanceRe has been assigned an ICR of A, which is the third highest rating assigned by S&P.
Moodys. Moodys Insurance Financial Strength Ratings and Moodys Credit Ratings represent its opinions of the ability of insurance companies to pay punctually policyholder claims and obligations and senior unsecured debt instruments. Moodys believes that insurance companies rated A2, such as Renaissance Reinsurance, and companies rated Baa1, such as RenaissanceRe, offer good financial security. However, Moodys believes that elements may be present which suggest a susceptibility to impairment sometime in the future.
16
Table of Contents
Fitch. Fitch Ratings Ltd. Issuer Financial Strength ratings provide an assessment of the financial strength of an insurance organization. Fitch believes that insurance companies rated A, such as Renaissance Reinsurance, have Strong capacity to meet policyholders and contract obligations on a timely basis with a low expectation of ceased or interrupted payments. Fitch also provides Long-Term Credit Ratings, used as a benchmark measure of probability of default; these were formerly described as Issuer Default Ratings. RenaissanceRe has been rated BBB+, meaning there are currently expectations of low credit risk.
While the ratings of our principal operating subsidiaries and joint ventures within our Reinsurance segment remain among the highest in our business, adverse ratings actions could have a negative effect on our ability to fully realize current or future market opportunities. In addition, it is common for our reinsurance contracts to contain provisions permitting our clients to cancel coverage pro-rata if our relevant operating subsidiary is downgraded below a certain rating level. Whether a client would exercise this right would depend, among other factors, on the reason for such a downgrade, the extent of the downgrade, the prevailing market conditions and the pricing and availability of replacement reinsurance coverage. Therefore, in the event of a downgrade, it is not possible to predict in advance the extent to which this cancellation right would be exercised, if at all, or what effect such cancellations would have on the financial condition or future operations, but such effect potentially could be material. To date we are not aware that we have experienced such a cancellation. Our ratings are subject to periodic review and may be revised or revoked by the agencies which issue them.
UNDERWRITING AND ENTERPRISE RISK MANAGEMENT
Underwriting
Our primary underwriting goal is to construct a portfolio of reinsurance and insurance contracts and other financial risks that maximizes our return on shareholders equity, subject to prudent risk constraints, and to generate long-term growth in tangible book value per common share plus accumulated dividends. We assess each new (re)insurance contract on the basis of the expected incremental return relative to the incremental contribution to portfolio risk.
Reinsurance
We have developed a proprietary, computer-based pricing and exposure management system, REMS©. Since inception, we have continued to invest in and improve REMS©, incorporating our underwriting experience, additional proprietary software and a significant amount of new industry data. REMS© has analytic and modeling capabilities that help us to assess the risk and return of each incremental reinsurance contract in relation to our overall portfolio of reinsurance contracts. We combine the analyses generated by REMS© with other information available to us, including our own knowledge of the client submitting the proposed program, to assess the premium offered against the risk of loss which the program presents. We have licensed and integrated into REMS© a number of third party catastrophe computer models in addition to our base model, which we use to validate and stress test our base REMS© results. REMS© is most developed in analyzing catastrophe risks. We believe that our tools for assessing non-catastrophe risks are much less sophisticated and much less well developed than those for catastrophe risks. We continuously strive to improve our analytical techniques relating to non-catastrophe risks.
We believe that REMS© is a more robust underwriting and risk management system than is currently commercially available elsewhere in the reinsurance industry. Before we bind a reinsurance risk, exposure data is typically gathered from clients and this exposure data is input into the REMS© modeling system. We believe that the REMS© modeling system helps us to analyze each policy on a consistent basis, assisting our determination of what we believe to be an appropriate price to charge for each policy based upon the risk that is assumed. REMS© combines computer-generated statistical simulations that estimate event probabilities with exposure and coverage information on each clients reinsurance contract to produce expected claims for reinsurance programs submitted to us. Our models employ simulation techniques to generate 40,000 years of loss activity, including events causing in excess of $600 billion in insured losses. From this simulation, we generate a probability distribution of potential outcomes for each policy in our portfolio and for our total portfolio. In part through the utilization of REMS© we seek to compare our estimate of the expected returns in respect of a contract with the amount of capital that we notionally
17
Table of Contents
allocate to the contract based on our estimate of its marginal impact on our portfolio of risks. We have also customized REMS© by including additional perils, risks and geographic areas that may not be captured in the commercially available models.
We periodically review the estimates and assumptions that are reflected in REMS© and our other tools. For example, in the second half of 2005 we revised our assumptions relating to Atlantic basin hurricane frequency and severity. While many commercial catastrophe models base their frequency and severity distributions on the last 100 years of hurricane activity, assuming that this time frame is an appropriate framework on which to base estimates of the hurricane risk to which the insurance industry is exposed, we currently do not believe, based on our review of the scientific literature, private research, and discussions with climatologists, meteorologists and other weather scientists, including those at Weather Predict, that the past 100 years of data is reflective of current climatological risks. In particular, we believe there has been an increase in the frequency and severity of hurricanes that have the potential to make landfall in the U.S., potentially as a result of decadal ocean water temperature cyclical trends, a longer-term trend towards global warming, or both or other factors. We started using these revised assumptions in REMS© to model and evaluate our portfolio of risk in the latter part of 2005. The process of updating all of the underlying risk models is continuous, and many of the assumptions involve significant judgment on our part, and further experience or scientific research may lead us to further adjust these assumptions. Changes in our modeled assumptions may impact from time to time the amount of capacity we are prepared to offer.
Our catastrophe reinsurance underwriters use REMS© in their pricing decisions, which we believe provides them with several competitive advantages. These include the ability:
| | to simulate a greater number of years of catastrophic event activity compared to a much smaller sample in generally available models, allowing us to analyze exposure to a greater number and combination of potential events; |
| | to analyze the incremental impact of an individual reinsurance contract on our overall portfolio; |
| | to better assess the underlying exposures associated with assumed retrocessional business; |
| | to price contracts within a short time frame; |
| | to capture various classes of risk, including catastrophe and other insurance risks; |
| | to assess risk across multiple entities (including our various joint ventures) and across different components of our capital structure; and |
| | to provide consistent pricing information. |
As part of our risk management process, we also use REMS© to assist us with the purchase of reinsurance coverage for our own account.
We have developed underwriting guidelines, to be used in conjunction with REMS©, that seek to limit the exposure to claims from any single catastrophic event and the exposure to losses from a series of catastrophic events. As part of our pricing and underwriting process, we also assess a variety of other factors, including:
| | the reputation of the proposed cedant and the likelihood of establishing a long-term relationship with the cedant; |
| | the geographic area in which the cedant does business and its market share; |
| | historical loss data for the cedant and, where available, for the industry as a whole in the relevant regions, in order to compare the cedants historical catastrophe loss experience to industry averages; |
| | the cedants pricing strategies; and |
| | the perceived financial strength of the cedant. |
18
Table of Contents
In order to estimate the risk profile of each line of specialty reinsurance, we establish probability distributions and assess the correlations with the rest of our portfolio. In lines with catastrophe risk, such as excess workers compensation and terrorism, we are leveraging directly off our skill in modeling for our property catastrophe reinsurance risks, and seek to appropriately estimate and manage the correlations between these specialty lines and our catastrophe reinsurance portfolio. For other classes of business, in which we believe we have little or no natural catastrophe exposure, and hence estimate we will have significantly less correlation with our property catastrophe reinsurance coverages, we derive probability distributions from a variety of underlying information sources, including recent historical experience, but with the application of judgment as appropriate. The nature of some of these businesses lends itself less to the analysis that we use for our property catastrophe reinsurance coverages, reflecting both the nature of available exposure information, and the impact of human factors such as tort exposure. We produce probability distributions to represent our estimates of the related underlying risks which our products cover, which we believe helps us to make consistent underwriting decisions and to manage our total risk portfolio. Overall, we undertake to construct conservative representations of the risks within our models, although there can be no assurance that this has occurred or will occur in the future.
Individual Risk
For our catastrophe-exposed business in our Individual Risk segment, we utilize proprietary modeling tools that have been developed in conjunction with the modeling and other resources utilized in our Reinsurance operations, as described above. We also combine these analyses with those of our Reinsurance segment to monitor our aggregate group catastrophic exposures. In general, we believe our techniques for evaluating catastrophe risk are better developed than those for other classes of risk.
For the business produced through third party program managers, we seek to carefully identify and evaluate potential third party program managers. When evaluating a potential new program manager, we consider numerous factors including: (i) whether the program manager can provide and help us analyze historic loss and other business data; (ii) whether the program manager will agree to accept a portion of their compensation based on the underwriting performance of their program and provide us with the other terms and conditions we require; (iii) our assessment of the integrity and experience of the program managers management team; (iv) the potential profitability of the program to us; and (v) the availability of our internal resources to appropriately conduct due diligence, negotiate and execute transaction terms, and provide the ongoing monitoring we require. In considering pricing for the products to be offered by the program manager, we evaluate the expected frequency and severity of losses, the costs of providing the necessary coverage (including the cost of administering policy benefits, sales and other administrative and overhead costs), the necessity of third party reinsurance, the estimated costs thereof and an anticipated margin for profit.
In addition to utilizing REMS©, within our Individual Risk operations we have developed a proprietary information management and analytical database, PACeR, within which our data related to substantially all our business is maintained. With the use and development of PACeR, we are seeking to develop statistical and analytical techniques to evaluate the U.S. program lines of business we write within this segment and which over time we hope will create a competitive advantage. We believe that PACeR helps our clients better understand their business, thus creating value for them and us. For example, we believe that PACeR enables us to better identify and estimate the expected loss experience of particular products and PACeR is employed in the design of our products and the establishment of rates. We also seek to monitor pricing adequacy on our products by region, risk and producer. Subject to regulatory considerations, we seek to make timely premium and coverage modifications where we determine them to be appropriate.
We provide our third party program managers with written underwriting guidelines and monitor their compliance with our guidelines on a regular basis. Also, our contracts generally provide that a portion of the commission payable to our third party program managers will be on a retrospective basis, which is intended to permit us to adjust commissions based on our profitability and claims experience once an underwriting year is reasonably mature. We rely on our third party program managers to perform underwriting pursuant to these contractual guidelines, and believe we benefit from their superior local information and expertise in niche areas.
19
Table of Contents
Enterprise Risk Management
We have sought to develop and utilize a series of tools and processes that support a robust system of enterprise risk management (ERM) within our organization. We consider ERM to be a key process, overseen by our senior management team under the supervision of our Board of Directors, and implemented by personnel from across our organization. We believe that ERM helps us to identify potential events that may affect us, to quantify, evaluate and manage the risks to which we are exposed, and to provide reasonable assurance regarding the achievement of our objectives. We believe that effective ERM can provide us with a significant competitive advantage. We also believe that effective ERM assists our efforts to minimize the likelihood of suffering financial outcomes in excess of the ranges which we have estimated in respect of specific investments, underwriting decisions, or other operating or business activities. We believe that our risk management tools support our strategy of pursuing opportunities created by dislocated markets and help us to identify opportunities that we believe to be the most attractive. Our risk management tools allow us to monitor our capital position, on a consolidated basis and for each of our major operating subsidiaries, and these tools help us determine the appropriate amount of capital to support the risks that we have assumed in the aggregate and for each of our major operating subsidiaries. We believe that our risk management efforts are essential to our corporate strategy and our goal of achieving long-term growth in tangible book value per share plus accumulated dividends for our shareholders.
Our ERM framework comprises four key activities, as set forth below:
Underwriting and Other Quantifiable Risks. We believe that our operations are subject to a number of key risks, including underwriting risk, credit risk and interest rate risk as they relate to investments, ceded reinsurance credit risk and strategic investment risk, each of which can be analyzed in substantial part through quantitative tools and techniques. Of these, we believe underwriting risk to be the most material to us. In order to understand, monitor, quantify and proactively assess underwriting risk, we seek to develop and deploy appropriate tools to, among other things, estimate the comparable expected returns on potential business opportunities, and estimate the impact that such incremental business could have on our overall risk profile. We use the tools and methods described above in Underwriting to seek to achieve these objectives.
Aggregate Risk Profile. In part through the utilization of REMS© and our other systems and procedures, we seek to analyze our in-force aggregate underwriting portfolio on a daily basis. We believe this capability, not only helps us to manage our aggregate exposures, but assists our efforts to rigorously analyze individual proposed transactions and evaluate them in the context of our in-force portfolio. This aggregation process captures line of business, segment and corporate risk profiles, calculates internal and external capital tests and explicitly models ceded reinsurance. Generally, additional data is added quarterly to our aggregate risk framework to reflect updated or new information or estimates relating to matters such as interest rate risk, credit risk, capital adequacy and liquidity. This information is used in day-to-day decision making for underwriting, investments and operations and is also reviewed quarterly from both a unit level and in respect of our consolidated financial position.
Operational Risk. We believe we are subject to a number of additional risks arising out of operational, regulatory, and other matters, which we also seek to actively monitor and manage. This effort is coordinated by senior personnel including our Chief Financial Officer (CFO), General Counsel and Chief Compliance Officer (CCO), Corporate Controller and Chief Accounting Officer (CAO), Chief Administrative Officer, Chief Risk Officer (CRO) and Internal Audit, utilizing resources within the Company.
In an effort to identify and reduce operational and regulatory risk, we have significantly enhanced our control environment and have added additional finance, legal and back-office resources, to keep pace with the rate of growth experienced by the Company and will continue to do so in the future as appropriate. For example:
| | we have developed and expanded the compliance and internal audit functions; |
| | the accounting function has been strengthened by the addition of a significant number of professionals; |
20
Table of Contents
| | accounting, legal and/or compliance resources have been placed in our business units to monitor, identify and resolve potential accounting, legal and compliance needs at the operational level; and |
| | we have documented accounting guidelines for the review of all non-standard reinsurance contracts and other structured and/or complex financial transactions. |
Although financial reporting is a key area of our focus, other operational risks are addressed through our disaster recovery program, human resource practices such as motivating and retaining top talent, and our strict compliance, legal and tax protocols.
Controls and Compliance Committee. As part of monitoring our risks, we have instituted a Controls and Compliance Committee. The Controls and Compliance Committee is comprised of our CFO, CCO, CAO, Chief Administrative Officer, CRO, staff compliance function and representatives from our business units. The Controls and Compliance Committee meets periodically to review and address corporate compliance policies and is charged with monitoring, implementing and educating the Company on control and compliance topics and initiatives. In addition, the Controls and Compliance Committee is charged with reviewing certain transactions that potentially contain complex and/or significant underwriting, tax, legal, accounting, regulatory, reputational or compliance issues.
Ongoing Development and Enhancement. We frequently seek to increase the number of risks we monitor in part through quantitative risk distributions, even where we believe that such quantitative analysis is not as robust or well developed as our tools and models for measuring and evaluating other risks, such as catastrophe and market risks. We also seek to improve the methods by which we measure risks. We believe effective risk management is a continual process that requires ongoing improvement and development. We seek from time to time to identify new best practices or additional developments both from within our industry and from other sectors. We believe that our ongoing efforts to embed ERM throughout our organization are important to our efforts to produce and maintain a competitive advantage to achieve our corporate goals.
Our ERM is currently rated excellent by S&P which is S&Ps highest ERM rating.
GEOGRAPHIC BREAKDOWN
Our exposures are generally diversified across geographic zones, but are also a function of market conditions and opportunities. The Companys largest exposure has historically been to the U.S. and Caribbean property catastrophe market, which represented 42.9% of the Companys gross premiums written for the year ended December 31, 2008. A significant amount of our U.S. and Caribbean premium provides coverage against windstorms, mainly U.S. Atlantic hurricanes, as well as earthquakes and other natural and man-made catastrophes. The following table sets forth the percentage of our gross premiums written allocated to the territory of coverage exposure:
| Year ended December 31, |
2008 | 2007 | 2006 | |||||||||||||||
| Gross Premiums Written |
Percentage of Gross Premiums Written |
Gross Premiums Written |
Percentage of Gross Premiums Written |
Gross Premiums Written |
Percentage of Gross Premiums Written |
|||||||||||||
| (in thousands, except percentages) | ||||||||||||||||||
| Property catastrophe reinsurance |
||||||||||||||||||
| United States and Caribbean |
$ | 745,016 | 42.9 | % | $ | 735,322 | 40.6 | % | $ | 792,311 | 40.8 | % | ||||||
| Worldwide (excluding U.S) (1) |
75,489 | 4.3 | 66,392 | 3.7 | 71,116 | 3.7 | ||||||||||||
| Europe |
72,153 | 4.2 | 111,702 | 6.2 | 73,500 | 3.8 | ||||||||||||
| Worldwide |
67,371 | 3.9 | 27,577 | 1.5 | 68,575 | 3.5 | ||||||||||||
| Australia and New Zealand |
5,455 | 0.3 | 4,360 | 0.2 | 2,732 | 0.1 | ||||||||||||
| Other |
23,465 | 1.4 | 20,374 | 1.1 | 23,972 | 1.2 | ||||||||||||
| Specialty reinsurance (2) |
159,770 | 9.2 | 287,316 | 15.9 | 222,049 | 11.4 | ||||||||||||
| Total reinsurance (3) |
1,148,719 | 66.2 | 1,253,043 | 69.2 | 1,254,255 | 64.5 | ||||||||||||
| Individual Risk (4) |
587,309 | 33.8 | 556,594 | 30.8 | 689,392 | 35.5 | ||||||||||||
| Total gross premiums written |
$ | 1,736,028 | 100.0 | % | $ | 1,809,637 | 100.0 | % | $ | 1,943,647 | 100.0 | % | ||||||
21
Table of Contents
| (1) | The category Worldwide (excluding U.S.) consists of contracts that cover more than one geographic region (other than the U.S.). The exposure in this category for gross premiums written to date is predominantly from Europe and Japan. |
| (2) | The category Specialty reinsurance consists of contracts that are predominantly exposed to U.S. and worldwide risks. |
| (3) | Excludes $5.7 million, $37.4 million and $66.9 million of premium assumed from our Individual Risk segment in 2008, 2007 and 2006, respectively. |
| (4) | The category Individual Risk consists of contracts that are primarily exposed to U.S. risks. |
RESERVES FOR CLAIMS AND CLAIM EXPENSES
Claims and claim expense reserves represent estimates, including actuarial and statistical projections at a given point in time, of the ultimate settlement and administration costs for unpaid claims and claim expenses arising from the insurance and reinsurance contracts we sell. We establish our claims and claim expense reserves by taking claims reported to us by insureds and ceding companies, but which have not yet been paid (case reserves), adding the costs for additional case reserves (additional case reserves) which represent our estimates for claims previously reported to us which we believe may not be adequately reserved as of that date, and adding estimates for the anticipated cost of claims incurred but not yet reported to us (IBNR).
The following table summarizes our claims and claim expense reserves by line of business and split between case reserves, additional case reserves and IBNR at December 31, 2008 and 2007:
| At December 31, 2008 |
Case Reserves |
Additional Case Reserves |
IBNR | Total | ||||||||
| (in thousands) | ||||||||||||
| Property catastrophe reinsurance |
$ | 312,944 | $ | 297,279 | $ | 250,946 | $ | 861,169 | ||||
| Specialty reinsurance |
113,953 | 135,345 | 387,352 | 636,650 | ||||||||
| Total Reinsurance |
426,897 | 432,624 | 638,298 | 1,497,819 | ||||||||
| Individual Risk |
253,327 | 14,591 | 394,875 | 662,793 | ||||||||
| Total |
$ | 680,224 | $ | 447,215 | $ | 1,033,173 | $ | 2,160,612 | ||||
| At December 31, 2007 |
||||||||||||
| (in thousands) | ||||||||||||
| Property catastrophe reinsurance |
$ | 275,436 | $ | 287,201 | $ | 204,487 | $ | 767,124 | ||||
| Specialty reinsurance |
109,567 | 93,280 | 448,756 | 651,603 | ||||||||
| Total Reinsurance |
385,003 | 380,481 | 653,243 | 1,418,727 | ||||||||
| Individual Risk |
237,747 | 10,359 | 361,663 | 609,769 | ||||||||
| Total |
$ | 622,750 | $ | 390,840 | $ | 1,014,906 | $ | 2,028,496 | ||||
The increase in the total amount of claims and claim expense reserves from December 31, 2007 to December 31, 2008, as shown in the table above, was principally a result of net claims and claim expenses incurred relating to current and prior years of $760.5 million, including hurricanes Gustav and Ike which made landfall during the third quarter of 2008, and partially offset by the net payment of claims in respect of current year losses of $346.8 million, relating primarily to hurricanes Gustav and Ike and our multi-peril crop insurance line of business, and the payment of prior year losses of $397.8 million, in particular the prior year losses resulting from the large hurricanes of 2005, European windstorm Kyrill (Kyrill), the United Kingdom (U.K.) flood losses and our specialty unit and Individual Risk segment losses. Our estimates of claims and claim expense reserves are not precise in that, among other matters, they are based on predictions of future developments and estimates of future trends and other variable factors. Some, but not all, of our reserves are further subject to the uncertainty inherent in actuarial methodologies and estimates. Because a reserve estimate is simply an insurers estimate at a point in time of its ultimate liability, and because there are numerous factors which affect reserves and claims payments but cannot be determined with certainty in advance, our ultimate payments will vary, perhaps materially, from our
22
Table of Contents
estimates of reserves. If we determine in a subsequent period that adjustments to our previously established reserves are appropriate, such adjustments are recorded in the period in which they are identified. During the twelve months ended December 31, 2008, changes to prior year estimated claims reserves increased our net income or reduced our net loss by $234.8 million (2007 $233.2 million, 2006 $136.6 million), excluding the consideration of changes in reinstatement premium, profit commissions, minority interest and income tax expense.
Our reserving methodology for each line of business uses a loss reserving process that calculates a point estimate for the Companys ultimate settlement and administration costs for claims and claim expenses. We do not calculate a range of estimates. We use this point estimate, along with paid claims and case reserves, to record our best estimate of additional case reserves and IBNR in our financial statements. Under GAAP, we are not permitted to establish estimates for catastrophe claims and claim expense reserves until an event occurs that gives rise to a loss.
Reserving for our reinsurance claims involves other uncertainties, such as the dependence on information from ceding companies, which among other matters, includes the time lag inherent in reporting information from the primary insurer to us or to our ceding companies and differing reserving practices among ceding companies. The information received from ceding companies is typically in the form of bordereaux, broker notifications of loss and/or discussions with ceding companies or their brokers. This information can be received on a monthly, quarterly or transactional basis and normally includes estimates of paid claims and case reserves. We sometimes also receive an estimate or provision for IBNR. This information is often updated and adjusted from time-to-time during the loss settlement period as new data or facts in respect of initial claims, client accounts, industry or event trends may be reported or emerge in addition to changes in applicable statutory and case laws.
Included in our results for 2008 are $468.0 million of net claims and claim expenses incurred as a result of losses arising from hurricanes Gustav and Ike which struck the United States in the third quarter of 2008. Our estimates of losses from hurricanes Gustav and Ike, as well as other 2008 catastrophe events, are based on factors including currently available information derived from the Companys preliminary claims information from certain clients and brokers, industry assessments of losses from the events, proprietary models, and the terms and conditions of our contracts. Given the magnitude and recent occurrence of these events, meaningful uncertainty remains regarding total covered losses for the insurance industry and, accordingly, several of the key assumptions underlying our loss estimates. In addition, actual losses from these events may increase if our reinsurers or other obligors fail to meet their obligations. Our actual losses from these events will likely vary, perhaps materially, from these current estimates due to the inherent uncertainties in reserving for such losses, including the preliminary nature of the available information, the potential inaccuracies and inadequacies in the data provided by clients and brokers, the inherent uncertainty of modeling techniques and the application of such techniques, the effects of any demand surge on claims activity and complex coverage and other legal issues.
Included in our results for 2007 are $157.5 million of net claims and claim expenses from Kyrill and the U.K. flood losses which occurred in 2007, as well as $60.0 million in estimated net losses associated with exposure to sub-prime related casualty losses. Estimates of these losses are based on a review of potentially exposed contracts, information reported by and discussions with counterparties, and the Companys estimate of losses related to those contracts and are subject to change as more information is reported and becomes available. Such information is frequently reported more slowly, and with less initial accuracy, with respect to non-U.S. events such as Kyrill and the U.K. floods than with large U.S. catastrophe losses. In addition, the sub-prime related casualty net claims and claim expenses are based on underlying liability contracts which are considered long-tail business, and will therefore take many years before the actual losses are known and reported, which increases the uncertainty with respect to the estimate for ultimate losses for this event. The net claims and claim expenses from Kyrill, the U.K. floods and sub-prime related casualty losses are all attributable to the Companys Reinsurance segment.
During 2005, we incurred significant losses from hurricanes Katrina, Rita and Wilma. Our estimates of these losses are based on factors including currently available information derived from claims information from our clients and brokers, industry assessments of losses from the events, proprietary models and the terms and conditions of our contracts. In particular, due to the size and unusual complexity of certain legal and
23
Table of Contents
claims issues, particularly but not exclusively relating to hurricane Katrina, meaningful uncertainty remains regarding total covered losses for the insurance industry and, accordingly, our loss estimates. Our actual losses from these events will likely vary, perhaps materially, from our current estimates due to the inherent uncertainties in reserving for such losses, the potential inaccuracies and inadequacies in the data provided by clients and brokers, the inherent uncertainty of modeling techniques and the application of such techniques, and complex coverage and other legal issues.
Because of the inherent uncertainties discussed above, we have developed a reserving philosophy which attempts to incorporate prudent assumptions and estimates, and we have generally experienced favorable development on prior year reserves in the last several years. However, there is no assurance that this will occur in future periods.
Our reserving techniques, assumptions and processes differ between our Reinsurance and Individual Risk segments, as well as between our property catastrophe reinsurance and specialty reinsurance businesses within our Reinsurance segment. Refer to our Claims and Claim Expense Reserves Critical Accounting Estimates discussion in Item 7. Managements Discussion and Analysis of Financial Condition and Results of Operations for more information on the risks we insure and reinsure, the reserving techniques, assumptions and processes we follow to estimate our claims and claim expense reserves, and our current estimates versus our initial estimates of our claims reserves, for each of these units.
The following table represents the development of our GAAP balance sheet reserves for December 31, 1998 through December 31, 2008. This table does not present accident or policy year development data. The top line of the table shows the gross reserves for claims and claim expenses at the balance sheet date for each of the indicated years. This represents the estimated amounts of claims and claim expenses arising in the current year and all prior years that are unpaid at the balance sheet date, including additional case reserves and IBNR reserves. The table also shows the re-estimated amount of the previously recorded reserves based on experience as of the end of each succeeding year. The estimate changes as more information becomes known about the frequency and severity of claims for individual years. The cumulative redundancy (deficiency) on net reserves represents the aggregate change to date from the indicated estimate of the gross reserve for claims and claim expenses, net of losses recoverable on the second line of the table. The table also shows the cumulative net paid amounts as of successive years with respect to the net reserve liability. At the bottom of the table is a reconciliation of the gross reserve for claims and claim expenses to the net reserve for claims and claim expenses, the gross re-estimated liability to the net re-estimated liability for claims and claim expenses, and the cumulative redundancy (deficiency) on gross reserves.
24
Table of Contents
With respect to the information in the table below, it should be noted that each amount includes the effects of all changes in amounts for prior periods, including the effect of foreign exchange rates.
| Year ended December 31, |
1998 | 1999 | 2000 | 2001 | 2002 | 2003 | 2004 | 2005 | 2006 | 2007 | 2008 | ||||||||||||||||||||||||
| (in millions) | |||||||||||||||||||||||||||||||||||
| Gross reserve for claims and claim expenses |
$ | 298.8 | $ | 478.6 | $ | 403.6 | $ | 572.9 | $ | 804.8 | $ | 977.9 | $ | 1,459.4 | $ | 2,614.6 | $ | 2,098.2 | $ | 2,028.5 | $ | 2,160.6 | |||||||||||||
| Reserve for claims and claim expenses, net of losses recoverable |
$ | 197.5 | $ | 174.9 | $ | 237.0 | $ | 355.3 | $ | 605.3 | $ | 828.7 | $ | 1,241.6 | $ | 1,941.4 | $ | 1,796.3 | $ | 1,845.2 | $ | 1,861.1 | |||||||||||||
| 1 Year Later |
149.5 | 196.8 | 221.0 | 378.3 | 511.6 | 688.4 | 1,000.2 | 1,804.8 | 1,563.2 | 1,610.4 | | ||||||||||||||||||||||||
| 2 Years Later |
149.9 | 168.4 | 168.4 | 344.7 | 470.5 | 403.5 | 963.6 | 1,633.5 | 1,403.5 | | | ||||||||||||||||||||||||
| 3 Years Later |
141.3 | 121.7 | 138.6 | 308.0 | 294.4 | 384.6 | 869.8 | 1,493.0 | | | | ||||||||||||||||||||||||
| 4 Years Later |
118.6 | 111.1 | 107.7 | 214.1 | 282.1 | 357.5 | 819.1 | | | | | ||||||||||||||||||||||||
| 5 Years Later |
117.8 | 81.9 | 54.4 | 209.2 | 269.7 | 332.6 | | | | | | ||||||||||||||||||||||||
| 6 Years Later |
111.4 | 38.7 | 52.3 | 199.3 | 243.8 | | | | | | | ||||||||||||||||||||||||
| 7 Years Later |
99.0 | 36.8 | 45.8 | 182.7 | | | | | | | | ||||||||||||||||||||||||
| 8 Years Later |
97.1 | 30.8 | 46.9 | | | | | | | | | ||||||||||||||||||||||||
| 9 Years Later |
98.1 | 32.2 | | | | | | | | | | ||||||||||||||||||||||||
| 10 Years Later |
100.8 | | | | | | | | | | | ||||||||||||||||||||||||
| Cumulative redundancy |
|||||||||||||||||||||||||||||||||||
| (deficiency) on net reserves |
$ | 96.7 | $ | 142.7 | $ | 190.1 | $ | 172.6 | $ | 361.5 | $ | 496.1 | $ | 422.5 | $ | 448.4 | $ | 392.8 | $ | 234.8 | $ | | |||||||||||||
| Cumulative Net Paid Losses |
|||||||||||||||||||||||||||||||||||
| 1 Year Later |
$ | 54.8 | $ | 24.6 | $ | 11.1 | $ | 88.1 | $ | 81.9 | $ | 64.1 | $ | 338.9 | $ | 452.0 | $ | 304.5 | $ | 397.8 | $ | | |||||||||||||
| 2 Years Later |
80.1 | 16.0 | 0.3 | 152.0 | 90.2 | 119.1 | 437.2 | 684.0 | 532.0 | | | ||||||||||||||||||||||||
| 3 Years Later |
69.6 | 1.2 | 3.2 | 111.6 | 122.6 | 134.0 | 488.3 | 873.8 | | | | ||||||||||||||||||||||||
| 4 Years Later |
69.1 | 2.7 | (7.9 | ) | 128.0 | 101.6 | 129.7 | 541.1 | | | | | |||||||||||||||||||||||
| 5 Years Later |
69.5 | (9.0 | ) | (0.6 | ) | 107.0 | 96.6 | 164.7 | | | | | | ||||||||||||||||||||||
| 6 Years Later |
72.5 | 3.3 | 2.6 | 111.7 | 114.0 | | | | | | | ||||||||||||||||||||||||
| 7 Years Later |
78.4 | 4.7 | 9.0 | 123.3 | | | | | | | | ||||||||||||||||||||||||
| 8 Years Later |
78.5 | 6.3 | 15.1 | | | | | | | | | ||||||||||||||||||||||||
| 9 Years Later |
78.5 | 12.5 | | | | | | | | | | ||||||||||||||||||||||||
| 10 Years Later |
81.5 | | | | | | | | | | | ||||||||||||||||||||||||
| Gross reserve for claims and claim expenses |
$ | 298.8 | $ | 478.6 | $ | 403.6 | $ | 572.9 | $ | 804.8 | $ | 977.9 | $ | 1,459.4 | $ | 2,614.6 | $ | 2,098.2 | $ | 2,028.5 | $ | 2,160.6 | |||||||||||||
| Reinsurance recoverable on unpaid losses |
101.3 | 303.7 | 166.6 | 217.6 | 199.5 | 149.2 | 217.8 | 673.2 | 301.9 | 183.3 | 299.5 | ||||||||||||||||||||||||
| Net reserve for claims and claim expenses |
$ | 197.5 | $ | 174.9 | $ | 237.0 | $ | 355.3 | $ | 605.3 | $ | 828.7 | $ | 1,241.6 | $ | 1,941.4 | $ | 1,796.3 | $ | 1,845.2 | $ | 1,861.1 | |||||||||||||
| Gross liability re-estimated |
$ | 287.0 | $ | 379.0 | $ | 230.5 | $ | 362.0 | $ | 411.4 | $ | 476.4 | $ | 1,041.5 | $ | 2,134.8 | $ | 1,661.8 | $ | 1,757.0 | $ | | |||||||||||||
| Reinsurance recoverable on unpaid losses re-estimated |
186.2 | 346.8 | 183.6 | 179.3 | 167.6 | 143.8 | 222.4 | 641.8 | 258.3 | 146.6 | | ||||||||||||||||||||||||
| Net liability re-estimated |
$ | 100.8 | $ | 32.2 | $ | 46.9 | $ | 182.7 | $ | 243.8 | $ | 332.6 | $ | 819.1 | $ | 1,493.0 | $ | 1,403.5 | $ | 1,610.4 | $ | | |||||||||||||
| Cumulative redundancy |
|||||||||||||||||||||||||||||||||||
| (deficiency) on gross reserves |
$ | 11.8 | $ | 99.6 | $ | 173.1 | $ | 210.9 | $ | 393.4 | $ | 501.5 | $ | 417.9 | $ | 479.8 | $ | 436.4 | $ | 271.5 | $ | | |||||||||||||
25
Table of Contents
The following table presents an analysis of our paid, unpaid and incurred losses and loss expenses and a reconciliation of beginning and ending reserves for claims and claim expenses for the years indicated:
| Year ended December 31, |
2008 | 2007 | 2006 | |||||||||
| (in thousands) | ||||||||||||
| Net reserves as of January 1 |
$ | 1,845,221 | $ | 1,796,301 | $ | 1,941,361 | ||||||
| Net incurred related to: |
||||||||||||
| Current year |
995,316 | 712,424 | 582,788 | |||||||||
| Prior years |
(234,827 | ) | (233,150 | ) | (136,558 | ) | ||||||
| Total net incurred |
760,489 | 479,274 | 446,230 | |||||||||
| Net paid related to: |
||||||||||||
| Current year |
346,845 | 125,816 | 139,268 | |||||||||
| Prior years |
397,787 | 304,538 | 452,022 | |||||||||
| Total net paid |
744,632 | 430,354 | 591,290 | |||||||||
| Total net reserves as of December 31 |
1,861,078 | 1,845,221 | 1,796,301 | |||||||||
| Losses recoverable as of December 31 |
299,534 | 183,275 | 301,854 | |||||||||
| Total gross reserves as of December 31 |
$ | 2,160,612 | $ | 2,028,496 | $ | 2,098,155 | ||||||
For the year ended December 31, 2008, the prior year favorable development of $234.8 million included $188.1 million attributable to our Reinsurance segment and $46.7 million attributable to our Individual Risk segment. Within our Reinsurance segment, the catastrophe reinsurance unit experienced $131.6 million of favorable development on prior years estimated ultimate claim reserves, principally as a result of a comprehensive review of our expected ultimate net losses associated with the 2005 hurricanes, Katrina, Rita and Wilma. Our specialty reinsurance unit, within the Reinsurance segment, and our Individual Risk segment experienced $56.5 million and $46.7 million, respectively, of favorable development in 2008. The favorable development within our specialty reinsurance unit and Individual Risk segment was principally driven by the application of our formulaic actuarial reserving methodology for these books of business with the reductions being due to actual paid and reported loss activity being more favorable to date than what was originally anticipated when setting the initial IBNR reserves.
For the year ended December 31, 2007, the prior year favorable development of $233.2 million included $194.4 million attributable to our Reinsurance segment and $38.8 million attributable to our Individual Risk segment. Within our Reinsurance segment, the catastrophe reinsurance unit experienced $93.1 million of favorable development on prior years estimated ultimate claim reserves, principally as a result of a reduction of the ultimate losses for the 2006 and 2005 accident years as reported claims have been, to date, less than expected. Included in the 2005 accident year is a $19.2 million reduction in net claims and claim expenses associated with hurricanes Katrina, Rita and Wilma. Our specialty reinsurance unit experienced $101.3 million of favorable development in 2007. The favorable development within our specialty reinsurance unit and Individual Risk segment was principally driven by the application of our formulaic actuarial reserving methodology for these books of business with the reductions being due to actual paid and reported loss activity being more favorable to date than what was originally anticipated when setting the initial IBNR reserves.
For the year ended December 31, 2006, the prior year favorable development of $136.6 million included $125.2 million attributable to our Reinsurance segment and $11.3 million attributable to our Individual Risk segment. The reduction in prior years estimated ultimate claims reserves in our Reinsurance segment was primarily due to lower than expected claims emergence within our specialty reinsurance unit. Our specialty reinsurance unit experienced $139.2 million of favorable development in 2006 while our catastrophe reinsurance unit experienced $13.9 million of adverse development. The reductions in our reserves for our specialty reinsurance unit and Individual Risk segment were principally driven by the application of our formulaic reserving methodology used for these books of business with the reductions being due to actual paid and reported loss activity being better than what was anticipated when setting the initial IBNR reserves. In addition, within our specialty reinsurance unit, $46.0 million of the favorable development was
26
Table of Contents
driven by a reduction in carried reserves due to commutations. The adverse development in our catastrophe reinsurance unit was principally driven by an increase in our ultimate losses for a U.K. industrial property loss. This loss occurred at the end of 2005 and both the estimate of insured industry losses for this event and our estimate of our clients losses from this event increased in 2006.
Net claims and claim expenses incurred were reduced by $1.9 million during 2008 (2007 $3.3 million, 2006 $5.5 million) related to income earned on assumed reinsurance contracts that were classified as deposit contracts with underwriting risk only. Other income was reduced by $1.9 million during 2008 (2007 $1.4 million, 2006 $1.0 million) related to premiums and losses incurred on assumed reinsurance contracts that were classified as deposit contracts with timing risk only. Aggregate deposit liabilities of $73.6 million are included in reinsurance balances payable at December 31, 2008 (2007 $84.1 million) and aggregate deposit assets of $nil are included in other assets at December 31, 2008 (2007 $nil) associated with these contracts.
INVESTMENTS
Our investment guidelines stress preservation of capital, market liquidity, and diversification of risk. The large majority of our investments consist of highly rated fixed income securities. We also hold a significant amount of short term investments. Short term investments are managed as part of our investment portfolio and have a maturity of one year or less when purchased. In addition, we have an allocation to other investments, including hedge funds, private equity partnerships, bank loan funds and other investments. Our investments are subject to market-wide risks and fluctuations, as well as to risks inherent in particular securities.
The table below summarizes our portfolio of invested assets:
| At December 31, |
2008 | 2007 | ||||||||||
| (in thousands, except percentages) | ||||||||||||
| U.S. treasuries |
$ | 467,480 | 7.8 | % | $ | 767,785 | 11.5 | % | ||||
| Agencies |
448,521 | 7.4 | 290,194 | 4.4 | ||||||||
| Non-U.S. government |
57,058 | 0.9 | 66,496 | 1.0 | ||||||||
| Corporate |
747,210 | 12.4 | 937,289 | 14.1 | ||||||||
| Mortgage-backed |
1,110,594 | 18.4 | 1,251,582 | 18.9 | ||||||||
| Asset-backed |
166,022 | 2.7 | 601,017 | 9.1 | ||||||||
| Fixed maturity investments available for sale, at fair value |
2,996,885 | 49.6 | 3,914,363 | 59.0 | ||||||||
| Short term investments, at fair value |
2,172,343 | 36.0 | 1,821,549 | 27.4 | ||||||||
| Other investments, at fair value |
773,475 | 12.8 | 807,864 | 12.2 | ||||||||
| Total managed investment portfolio |
5,942,703 | 98.4 | 6,543,776 | 98.6 | ||||||||
| Investments in other ventures, under equity method |
99,879 | 1.6 | 90,572 | 1.4 | ||||||||
| Total investments |
$ | 6,042,582 | 100.0 | % | $ | 6,634,348 | 100.0 | % | ||||
For additional information regarding the investment portfolio, refer to Item 7. Managements Discussion and Analysis of Financial Condition and Results of Operations Summary of Results of Operations for 2008, 2007 and 2006 Investments.
Impact of Recent Economic and Market Conditions
Global financial markets experienced significant stress commencing in the third and fourth quarters of 2007. This continued through most of 2008, accelerated in the fourth quarter of 2008 and has continued into 2009. Initially driven in the third and fourth quarters of 2007 by challenging conditions in markets related to U.S. sub-prime mortgages (including CDOs based on sub-prime collateral), and in the markets for
27
Table of Contents
loans and bonds related to leveraged finance transactions (collectively referred to as sub-prime), additional dislocations developed further during 2008 and impacted the global credit and capital related markets, including, but not limited to:
| | a significant diminishment in the liquidity of credit markets, resulting in significantly decreased availability for many companies to sources of liquidity such as the commercial paper market, the asset securitization market and commercial and corporate lending by banks; |
| | the failure of financial institutions, most notably, Lehman Brothers Holdings Inc. (Lehman Brothers), and government interventions in others such as the Federal National Mortgage Association (Fannie Mae), the Federal Home Loan Mortgage Corporation (Freddie Mac) and AIG; |
| | the Bernard L. Madoff Investment Securities LLC (Madoff) matter; and |
| | the continuing decline in securities markets, depressed asset values and deteriorated economic strength of many companies and industries. |
The resulting adverse market environment has been characterized by significant credit spread widening, prolonged illiquidity, reduced price transparency and increased volatility. As conditions in these markets deteriorated, other areas such as the asset-backed commercial paper market also experienced decreased liquidity and the equity markets experienced short-term weakness and increased volatility. In response and in an effort to stabilize market conditions generally, the Federal Reserve and other central banks injected significant liquidity into the markets and lowered benchmark interest rates. On October 3, 2008, then-President Bush signed into law the Emergency Economic Stabilization Act of 2008 (the EESA), giving the U.S. Treasury the authority to, among other things, purchase up to $700 billion of mortgage-backed and other securities from financial institutions for the purpose of stabilizing the financial markets. Subsequently, on February 17, 2009, President Obama signed into law the American Recovery and Reinvestment Act of 2009 (the ARRA), a $787 billion stimulus bill for the purpose of stabilizing the economy by, among other things, creating jobs.
It is possible that the continued deterioration in the credit and capital markets noted above will continue to significantly adversely impact the overall economy, which could directly or indirectly give rise to adverse impacts on us, potentially including impacts we cannot currently reasonably foresee. In addition, there can be no assurance that any of the governmental or private sector initiatives designed to address such credit deterioration in the markets will be implemented, or that if implemented would be successful.
We believe that the Company is currently principally exposed to credit and capital market dislocations noted above, through its investment portfolio and underwriting portfolio, and through its investments in ventures accounted for under the equity method. Following is a summary of our current estimates relating to these exposures.
Investments. At December 31, 2008, the Company had $nil positions in fixed income securities backed by sub-prime loan collateral within its portfolio of fixed maturity investments available for sale and short term investments. The Companys investment guidelines and/or standing orders prohibit our fixed income investment managers from investing in securities supported by sub-prime collateral. In addition, our guidelines require that all securitized assets in our portfolio of fixed maturity investments available for sale be AAA rated and prohibit investments in CDOs, collateralized loan obligations (CLOs) and home equity loans as well as fixed income investments where the credit rating is backed by a financial guaranty company.
At December 31, 2008, we had $258.9 million in private equity investments and $105.8 million in hedge fund investments. Our private equity and hedge funds investments are generally managed by diversified managers who we currently do not believe are over-exposed to any one sector. Within our private equity portfolio, we may have exposure to sub-prime through underlying portfolio investments, such as financial institutions, which have been impacted by sub-prime. Our hedge fund managers independently direct and control the underlying investments and positions of such funds, and it is possible that through these funds we have more indirect exposure to sub-prime developments than we have currently estimated, or that such exposure may increase in future periods. Overall, we estimate that our exposure to sub-prime in our portfolio of hedge funds and private equity investments is minimal as of December 31, 2008.
28
Table of Contents
While our current positions in sub-prime within our portfolio of fixed maturity investments available for sale is $nil, and we believe our exposure within our hedge fund and private equity portfolio is limited, we may amend our investment guidelines in future periods and may elect to assume exposure to these or other more risky asset classes if we believe the potential return sufficiently compensate us for the risk being assumed, and our overall capital and liquidity position supports such actions.
During the year ended December 31, 2008, the Company recorded $217.0 million (2007 $25.5 million, 2006 $46.4 million) in other than temporary impairment charges including credit-related impairment charges of $8.3 million (2007 $nil, 2006 $0.1 million). The significant increase in other than temporary impairment charges is primarily the result of widening credit spreads during 2008 due to the turmoil in the credit and capital markets noted above. The credit-related other than temporary impairment charges during 2008 of $8.3 million include impairments for which the Company believes it will not be able to recover the full principal amount if the impaired security is held to maturity, and were principally driven by the Companys direct holdings of fixed maturity securities issued by Lehman Brothers. As of December 31, 2008, the Company had essentially no fixed maturity investments available for sale in an unrealized loss position.
Underwriting Portfolio. The Companys reinsurance portfolio is exposed to risks relating to claims against financial institutions and other organizations involved in the underwriting, soliciting, documentation, collateralization, brokering, marketing, rating or purchase of, among other things, sub-prime mortgages (including through derivative instruments). We believe that the ongoing market turmoil in the U.S., originally manifested in perceived potential losses arising out of sub-prime exposures, will likely have an effect on other lines in the insurance industry, such as directors & officers (D&O), errors & omissions (E&O) and other professional lines coverage. Shareholder actions have been filed in the marketplace relating to, among other things, omitting disclosure of investment exposure to failing institutions such as Lehman Brothers; breach of fiduciary duties of care in hastily agreeing to the acquisitions of The Bear Stearns Companies Inc. (Bear Stearns), Merrill Lynch & Co. Inc. and Wachovia Corporation; and allegedly grossly imprudent risk taking in the subprime lending market by AIG. In addition, several entities, including Fannie Mae, Freddie Mac, Lehman Brothers, AIG, Countrywide Financial Corporation, UBS AG, Bear Stearns and others are the subject of one or more investigations by the SEC, the Federal Bureau of Investigations and/or various other regulatory bodies or enforcement agencies. Moreover, in the fourth quarter of 2008, it was purported that Madoff was a part of the largest ponzi scheme in history. We expect there to be further actions with varying theories of liability in the foreseeable future. It appears that a large number of professional service firms could be affected across the lines noted above. Our casualty clash book of business, within the specialty unit of our Reinsurance segment, has, or could have, exposure under various purported theories of liability, particularly arising from the D&O and E&O market. Our estimate of these losses at December 31, 2008 is $77.5 million, an increase of $17.5 million from our December 31, 2007 estimate, with the majority of the increase relating to potential exposures arising out of the Madoff matter which was discovered in the fourth quarter of 2008. These losses are included in our Reinsurance segment results. In addition, our specialty unit has exposure to risks relating to the decrease in home demand through our surety book of business, which could lead to delays and defaults in projects, and could cause additional losses, although we currently believe we have no sub-prime related losses in our surety book of business.
Investments in other ventures under equity method. During 2007, ChannelRe suffered a significant net loss which reduced ChannelRes GAAP shareholders equity below $nil. The net loss was driven by unrealized mark-to-market losses related to financial guaranty contracts accounted for as derivatives under GAAP. As a result, the Company reduced its carried value in ChannelRe to $nil which negatively impacted our net income by $151.8 million in 2007. As a result of reducing our carried value in ChannelRe to $nil, combined with the fact that we have no further contractual obligations to provide capital or other support to ChannelRe, we believe we currently have no further negative economic exposure to ChannelRe. Since ChannelRe remained in a negative shareholders equity position during 2008, our investment in ChannelRe continues to be carried at $nil. It is possible that with the adoption of FASB Statement No. 157, Fair Value Measurements (FAS 157) by ChannelRe in 2008, that in future periods the nonperformance risk or own credit risk portion of ChannelRes mark-to-market on its financial guaranty contracts accounted for as derivatives under GAAP may increase, or that the underlying mark-to-market on ChannelRes financial guaranty contracts accounted for as derivatives under GAAP may decrease, or both, which could result in
29
Table of Contents
ChannelRe returning to a positive equity position, at which time we would then record our share of ChannelRes net income, subject to impairment, or our share of ChannelRes net loss.
During the fourth quarter of 2007, we invested $25.5 million in the preferred equity of Aladdin Credit Products Ltd. (Aladdin). Aladdin was established to provide credit protection on fixed income securities in return for a premium. Due to adverse market conditions, Aladdin elected to not write any business and subsequently announced during the fourth quarter of 2008 that it would wind-up its operations and return the residual capital to shareholders. The Company expects to receive the majority of its original investment, less certain administrative expenses incurred. At December 31, 2008, the Company recorded a receivable of $24.4 million in other assets for the expected liquidation value of Aladdin. During January 2009, the Company received an initial payout of $24.2 million with the final distribution expected to be received during the second quarter of 2009.
MARKETING
Reinsurance
We believe that our modeling and technical expertise, the risk management advice that we provide to our clients, and our reputation for paying claims promptly has enabled us to become a provider of first choice in many lines of business to our customers worldwide. We market our Reinsurance products worldwide exclusively through reinsurance brokers and we focus our marketing efforts on targeted brokers. We believe that our existing portfolio of business is a valuable asset and, therefore, we attempt to continually strengthen relationships with our existing brokers and clients. We target prospects that are capable of supplying detailed and accurate underwriting data and that potentially add further diversification to our book of business.
We believe that primary insurers and brokers willingness to use a particular reinsurer is based not just on pricing, but also on the financial security of the reinsurer, its claim paying ability ratings and demonstrated willingness to promptly pay valid claims, the quality of a reinsurers service, the reinsurers willingness and ability to design customized programs, its long-term stability and its commitment to provide reinsurance capacity. We believe we have established a reputation with our brokers and clients for prompt response on underwriting submissions, fast claims payments and a reputation for providing creative solutions to our customers needs. Since we selectively write large lines on a limited number of property catastrophe reinsurance contracts, we can establish reinsurance terms and conditions on those contracts that are attractive in our judgment, make large commitments to the most attractive programs and provide superior client responsiveness. We believe that our willingness and ability to design customized programs and to provide advice on catastrophe risk management has helped us to develop long-term relationships with brokers and clients.
30
Table of Contents
Our reinsurance brokers assess client needs and perform data collection, contract preparation and other administrative tasks, enabling us to market our reinsurance products cost effectively by maintaining a smaller staff. We believe that by maintaining close relationships with brokers, we are able to obtain access to a broad range of potential reinsureds. In recent years, our distribution has become increasingly reliant on a small number of such relationships, a trend which we believe has been accelerated by the merger of AON and Benfield. We expect this concentration to continue and perhaps increase. The following table shows the percentage of our Reinsurance segment gross premiums written generated through our largest brokers for the years ended December 31, 2008, 2007 and 2006:
| Year ended December 31, |
2008 | 2007 | 2006 | ||||||
| Percentage of gross premiums written |
|||||||||
| Benfield Group Limited (1) |
48.3 | % | 50.0 | % | 40.6 | % | |||
| AON Corporation (1) |
13.2 | 10.4 | 9.8 | ||||||
| Total Benfield Group Limited and AON Corporation (1) |
61.5 | 60.4 | 50.4 | ||||||
| Marsh Inc. |
18.2 | 19.6 | 25.4 | ||||||
| Willis Group |
8.9 | 11.8 | 14.3 | ||||||
| Total of largest brokers |
88.6 | 91.8 | 90.1 | ||||||
| All others |
11.4 | 8.2 | 9.9 | ||||||
| Total percentage of gross premiums written |
100.0 | % | 100.0 | % | 100.0 | % | |||
| (1) | On November 11, 2008, AON Corporation completed its acquisition of Benfield Group Limited. The table above shows the gross premiums written brokered by these entities on a stand alone and consolidated basis. |
During 2008, our Reinsurance segment issued authorization for coverage on programs submitted by 40 brokers worldwide (2007 39 brokers). We received approximately 2,791 program submissions during 2008 (2007 approximately 2,483). Of these submissions, we issued authorizations for coverage for approximately 828 programs, or approximately 30% of the program submissions received (2007 approximately 790 programs, or approximately 32%).
Individual Risk
Our Individual Risk business is produced primarily through four distribution channels as per the table below:
| Year ended December 31, |
2008 | 2007 | 2006 | ||||||
| Individual Risk gross premiums written |
|||||||||
| Program manager wholly owned (1) |
46.4 | % | 32.1 | % | 18.9 | % | |||
| Program managers third party |
36.9 | 42.4 | 44.3 | ||||||
| Quota share reinsurance |
16.6 | 25.1 | 34.5 | ||||||
| Broker-produced business |
0.1 | 0.4 | 2.3 | ||||||
| Total Individual Risk gross premiums written |
100.0 | % | 100.0 | % | 100.0 | % | |||
| (1) | Program manager wholly owned represents Agro National which we acquired in an asset purchase on June 2, 2008. The table above is presented as if Agro National has been a wholly-owned subsidiary since the first period presented. |
The business produced through third party program managers, quota share reinsurance and broker-produced business principally comes to us through intermediaries. Our financial security ratings, combined with our reputation in the reinsurance marketplace, including the long-standing relationships we have developed with our reinsurance intermediaries, have enhanced our presence in our Individual Risk markets.
With respect to our program business, we believe that our strategy of establishing strong relationships and assisting our partners with modeling, risk analysis and other expertise has helped us to develop a favorable
31
Table of Contents
reputation in this market. We believe that our existing third party program managers are an important source of referrals and endorsements of our approach to this business. In addition, we acquired the net assets of Agro National, LLC in June 2008, a managing general underwriter of multi-peril crop insurance, which is now a wholly owned program manager presenting additional opportunities in our Individual Risk markets.
Our broker-produced business is principally written on an excess and surplus lines basis by Glencoe and Lantana on a risk-by-risk basis. This business is generally submitted to us through licensed surplus lines brokers who are generally responsible for regulatory compliance, premium tax collection and certain other matters associated with policy placement.
New Business
For information related to New Business, refer to Item 7. Managements Discussion and Analysis of Financial Condition and Results of Operations Overview.
EMPLOYEES
At February 11, 2009, we and our subsidiaries employed approximately 400 people worldwide (February 12, 2008 236 people, February 12, 2007 218 people). We believe our strong employee relations are among our most significant strengths. None of our employees are subject to collective bargaining agreements. We are not aware of any current efforts to implement such agreements at any of our subsidiaries. Historically, the Company has looked for opportunities to strengthen its operations during periods of softening markets in preparation for improving market conditions.
As noted above, the Company added approximately 164 employees year over year, primarily driven by its asset acquisitions of Agro National, LLC and CMS. In addition, the Company added resources in, among others, its accounting and legal functions, as well as certain of its current and expected future business units. We believe that our employee headcount is likely to continue to increase over time as the Company expands geographically, and seeks to enter new lines of business. We expect that our employee growth in the U.S. and other highly regulated markets will increase our operating and compliance complexity and expenses, although we do not expect these increases to be material to the Company as a whole.
INFORMATION TECHNOLOGY
Our information technology infrastructure is important to our business. Our information technology platform, supported by a team of professionals, is currently principally located in our corporate headquarters and principal corporate offices in Bermuda. Additional information technology assets are maintained at the office locations of our operating subsidiaries. We have implemented backup procedures that seek to ensure that our key business systems and data are backed up, generally on a daily basis, and can be restored promptly if and as needed. In addition, we generally store backup information at off-site locations, in order to seek to minimize our risk of loss of key data in the event of a disaster.
We have implemented and periodically test our disaster recovery plans with respect to our information technology infrastructure. Among other things, our recovery plans involve arrangements with off-site, secure data centers in alternative locations. We believe we will be able to access our systems from these facilities in the event that our primary systems are unavailable due to a scenario such as a natural disaster.
REGULATION
U.S. Regulation
Reinsurance Regulation. Our Bermuda-domiciled insurance operations and joint ventures principally consist of Renaissance Reinsurance, DaVinci, Glencoe and Lantana. Renaissance Reinsurance, DaVinci and Top Layer Re are Bermuda-based companies that operate as reinsurers. Although none of these companies is admitted to transact the business of insurance in any jurisdiction except Bermuda, the insurance laws of each state of the U.S. regulate the sale of reinsurance to ceding insurers authorized in the state by non-admitted alien reinsurers, such as Renaissance Reinsurance or DaVinci, acting from locations outside the state. Rates, contract terms and conditions of reinsurance agreements generally are not subject
32
Table of Contents
to regulation by any governmental authority. A primary insurer ordinarily will enter into a reinsurance agreement, however, only if it can obtain credit for the reinsurance ceded on its statutory financial statements. In general, regulators permit ceding insurers to take credit for reinsurance under the following circumstances if the contract contains certain minimum provisions: if the reinsurer is licensed or accredited, if the reinsurer is domiciled in a state with substantially similar regulatory requirements as the primary insurers domiciliary jurisdiction and meets certain financial requirements, or if the reinsurance obligations are collateralized appropriately.
As alien companies, our Bermuda subsidiaries collateralize their reinsurance obligations to U.S. insurance companies. With some exceptions, the sale of insurance or reinsurance within a jurisdiction where the insurer is not admitted to do business is prohibited. Neither Renaissance Reinsurance nor DaVinci intends to maintain an office or to solicit, advertise, settle claims or conduct other insurance activities in any jurisdiction, other than Bermuda, where the conduct of such activities would require that each company be so admitted.
The National Association of Insurance Commissioners (NAIC) adopted a framework to modernize the current U.S. reinsurance regulatory framework, with implementation details to follow. The framework contemplates the creation of the NAIC Reinsurance Supervision Review Department (RSRD) to analyze foreign regulatory regimes for functional equivalence with U.S. jurisdictions and a port of entry certification process to allow a non-U.S. reinsurer from an RSRD approved jurisdiction to enter the U.S. reinsurance market through a single state. The framework contemplates credit for reinsurance collateral levels from 0% to 100% based on the ratings assigned to reinsurers. Accordingly, the framework may lead to a reduction of the collateral requirements for non-U.S. reinsurers, which could be beneficial to our Bermuda subsidiaries. Certain individual states have moved forward with initiatives for similar revised collateral requirements as well. At this time, we are unable to determine how such changes in the U.S. reinsurance regulatory framework will be implemented and the effect, if any, such changes would have on our operations or financial condition.
Excess and Surplus Lines Regulation. Glencoe and Lantana, domiciled in Bermuda, are not licensed in the U.S. but are eligible to offer coverage in the U.S. exclusively in the surplus lines market. Glencoe and Lantana are eligible to write surplus lines primary insurance in 51 and 49 jurisdictions of the U.S., respectively, and each is subject to the surplus lines regulation and reporting requirements of the jurisdictions in which it is eligible to write surplus lines primary insurance. In accordance with certain provisions of the NAIC Nonadmitted Insurance Model Act, which provisions have been adopted by a number of states, Glencoe and Lantana have each established, and are required to maintain, a trust funded to a minimum amount as a condition of its status as an eligible, non-admitted insurer in the U.S. Although surplus lines business is generally less regulated than the admitted market, strict regulations apply to surplus lines placements under the laws of every state, and the regulation of surplus lines insurance may undergo changes in the future. Federal and/or state measures may be introduced and promulgated that would result in increased oversight and regulation of surplus lines insurance. Additionally, some recent and pending cases in Florida and California courts have raised potentially significant questions regarding surplus lines insurance in those states such as whether surplus lines insurers will be subject to policy form content, filing and approval requirements or additional taxes. These cases also could foreshadow more extensive oversight of surplus lines insurance by other jurisdictions. Any increase in our regulatory burden may impact our operations and ultimately could impact our financial condition as well.
Admitted Market Regulation. Our admitted U.S. insurance company operations currently consist of Stonington and Stonington Lloyds, both Texas domiciled insurers. Stonington is licensed to write primary insurance in 50 states and the District of Columbia. Stonington Lloyds is a Texas Lloyds company licensed to write primary insurance in Texas. Stonington acts as an attorney-in-fact for Stonington Lloyds. As licensed insurers operating in the admitted market, these companies are subject to extensive regulation. The extent of regulation varies from state to state but generally has its source in statutes that delegate regulatory, supervisory and administrative authority to a department of insurance in each state. Among other things, state insurance statutes require insurance companies to file financial statements, conduct periodic examinations of the affairs of insurance companies and regulate insurer solvency standards, insurer licensing, authorized investments, premium rates, restrictions on the size of risks that may be insured under a single policy, loss and expense reserves and provisions for unearned premiums, deposits of
33
Table of Contents
securities for the benefit of policyholders, policy form approval, policy renewals and non-renewals, and market conduct regulation including both underwriting and claims practices.
Licensed U.S. insurers are required to participate in various state residual market mechanisms whose goal is to provide affordability and availability of insurance to those consumers who may not otherwise be able to obtain insurance. The mechanics of how each states residual markets operate may differ, but generally, risks are either assigned to various private carriers or the state manages the risk through a pooling arrangement. If losses exceed the funds the pool has available to pay those losses, the pools have the ability to assess insurers to provide additional funds to the pool. The amounts of the assessment for each company are normally based upon the proportion of each insurers (and in some cases the insurers and its affiliates) written premium for coverages similar to those provided by the pool, and are frequently uncapped. State guaranty associations also have the ability to assess licensed U.S. insurers in order to provide funds for payment of losses for insurers which have become insolvent. In many cases, but not all, assessed insurers may recoup the amount of these guaranty fund and state pool assessments by surcharging future policyholders.
Holding Company Regulation. We and our U.S. insurance company subsidiaries are subject to regulation under the insurance holding company laws of various jurisdictions. The insurance holding company laws and regulations vary from jurisdiction to jurisdiction, but generally require an insurance holding company, and insurers that are subsidiaries of insurance holding companies, to register with state regulatory authorities and to file with those authorities certain reports, including information concerning their capital structure, ownership, financial condition, certain intercompany transactions and general business operations. In addition, under the terms of applicable state statutes, any person or entity obtaining beneficial ownership of 10% (with certain limited exceptions) or more of our outstanding voting securities is required to apply for and receive prior regulatory approval for such acquisition, and our U.S. insurance company subsidiaries are required to report ownership changes to their domiciliary regulator. Further, in order to protect insurance company solvency, state insurance statutes typically place limitations on the amount of dividends or other distributions payable to affiliates by insurance companies.
NAIC Ratios. The NAIC has established 11 financial ratios to assist state insurance departments in their oversight of the financial condition of licensed U.S. insurance companies operating in their respective states. The NAICs Insurance Regulatory Information System (IRIS) calculates these ratios based on information submitted by insurers on an annual basis and shares the information with the applicable state insurance departments. Each ratio has an established usual range of results and assists state insurance departments in executing their statutory mandate to oversee the financial condition of insurance companies. A ratio result falling outside the usual range of IRIS ratios is not considered a failing result; rather unusual values are viewed as part of the regulatory early monitoring system. Furthermore, in some years, it may not be unusual for financially sound companies to have several ratios with results outside the usual ranges. An insurance company may fall out of the usual range for one or more ratios because of specific transactions that are in themselves immaterial. Generally, an insurance company will be subject to increased regulatory scrutiny if it falls outside the usual ranges with respect to four or more of the ratios.
Risk-Based Capital. The NAIC has implemented a risk-based capital (RBC) formula and model law applicable to all licensed U.S. property/casualty insurance companies. The RBC formula is designed to measure the adequacy of an insurers statutory surplus in relation to the risks inherent in its business. Such analysis permits regulators to identify inadequately capitalized insurers. The RBC formula develops a risk adjusted target level of statutory capital by applying certain factors to insurers business risks such as asset risk, underwriting risk, credit risk and off-balance sheet risk. The target level of statutory surplus varies not only as a result of the insurers size, but also on the risk profile of the insurers operations. Insurers that have less statutory capital than the RBC calculation requires are considered to have inadequate capital and are subject to varying degrees of regulatory action depending upon the level of capital inadequacy. The RBC formulas have not been designed to differentiate among adequately capitalized companies that operate with higher levels of capital. Therefore, it is inappropriate and ineffective to use the formulas to rate or to rank such companies.
Legislative and Regulatory Proposals. Government intervention in the insurance and reinsurance markets in the U.S. continues to evolve. Although U.S. state regulation is the primary form of regulation of insurance
34
Table of Contents
and reinsurance, Congress has considered over the past year various proposals relating to potential surplus lines regulation, reinsurance regulation, the creation of an optional federal charter, the creation of a systemic risk regulator, and tax law changes, including changes to increase the taxation of reinsurance premiums paid to affiliates with respect to U.S. risks. None of these proposals were adopted by the 110th Congress before it adjourned. Additionally, some members of the U.S. House of Representatives have called for the recently appointed Treasury Secretary unilaterally to create an insurance oversight office within the Treasury Department or assign a high level Treasury Department appointee with insurance duties to provide oversight and expertise at the federal level and provide policymakers with insight into issues regarding the insurance market as reform is contemplated. Although we are unable to predict what new laws and regulations will be proposed in the 111th Congress, whether any such proposed laws and regulations will be adopted, or the form in which any such laws and regulations would be adopted, we believe it is more likely than at times in the past that the current Congress will adopt laws and/or regulations with respect to insurance, and we anticipate that these developments will impact our operations and also could impact our financial condition.
In addition to potential new insurance industry regulation, the Obama administration and Congress are also considering various regulatory reforms for the financial markets, including potentially as it pertains to the (re)insurance industry. We are unable to predict what reforms will be proposed or adopted or the effect, if any, that such reforms would have on our operations and financial condition. We are carefully monitoring such developments.
In 2007, Florida enacted legislation which enabled the Florida Hurricane Catastrophe Fund to offer increased amounts of coverage in addition to the mandatory coverage amount, at below-market rates. Further, the legislation expanded the ability of the state-sponsored insurer, Citizens, to compete with private insurance companies, such as ours and other companies that cede business to us. This legislation reduced the role of the private insurance and reinsurance markets in Florida, a key target market of ours. Efforts in 2008 to partially reduce this expansion of state participation in the market did not succeed. The property insurance market in Florida remains unstable, with participants, both public and private, continuing to evaluate and seek a variety of possible initiatives. Due to our position as one of the largest providers of catastrophe-exposed coverage, both on a global basis, and in respect to the Florida market, recent and future legislative and regulatory changes in Florida may have a disproportionate impact on us compared to other market participants.
It is also possible that other states, particularly those with Atlantic or Gulf Coast exposures, may enact new or expanded legislation based on some version of the Florida precedent, which would further diminish aggregate private market demand for our products. Moreover, there were several federal bills proposed in the 110th Congress which included a federal reinsurance backstop mechanism for catastrophic type natural disasters which were too large for state catastrophe funds to absorb. We believe these bills, or some version of them, are likely to be proposed in the 111th Congress. Although we believe such legislation will be vigorously opposed, if enacted, these bills would likely further erode the role of private market catastrophe reinsurers.
The potential for further expansion into additional insurance markets, could expose us or our subsidiaries to increasing regulatory oversight, including the oversight of countries other than Bermuda and the U.S. However, we intend to continue to conduct our operations so as to minimize the likelihood that Renaissance Reinsurance, DaVinci, Top Layer Re, Glencoe, Lantana, or any of our other Bermudian subsidiaries will become subject to direct U.S. regulation. In addition, as discussed above, RIM and RTL are involved in certain commodities trading activities relating to weather, natural gas, heating oil, power, crude oil, agricultural commodities and cross-commodity structures. While RIMs and RTLs operations currently are not subject to significant federal oversight, we are monitoring carefully new or revised legislation or regulation in the United States or otherwise, which could increase the regulatory burden and operating expenses of these operations.
Bermuda Regulation
All Bermuda companies must comply with the provisions of the Companies Act 1981. In addition, the Insurance Act 1978 (Insurance Act) regulates the business of our Bermuda insurance and management company subsidiaries.
35
Table of Contents
As a holding company, RenaissanceRe is not subject to the Insurance Act. However, the Insurance Act regulates the insurance and reinsurance business of our operating insurance companies. The Companys most significant operating subsidiaries include Renaissance Reinsurance and DaVinci which are registered as Class 4 insurers and Glencoe, Lantana, and Top Layer Re which are registered as Class 3 insurers. RUM is registered as an insurance manager.
The Insurance Act imposes solvency and liquidity standards as well as auditing and reporting requirements and confers on the Bermuda Monetary Authority (BMA) powers to supervise, investigate and intervene in the affairs of insurance companies. Significant requirements of the Insurance Act include the appointment of an independent auditor and loss reserve specialist (both of whom must be approved by the BMA), the filing of an annual financial return and provisions relating to the payment of distributions and dividends. In particular:
| | An insurer must prepare annual statutory financial statements which must be submitted as part of its statutory financial return no later than four months after the insurers financial year end (unless specifically extended). The annual statutory financial statements give detailed information and analyses regarding premiums, claims, reinsurance, reserves and investments. The statutory financial return includes, among other items, a report of the approved independent auditor on the statutory financial statements; a declaration of statutory ratios; a solvency certificate; the statutory financial statements themselves; the opinion of the approved loss reserve specialist and, in the case of Class 4 insurers, details concerning ceded reinsurance. The statutory financial statements and the statutory financial return do not form part of the public records maintained by the BMA. |
| | In addition to preparing statutory financial statements, effective December 31, 2008, all Class 4 insurers must prepare financial statements in respect of their insurance business in accordance with generally accepted insurance principles or international financial reporting standards. |
| | An insurers statutory assets must exceed its statutory liabilities by an amount greater than the prescribed minimum solvency margin which varies with the category of its registration and net premiums written and loss reserves posted (Minimum Solvency Margin). The Minimum Solvency Margin that must be maintained by a Class 4 insurer is the greater of (i) $100 million, or (ii) 50% of net premiums written (with a credit for reinsurance ceded not exceeding 25% of gross premiums) or (iii) 15% of net discounted aggregate loss and loss expense provisions and other insurance reserves. The Minimum Solvency Margin for a Class 3 insurer is the greater of (i) $1 million, or (ii) 20% of the first $6 million of net premiums written; if in excess of $6 million, the figure is $1.2 million plus 15% of net premiums written in excess of $6 million, or (iii) 15% of net discounted aggregate loss and loss expense provisions and other insurance reserves. |
| | An insurer engaged in general business is required to maintain the value of its relevant assets at not less than 75% of the amount of its relevant liabilities (Minimum Liquidity Ratio). |
| | Both Class 3 and Class 4 insurers are prohibited from declaring or paying any dividends if in breach of the required Minimum Solvency Margin or Minimum Liquidity Ratio (the Relevant Margins) or if the declaration or payment of such dividend would cause the insurer to fail to meet the Relevant Margins. Where an insurer fails to meet its Relevant Margins on the last day of any financial year, it is prohibited from declaring or paying any dividends during the next financial year without the prior approval of the BMA. Further, a Class 4 insurer is prohibited from declaring or paying in any financial year dividends of more than 25% of its total statutory capital and surplus (as shown on its previous financial years statutory balance sheet) unless it files (at least seven days before payment of such dividends) with the BMA an affidavit stating that it will continue to meet its Relevant Margins. Class 3 and Class 4 insurers must obtain the BMAs prior approval for a reduction by 15% or more of the total statutory capital as set forth in its previous years financial statements. These restrictions on declaring or paying dividends and distributions under the Insurance Act are in addition to the solvency requirements under the Companies Act which apply to all Bermuda companies. |
| | If the BMA believes that an investigation is required in the interests of an insurers policyholders or persons who may become policyholders, it may appoint an inspector who has extensive powers of investigation. If it appears to the BMA to be desirable in the interests of policyholders, the BMA may also exercise these powers in relation to holding companies, subsidiaries and other affiliates of insurers. |
36
Table of Contents
| If it appears to the BMA that there is a risk of an insurer becoming insolvent, or that insurer is in breach of the Insurance Act or any conditions of its registration, the BMA may exercise extensive powers of intervention including directing the insurer not to take on any new insurance business or prohibiting the company from declaring and paying dividends or other distributions. |
| | Any person who, directly or indirectly, becomes a holder of at least 10%, 20%, 33% or 50% of the voting shares of an insurer must notify the BMA of its holdings. |
| | Where it appears to the BMA that a person who is a controller of any description of a registered person is not or is no longer a fit and proper person to be such a controller, it may serve him with a written notice of objection to his being such a controller of the registered person. |
| | Under the provisions of the Insurance Act, the BMA may, from time to time, conduct on site visits at the offices of insurers it regulates. |
The Insurance Act was amended in 2008 by the introduction, among other things, of the Bermuda Solvency Capital Requirement (the BSCR) which is a standard mathematical model designed to give the BMA more advanced methods for determining an insurers capital adequacy. Where insurers apply in-house models that deal more effectively with their own particular risks and where such models satisfy the standards established by the BMA, such insurers may apply to the BMA to use such models in lieu of the BSCR. Underlying the BSCR is the belief that all insurers should operate on an ongoing basis with a view to maintaining their capital at a prudent level in excess of the Minimum Solvency Margin otherwise prescribed under the Insurance Act.
Effective December 31, 2008, all Class 4 insurers must maintain their capital at a target level which is set at 120% of the minimum amount calculated in accordance with the BSCR or the companys approved in-house model (the Enhanced Capital Requirement or ECR). In circumstances where the BMA concludes that the companys risk profile deviates significantly from the assumptions underlying the ECR or the companys assessment of its management policies and practices, it may issue an order requiring that the company adjust its ECR.
In addition to introducing the BSCR, the legislation referenced above also provided that all Class 3 insurers submit a re-classification application to the BMA by December 31, 2008. Under the new classification criteria, all Class 3 companies are now classified as a Class 3, a Class 3A (Small Commercial) insurer or a Class 3B (Large Commercial) insurer. Of the Companys Class 3 insurers, Glencoe, Lantana and Top Layer Re have applied to be re-classified as Class 3As.
It is anticipated that a number of the regulatory and supervisory requirements currently applicable to Class 4 insurers (including the BSCR discussed above) will ultimately be extended to the new Class 3Bs. The regulatory regime applicable to the new Class 3As and Class 3s is expected to remain largely unchanged.
AVAILABLE INFORMATION
We maintain a website at http://www.renre.com. The information on our website is not incorporated by reference in this Form 10-K.
We make available, free of charge through our website, our financial information, including the information contained in our Annual Reports on Form 10-K, Quarterly Reports on Form 10-Q, Current Reports on Form 8-K and amendments to those reports filed or furnished pursuant to Section 13(a) or 15(d) of the Exchange Act as soon as reasonably practicable after we electronically file such material with, or furnish such material to, the SEC. We also make available, free of charge from our website, our Audit Committee Charter, Compensation/Governance Committee Charter, Corporate Governance Guidelines and Statement of Policies, and Code of Ethics and Conduct (Code of Ethics). Such information is also available in print for any shareholder who sends a request to RenaissanceRe Holdings Ltd., Attn: Office of the Corporate Secretary, P.O. Box HM 2527, Hamilton, HMGX, Bermuda. Reports filed with the SEC may also be viewed or obtained at the SEC Public Reference Room at 100 F Street, N.E., Washington, DC 20549. Information on the operation of the SEC Public Reference Room may be obtained by calling the SEC at 1-800-SEC-0330. The SEC maintains an internet site that contains reports, proxy and information statements, and other information regarding issuers, including the Company, that file electronically with the SEC. The address of the SECs website is http://www.sec.gov.
37
Table of Contents
Factors that could cause our actual results to differ materially from those in the forward-looking statements contained in this Form 10-K and other documents we file with the SEC include the following:
RISKS RELATED TO OUR COMPANY
Our exposure to catastrophic events and other exposures that we cover could cause our financial results to vary significantly from one period to the next.
Our largest product based on total gross premiums written is property catastrophe reinsurance. We also sell lines of specialty reinsurance and certain Individual Risk products that are exposed to catastrophe risk. We therefore have a large overall exposure to natural and man-made disasters, such as earthquakes, hurricanes, tsunamis, winter storms, freezes, floods, fires, tornados, hailstorms, drought and other natural or man-made disasters, such as acts of terrorism. As a result, our operating results have historically been, and we expect will continue to be, significantly affected by relatively few events of large magnitude.
We expect claims from catastrophic events to cause substantial volatility in our financial results for any fiscal quarter or year; moreover, catastrophic claims could adversely affect our financial condition, results of operations and cash flows. Our ability to write new business could also be affected. We believe that increases in the value and geographic concentration of insured property, particularly along coastal regions, and the effects of inflation may continue to increase the severity of claims from catastrophic events in the future.
From time to time, we expect to have greater exposures in one or more specific geographic areas than our overall share of the worldwide market would unilaterally suggest. Accordingly, when and if catastrophes occur in these areas, we may experience relatively more severe net negative impacts from such events than our competitors. In particular, the Company has historically had a relatively large percentage of its coverage exposures concentrated in the state of Florida.
We may fail to execute our strategy, which would impair our future financial results.
Historically, our principal product has been property catastrophe reinsurance. As we have expanded and continue to expand into other lines of business, we have been and will be presented with new and expanded challenges and risks which we may not manage successfully. Businesses in early stages of development present substantial business, financial and operational risks and may suffer significant losses. For example, our current and potential future expansion may require us to develop new client and customer relationships, supplement existing or build new operating procedures, hire staff, develop and install management information and other systems, as well as take numerous other steps to implement our strategies. If we fail to continue to develop the necessary infrastructure, or otherwise fail to execute our strategy, our results from these newer lines of business will likely suffer, perhaps substantially, and our future financial results may be adversely affected.
In addition, our expansion into newer lines of business may place increased demands on our financial, managerial and human resources. For example, we may need to attract additional professionals, and to the extent we are unable to attract such additional professionals, our existing financial, managerial and human resources may be strained. Our future profitability depends in part on our ability to further develop our resources and effectively manage expansion, and our inability to do so may impair our future financial results.
A decline in the ratings assigned to our financial strength may adversely impact our business, perhaps materially so.
Third party rating agencies assess and rate the financial strength of reinsurers and insurers, such as Renaissance Reinsurance and certain of our other operating subsidiaries and joint ventures. These ratings are based upon criteria established by the rating agencies. Periodically, the rating agencies evaluate us and may downgrade or withdraw their financial strength ratings in the future if we do not continue to meet the criteria of the ratings previously assigned to us. The financial strength ratings assigned by rating agencies to reinsurance or insurance companies are based upon factors relevant to policyholders and are not directed toward the protection of investors.
38
Table of Contents
These ratings are subject to periodic review and may be revised or revoked, by the agencies which issue them. In addition, from time to time one or more ratings agencies have effected changes in their capital models and rating methodologies, which have generally served to increase the amounts of capital required to support the ratings, and it is possible that legislation arising as a result of the ongoing financial crisis may result in additional changes.
Negative ratings actions in the future could have an adverse effect on our ability to fully realize the market opportunities we currently expect to participate in. In addition, it is increasingly common for our reinsurance contracts to contain provisions permitting our clients to cancel coverage pro-rata if our relevant operating subsidiary is downgraded below a certain rating level. Whether a client would exercise this right would depend, among other factors, on the reason for such a downgrade, the extent of the downgrade, the prevailing market conditions and the pricing and availability of replacement reinsurance coverage. Therefore, in the event of a downgrade, it is not possible to predict in advance the extent to which this cancellation right would be exercised, if at all, or what effect such cancellations would have on our financial condition or future operations, but such effect potentially could be material. To date, we are not aware that we have experienced such a cancellation.
Our ability to compete with other reinsurers and insurers, and our results of operations, could be materially adversely affected by any such ratings downgrade. For example, following a ratings downgrade we might lose clients to more highly rated competitors or retain a lower share of the business of our clients.
For the current ratings of certain of our subsidiaries and joint ventures, refer to Item 1. Business Ratings.
Because we depend on a few insurance and reinsurance brokers in our Reinsurance segment and several third party program managers in our Individual Risk segment for a large portion of revenue, loss of business provided by them could adversely affect us.
Our Reinsurance business markets insurance and reinsurance products worldwide exclusively through insurance and reinsurance brokers. Four brokerage firms accounted for 88.6% of our Reinsurance segment gross premiums written for the year ended December 31, 2008. Subsidiaries and affiliates of the Benfield, Marsh Inc., AON and the Willis Group accounted for approximately 48.3%, 18.2%, 13.2% and 8.9%, respectively, of our Reinsurance segment gross premiums written in 2008. As noted above, in 2008 AON acquired Benfield resulting in the combined entity accounting for 61.5% of our Reinsurance segment gross premiums written in 2008.
Our Individual Risk business markets a significant portion of its insurance and reinsurance products through third party program managers. In recent years, our Individual Risk and reinsurance segments have experienced increased concentration of production from a smaller number of intermediaries. Third party program managers accounted for 36.9% of our Individual Risk segment gross premiums written for the year ended December 31, 2008.
The loss of a substantial portion of the business provided by our brokers and/or third party program managers would have a material adverse effect on us. Our ability to market our products could decline as a result of any loss of the business provided by these brokers and/or third party program managers and it is possible that our premiums written would decrease.
Our utilization of brokers, third party program managers and other third parties to support our business exposes us to operational and financial risks.
Our Individual Risk operations rely on third party program managers, and other agents and brokers participating in our programs, to produce and service a substantial portion of our operations in this segment. In these arrangements, we typically grant the program manager the right to bind us to newly issued and renewal insurance policies, subject to underwriting guidelines we provide and other contractual restrictions and obligations. Should our third party program managers issue policies that contravene these guidelines, restrictions or obligations, we could nonetheless be deemed liable for such policies. Although we would intend to resist claims that exceed or expand on our underwriting intention, it is possible that we would not prevail in such an action, or that our program manager would be unable to substantially indemnify us for their contractual breach. We also rely on our third party program managers, third party
39
Table of Contents
administrators or other third parties we retain, to collect premiums and to pay valid claims. We could also be exposed to the program managers or their producers operational risk, for example, but not limited to, contract wording errors, technological and staffing deficiencies and inadequate disaster recovery plans.
We could also be exposed to potential liabilities relating to the claims practices of the third party administrators we have retained to manage substantially all of the claims activity that we expect to arise in our Individual Risk operations. Although we have implemented monitoring and other oversight protocols, we cannot assure you that these measures will be sufficient to mitigate all of these exposures.
We are also subject to the risk that our successful third party program managers will not renew their programs with us. Although our contracts are generally not for defined terms, generally, either party can cancel the contract in a relatively short period of time. While we believe our arrangements offer numerous benefits to our program participants, we cannot assure you we will retain the programs that produce profitable business or that our insureds will renew with us. Failure to retain or replace the third party program managers, or the program managers failure to retain or replace their producers, would impair our ability to execute our growth strategy, and our financial results could be adversely affected.
With respect to our Reinsurance operations we do not separately evaluate each of the individual risks assumed under our reinsurance contracts and, accordingly, like other reinsurers, are heavily dependent on the original underwriting decisions made by our ceding companies. We are therefore subject to the risk that our clients may not have adequately evaluated the risks to be reinsured, or that the premiums ceded to us will not adequately compensate us for the risks we assume, perhaps materially so.
Our claims and claim expense reserves are subject to inherent uncertainties.
Our claims and claim expense reserves reflect our estimates using actuarial and statistical projections at a given point in time of our expectations of the ultimate settlement and administration costs of claims incurred. Although we use actuarial and computer models as well as historical reinsurance and insurance industry loss statistics, we also rely heavily on managements experience and judgment to assist in the establishment of appropriate claims and claim expense reserves. However, because of the many assumptions and estimates involved in establishing reserves, the reserving process is inherently uncertain. Our estimates and judgments are based on numerous factors, and may be revised as additional experience and other data become available and are reviewed, as new or improved methodologies are developed, as loss trends and claims inflation impact future payments, or as current laws or interpretations thereof change.
Our specialty reinsurance and Individual Risk operations are expected to produce claims which at times can only be resolved through lengthy and unpredictable litigation. The measures required to resolve such claims, including the adjudication process, present more reserve challenges than property losses (which tend to be reported comparatively more promptly and to be settled within a relatively shorter period of time). Actual net claims and claim expenses paid may deviate, perhaps substantially, from the reserve estimates reflected in our financial statements.
We expect that some of our assumptions or estimates will prove to be inaccurate, and that our actual net claims and claim expenses paid will differ, perhaps substantially, from the reserve estimates reflected in our financial statements. To the extent that our actual claims and claim expenses exceed our expectations, we would be required to increase claims and claim expense reserves. This would reduce our net income by a corresponding amount in the period in which the deficiency is identified. To the extent that our actual claims and claim expenses are lower than our expectations, we would be required to decrease claims and claim expense reserves and this would increase our net income.
Estimates of losses are based on a review of potentially exposed contracts, information reported by and discussions with counterparties, and our estimate of losses related to those contracts and are subject to change as more information is reported and becomes available.
As an example, included in our results for 2008 are $468.0 million of net claims and claim expenses arising from hurricanes Gustav and Ike which struck the United States in the third quarter of 2008. Our estimates of losses from catastrophic events, such as hurricanes Gustav and Ike, and the 2005 hurricanes Katrina, Rita and Wilma, are based on factors including currently available information derived from the Companys
40
Table of Contents
preliminary claims information from certain clients and brokers, industry assessments of losses from the events, proprietary models, and the terms and conditions of our contracts. Due to the size and unusual complexity of the legal and claims issues relating to these events, particularly hurricanes Katrina and Ike, meaningful uncertainty remains regarding total covered losses for the insurance industry and, accordingly, several of the key assumptions underlying our loss estimates. In addition, actual losses from these events may increase if our reinsurers or other obligors fail to meet their obligations to us. Our actual losses from these events will likely vary, perhaps materially, from these current estimates due to the inherent uncertainties in reserving for such losses, including the nature of the available information, the potential inaccuracies and inadequacies in the data provided by clients and brokers, the inherent uncertainty of modeling techniques and the application of such techniques, the effects of any demand surge on claims activity and complex coverage and other legal issues.
Unlike the loss reserves of U.S. insurers, the loss reserves of our Bermuda-licensed insurers, including Renaissance Reinsurance, DaVinci and Glencoe, are not regularly examined by insurance regulators, although, as registered Bermuda insurers, we are required to submit opinions of our approved loss reserve specialist with the annual statutory financial returns of our Bermuda-licensed insurers with regard to their respective loss and loss expenses provisions. The loss reserve specialist, who will normally be a qualified actuary, must be approved by the BMA.
The emergence of matters which may impact certain of our coverages, such as the asserted trend toward potentially significant global warming and the ongoing financial crisis, could cause us to underestimate our exposures and potentially adversely impact our financial results, perhaps significantly.
In our Reinsurance business, we use analytic and modeling capabilities that help us to assess the risk and return of each reinsurance contract in relation to our overall portfolio of reinsurance contracts. For catastrophe-exposed business in our Individual Risk segment, we also seek to utilize proprietary modeling tools that have been developed in conjunction with the modeling and other resources utilized in our Reinsurance operations. See Item 1. Business Underwriting and Enterprise Risk Management.
In general, our techniques for evaluating catastrophe risk are much better developed than those for other classes of risk in businesses that we have entered into recently or may enter into in the future. Our models and databases may not accurately address the emergence of a variety of matters which might be deemed to impact certain of our coverages. Accordingly, our models may understate the exposures we are assuming and our financial results may be adversely impacted, perhaps significantly.
We believe, and recent scientific studies have indicated, that climate conditions, primarily global temperatures, may be increasing, which may in the future increase the frequency and severity of natural catastrophes relative to the historical experience over the past 100 years as well as the losses resulting there from. We continuously monitor and adjust, as we believe appropriate, our risk management models to reflect our judgment of how to interpret current developments and information, such as these studies. However, it is possible that, even after these adjustments, we have underestimated the frequency or severity of hurricanes or other catastrophes.
Changing weather patterns and climatic conditions, such as global warming, may have added to the unpredictability and frequency of natural disasters in some parts of the world and created additional uncertainty as to future trends and exposures.
Our specialty reinsurance portfolio is also exposed to emerging risks arising from the ongoing financial crisis, including with respect to a potential increase of claims in D&O, E&O, mortgage valuation, surety, casualty clash and other lines of business.
A sustained weakness or weakening in business and economic conditions generally or specifically in the principal markets in which we do business could adversely affect our business and operating results.
The United States and other markets around the world have been experiencing deteriorating economic conditions, including substantial and continuing financial market disruptions. Continued adverse development in economic conditions could adversely affect the business environment in our principal markets, and accordingly could adversely affect demand for the products sold by us or our clients. In addition, during an economic downturn, our consolidated credit risk, reflecting our counterparty dealings
41
Table of Contents
with agents, brokers, customers, retrocessionaires, capital providers, parties associated with our investment portfolio, and others, would likely be increased, due to the increase in the number of counterparties who become delinquent, file for protection under bankruptcy laws, or default on their obligations to us. Moreover, our markets may experience increased inflationary conditions which could cause loss costs to increase.
Deterioration in the investment markets and economic conditions could lead to additional investment losses.
Ongoing conditions in the investment markets, the current interest rate environment and general economic conditions have and could continue to adversely affect our net investment income on our fixed income investments and our other invested assets. For the year ended December 31, 2008, we incurred significant realized and unrealized investment losses, as described in Item 7. Managements Discussion and Analysis of Financial Condition and Results of Operations Investments. Subsequent to year end, through the date of this report, economic conditions have continued to decline. In addition to impacting our reported net loss, potential future losses on our investment portfolio, including potential future mark-to-market results, would adversely impact our equity capital. Net investment income is an important contributor to the Companys results of operations, and we currently expect the investment environment to remain challenging for some time. We expect volatile financial markets and challenging economic conditions to persist for some time and we are unable to predict at what time conditions might improve, or the pace or scale of any such improvement. Depending on market conditions, we could incur additional realized and unrealized losses in future periods, which could have a material adverse effect on the Companys results of operations, financial condition and business.
Some of our investments are relatively illiquid and are in asset classes that have been experiencing significant market valuation fluctuations.
Although we invest primarily in highly liquid securities in order to ensure our ability to pay valid claims in a prompt manner, we do hold certain investments that may lack liquidity, such as our alternative investments. If we require significant amounts of cash on short notice in excess of our normal cash requirements or are required to post or return collateral in connection with our investment portfolio, we may have difficulty selling these investments in a timely manner, be forced to sell them for less than we otherwise would have been able to realize, or both.
At times, the reported value of our liquid and relatively illiquid types of investments and, our high quality, generally liquid asset classes, do not necessarily reflect the lowest current market price for the asset. If we were forced to sell certain of our assets in the current market, there can be no assurance that we will be able to sell them for the prices at which we have recorded them and we may be forced to sell them at significantly lower prices.
The reduction in market liquidity has also made it difficult to value certain of our securities as trading has become less frequent. As such, valuations may include assumptions or estimates that may be more susceptible to significant period-to-period changes which could have a material adverse effect on our consolidated results of operations or financial condition.
The determination of the impairments taken on our investments is highly subjective and could materially impact our financial position or results of operations.
The determination of the impairments taken on our investments vary by investment type and is based upon our periodic evaluation and assessment of known and inherent risks associated with the respective asset class. Such evaluations and assessments are revised as conditions change and new information becomes available. Management updates its evaluations regularly and reflects impairments in operations as such evaluations are revised. There can be no assurance that our management has accurately assessed the level of impairments taken in our financial statements. Furthermore, additional impairments may need to be taken in the future, which could materially impact our financial position or results of operations. Historical trends may not be indicative of future impairments.
42
Table of Contents
We are unable to predict the effect that governmental actions for the purpose of stabilizing the financial markets will have on such markets generally or on the Company in particular.
In response to the financial crises affecting the banking system and financial markets and going concern threats to investment banks and other financial institutions, on October 3, 2008, then-President Bush signed the EESA into law. Pursuant to the EESA, the U.S. Treasury has the authority to, among other things, purchase up to $700 billion of mortgage-backed and other securities from financial institutions for the purpose of stabilizing the financial markets. Subsequently, on February 17, 2009, President Obama signed into law the American Recovery and Reinvestment Act of 2009 (the ARRA), a $787 billion stimulus bill for the purpose of stabilizing the economy by, among other things, creating jobs. The U.S. Federal Government and other governmental and regulatory bodies have taken or are considering taking other actions to address the financial crisis. It is possible that competitors of the Company, such as companies that engage in both life and property casualty insurance lines of business, may participate in some or all of the ARRA programs. We are unable to predict the effect that any such governmental actions will have on the financial markets generally or on the Companys competitive position, business and financial condition in particular, though we are carefully monitoring the situation as it evolves.
A decline in our investment performance could reduce our profitability and hinder our ability to pay claims promptly in accordance with our strategy.
We have historically derived a significant portion of our income from our invested assets, which are comprised of, among other things, fixed maturity securities, such as bonds, asset-backed securities, mortgage-backed securities and investments in bank loan funds, hedge funds and private equity partnerships. Accordingly, our financial results are subject to a variety of investment risks, including risks relating to general economic conditions, market volatility, interest rate fluctuations, foreign currency risk, liquidity risk and credit and default risk. Additionally, with respect to certain of our investments, we are subject to pre-payment or reinvestment risk.
Our invested assets have grown over the years and have come to effect a comparably greater contribution to our financial results. Accordingly, a failure to successfully execute our investment strategy could have a material adverse effect on our overall results. In the event of a significant or total loss in our investment portfolio, the Companys ability to pay any claims promptly in accordance with our strategy could be adversely affected.
The market value of our fixed maturity investments is subject to fluctuation depending on changes in various factors, including prevailing interest rates and widening credit spreads.
Increases in interest rates could cause the market value of our investment portfolio to decrease, perhaps substantially. Conversely, a decline in interest rates could reduce our investment yield, which would reduce our overall profitability. Interest rates are highly sensitive to many factors, including governmental monetary policies, domestic and international economic and political conditions and other factors beyond our control. Any measures we take that are intended to manage the risks of operating in a changing interest rate environment may not effectively mitigate such interest rate sensitivity.
A portion of our investment portfolio is allocated to other investments which we expect to have different risk characteristics than our investments in traditional fixed maturity securities and short term investments. These other investments include private equity partnerships, hedge fund investments, senior secured bank loan funds and catastrophe bonds and are recorded on our consolidated balance sheet at fair value. The fair value of certain of these investments is generally established on the basis of the net valuation criteria established by the managers of such investments. These net valuations are determined based upon the valuation criteria established by the governing documents of the investments. Such valuations may differ significantly from the values that would have been used had ready markets existed for the shares, partnership interests or notes of the investments. Many of the investments are subject to restrictions on redemptions and sales which are determined by the governing documents and limit our ability to liquidate these investments in the short term. These investments expose us to market risks including interest rate risk, foreign currency risk, equity price risk and credit risk. In addition, we typically do not hold the underlying securities of these investments in our custody accounts, as a result, we generally do not have the ability to quantify the risks associated with these investments in the same manner for which we have for
43
Table of Contents
our fixed maturity securities. The performance of these investments is also dependent on the individual investment managers and the investment strategies. It is possible that the investment managers will leave and/or the investment strategies will become ineffective or that such managers will fail to follow our investment guidelines. Any of the foregoing could result in a material adverse change to our investment performance, and accordingly adversely affect our financial results.
We are exposed to counterparty credit risk, including with respect to reinsurance brokers.
In accordance with industry practice, we pay virtually all amounts owed on claims under our policies to reinsurance brokers, and these brokers, in turn, pay these amounts over to the insurers that have reinsured a portion of their liabilities with us (we refer to these insurers as ceding insurers). Likewise, premiums due to us by ceding insurers are virtually all paid to brokers, who then pass such amounts on to us. In many jurisdictions, if a broker were to fail to make such a payment to a ceding insurer, we would remain liable to the ceding insurer for the deficiency. Conversely, in many jurisdictions, when the ceding insurer pays premiums for these policies to reinsurance brokers for payment over to us, these premiums are considered to have been paid by the cedants and the ceding insurer will no longer be liable to us for those amounts, whether or not we have actually received the premiums. Consequently, in connection with the settlement of reinsurance balances, we assume a substantial degree of credit risk associated with brokers around the world.
We are also exposed to the credit risk of our clients, who, pursuant to their contracts with us, frequently pay us over time. Our premiums receivable at December 31, 2008 totaled $565.6 million, and these amounts are generally not collateralized. To the extent such clients become unable to pay future premiums, we would be required to recognize a downward adjustment to our premiums receivable in our financial statements.
As a result of the global economic downturn, our consolidated credit risk, reflecting our counterparty dealings with agents, brokers, customers, retrocessionaires, capital providers, parties associated with our investment portfolio and others has increased, perhaps materially so.
Retrocessional reinsurance may become unavailable on acceptable terms.
As part of our risk management, we buy reinsurance for our own account. This type of insurance when purchased to protect reinsurance companies is known as retrocessional reinsurance. Our primary insurance companies also buy reinsurance from third parties.
From time to time, market conditions (including the ongoing financial crisis) have limited, and in some cases have prevented, insurers and reinsurers from obtaining reinsurance. Accordingly, we may not be able to obtain our desired amounts of retrocessional reinsurance. In addition, even if we are able to obtain such retrocessional reinsurance, we may not be able to negotiate terms as favorable to us as in the past. This could limit the amount of business we are willing to write, or decrease the protection available to us as a result of large loss events.
When we purchase reinsurance or retrocessional reinsurance for our own account, the insolvency, inability or reluctance of any of our reinsurers to make timely payments to us under the terms of our reinsurance agreements could have a material adverse effect on us. Generally, we believe that the willingness to pay of some reinsurers and retrocessionaires is declining, and that the overall industry ability to pay has also declined due to the ongoing financial crisis and other factors. This risk may be more significant to us at present than at most times in the past. At December 31, 2008, we had recorded $299.5 million of reinsurance recoverables, net of a valuation allowance of $8.7 million for uncollectible recoverables. A large portion of our reinsurance recoverables are concentrated with a relatively small number of reinsurers. The risk of such concentration of retrocessional coverage may be increased by recent and future consolidation within the industry.
Emerging claim and coverage issues, or other litigation, could adversely affect us.
Unanticipated developments in the law as well as changes in social and environmental conditions could potentially result in unexpected claims for coverage under our insurance and reinsurance contracts. These developments and changes may adversely affect us, perhaps materially so. For example, we could be subject to developments that impose additional coverage obligations on us beyond our underwriting intent,
44
Table of Contents
or to increases in the number or size of claims to which we are subject. With respect to our specialty reinsurance and Individual Risk operations, these legal, social and environmental changes may not become apparent until some point in time after their occurrence. For example, we could be deemed liable for losses arising out of a matter, such as the potential for industry losses arising out of an avian flu pandemic, that we had not anticipated or had attempted to contractually exclude. Moreover, irrespective of the clarity and inclusiveness of policy language, there can be no assurance that a court or arbitration panel will limit enforceability of policy language or not issue a ruling adverse to us. Our exposure to these uncertainties could be exacerbated by the increased willingness of some market participants to dispute insurance and reinsurance contract and policy wordings. Alternatively, potential efforts by us to exclude such exposures could, if successful, reduce the markets acceptance of our related products. The full effects of these and other unforeseen emerging claim and coverage issues are extremely hard to predict. As a result, the full extent of our liability under our coverages may not be known for many years after a contract is issued. Our exposure to this uncertainty will grow as our long-tail casualty businesses grow, because in these lines claims can typically be made for many years, making them more susceptible to these trends than our traditional catastrophe business, which is typically more short-tail. In addition, we could be adversely affected by the growing trend of plaintiffs targeting participants in the property-liability insurance industry in purported class action litigation relating to claim handling and other practices. Although we are seeking to add professional staff and systems to improve our contracts and claims capabilities, we may fail to mitigate our exposure to these growing uncertainties.
The loss of key senior members of management could adversely affect us.
Our success has depended, and will continue to depend, in substantial part upon our ability to attract and retain our executive officers. The loss of services of members of senior management in the future, and the uncertain transition of new members of our senior management team, may strain our ability to execute our growth initiatives. The loss of one or more of our executive officers could adversely impact our business, by, for example, making it more difficult to retain clients or other business contacts whose relationship depends in part on the service of the departing executives. In general, the loss of the services of any members of our current senior management team may adversely affect our business, perhaps materially so. We do not currently maintain key man life insurance policies with respect to any of our employees.
In addition, our ability to execute our business strategy is dependent on our ability to attract and retain a staff of qualified underwriters and service personnel. The location of our global headquarters in Bermuda may impede our ability to recruit and retain highly skilled employees. Under Bermuda law, non-Bermudians (other than spouses of Bermudians, holders of Permanent Residents Certificates and holders of Working Residents Certificates) may not engage in any gainful occupation in Bermuda without a valid government work permit. Substantially all of our officers are working in Bermuda under work permits that will expire over the next three years. The Bermuda government could refuse to extend these work permits, which would adversely impact us. In addition, a Bermuda government policy limits the duration of work permits to a total of six years, which is subject to certain exemptions only for key employees. A work permit is issued with an expiry date (up to five years) and no assurances can be given that any work permit will be issued or, if issued, renewed upon the expiration of the relevant term. If any of our senior executive officers were not permitted to remain in Bermuda, our operations could be disrupted and our financial performance could be adversely affected as a result.
U.S. taxing authorities could contend that one or more of our Bermuda subsidiaries are subject to U.S. corporate income tax, as a result of changes in law or regulations, or otherwise.
If the U.S. Internal Revenue Service (the IRS) were to contend successfully that one or more of our Bermuda subsidiaries is engaged in a trade or business in the U.S., such subsidiary would, to the extent not exempted from tax by the U.S.-Bermuda income tax treaty, be subject to U.S. corporate income tax on that portion of its net income treated as effectively connected with a U.S. trade or business, as well as the U.S. corporate branch profits tax. Although we would vigorously resist such a contention, if we were ultimately held to be subject to taxation, our earnings would correspondingly decline.
45
Table of Contents
In addition, benefits of the U.S.-Bermuda income tax treaty which may limit any such tax to income attributable to a permanent establishment maintained by one or more of our Bermuda subsidiaries in the U.S. are only available to any of such subsidiaries if more than 50% of its shares are beneficially owned, directly or indirectly, by individuals who are Bermuda residents or U.S. citizens or residents. Our Bermuda subsidiaries may not be able to continually satisfy such beneficial ownership test or be able to establish it to the satisfaction of the IRS. Finally, it is unclear whether the income tax treaty (assuming satisfaction of the beneficial ownership test) applies to income other than premium income, such as investment income.
Congress has recently conducted hearings relating to the tax treatment of offshore insurance and is reported to be considering legislation that would adversely affect reinsurance between affiliates and offshore insurance and reinsurance more generally. On September 18, 2008, U.S. Rep. Richard Neal introduced one such proposal, H.R. 6969, a bill which provides that foreign insurers and reinsurers would be capped in deducting reinsurance premiums ceded from U.S. units to offshore affiliates. The bill, which has been referred to the House Ways and Means Committee, would limit deductions for related party reinsurance cessions to the average percentage of premium ceded to unrelated reinsurers (determined in reference to individual business lines). Other proposals relating to cross-border transactions, intangible products, or non-U.S. jurisdictions generally have been introduced in a number of Congressional committees. Enactment of such legislation, depending on the specific details, could adversely affect our financial results.
Regulatory challenges in the U.S. or elsewhere to our Bermuda operations claims of exemption from insurance regulation could restrict our ability to operate, increase our costs, or otherwise adversely impact us.
Renaissance Reinsurance, DaVinci and Top Layer Re are not licensed or admitted in any jurisdiction except Bermuda. Renaissance Reinsurance, Glencoe, DaVinci and Top Layer Re each conduct business only from their principal offices in Bermuda and do not maintain an office in the U.S. The insurance and reinsurance regulatory framework continues to be subject to increased scrutiny in many jurisdictions, including the U.S. and various states within the U.S. If our Bermuda insurance or reinsurance operations become subject to the insurance laws of any state in the U.S., we could face inquiries or challenges to the future operations of these companies.
Moreover, we could be put at a competitive disadvantage in the future with respect to competitors that are licensed and admitted in U.S. jurisdictions. Among other things, jurisdictions in the U.S. do not permit insurance companies to take credit for reinsurance obtained from unlicensed or non-admitted insurers on their statutory financial statements unless security is posted. Our contracts generally require us to post a letter of credit or provide other security after a reinsured reports a claim. In order to post these letters of credit, issuing banks generally require collateral. It is possible that the European Union or other countries might adopt a similar regime in the future, or that U.S. rules could be altered in a way that treats Bermuda-based companies disproportionately. Any such development, or if we are unable to post security in the form of letters of credit or trust funds when required, could significantly and negatively affect our operations.
Glencoe and Lantana are currently eligible, non-admitted excess and surplus lines insurers in, respectively, 51 and 49 states and territories of the U.S. and are each subject to certain regulatory and reporting requirements of these states. However, neither Glencoe nor Lantana is admitted or licensed in any U.S. jurisdiction; moreover, Glencoe only conducts business from Bermuda. Accordingly, the scope of Glencoes and Lantanas activities in the U.S. is limited, which could adversely affect their ability to compete. Although surplus lines business is generally less regulated than the admitted market, the regulation of surplus lines insurance may undergo changes in the future. Federal and/or state measures may be introduced and promulgated that could result in increased oversight and regulation of surplus lines insurance. Additionally, some recent and pending cases in Florida and California courts have raised potentially significant questions regarding surplus lines insurance in those states such as whether surplus lines insurers will be subject to policy form content, filing and approval requirements or additional taxes. These cases also could foreshadow more extensive oversight of surplus lines insurance by other jurisdictions.
Stonington, which writes insurance in all 50 states and the District of Columbia on an admitted basis, is subject to extensive regulation under state statutes which confer regulatory, supervisory and administrative powers on state insurance commissioners. Such regulation generally is designed to protect policyholders rather than investors or shareholders of the insurer.
46
Table of Contents
Our current or future business strategy could cause one or more of our currently unregulated non-insurance subsidiaries to become subject to some form of regulation. Any failure to comply with applicable laws could result in the imposition of significant restrictions on our ability to do business, and could also result in fines and other sanctions, any or all of which could adversely affect our financial results and operations.
We could be required to allocate considerable time and resources to comply with any new or additional regulatory requirements, and any such requirements may impact the operations of our insurance non-insurance subsidiaries and ultimately could impact our financial condition as well. In addition, we could be adversely affected if a regulatory authority believed we had failed to comply with applicable law or regulation.
Operational risks, including systems or human failures, are inherent in business, including ours.
We are subject to operational risks including fraud, employee errors, failure to document transactions properly or to obtain proper internal authorization, failure to comply with regulatory requirements or obligations under our agreements, information technology failures, or external events. Losses from these risks may occur from time to time and may be significant. As our business and operations grow more complex we are exposed to more risk in these areas.
Our modeling, underwriting and information technology and application systems are critical to our success. Moreover, our proprietary technology and application systems have been an important part of our underwriting strategy and our ability to compete successfully. We have also licensed certain systems and data from third parties. We cannot be certain that we will have access to these, or comparable, service providers, or that our information technology or application systems will continue to operate as intended. While we have implemented disaster recovery and other business contingency plans, a defect or failure in our internal controls or information technology and application systems could result in reduced or delayed revenue growth, higher than expected losses, management distraction, or harm to our reputation. We believe appropriate controls and mitigation procedures are in place to prevent significant risk of defect in our internal controls, information technology and application systems, but internal controls provide only reasonable, not absolute, assurance as to the absence of errors or irregularities and any ineffectiveness of such controls and procedures could have a material adverse effect on our business.
We may be adversely affected by foreign currency fluctuations.
Our functional currency is the U.S. dollar; however, as we expand geographically, an increasing portion of our premium is, and likely will be, written in currencies other than the U.S. dollar and a portion of our claims and claim expense reserves is also in non-dollar currencies. Moreover, we maintain a portion of our cash and investments in currencies other than the U.S. dollar. Although we generally seek to hedge significant non-U.S. dollar positions, we may, from time to time, experience losses resulting solely from fluctuations in the values of these foreign currencies, which could cause our consolidated earnings to decrease. In addition, failure to manage our foreign currency exposures could cause our results of operations to be more volatile.
We may require additional capital in the future, which may not be available or only available on unfavorable terms.
We monitor our capital adequacy on a regular basis. The capital requirements of our business depend on many factors, including our ability to write new business successfully and to establish premium rates and reserves at levels sufficient to cover losses. Our ability to sell our reinsurance and insurance products is largely dependent upon the quality of our claims paying and financial strength ratings as evaluated by independent rating agencies. To the extent that our existing capital is insufficient to support our future operating requirements, we may need to raise additional funds through financings or limit our growth. Any further equity or debt financing, or capacity needed for letters of credit, if available at all, may be on terms that are unfavorable to us, particularly in light of the recent disruptions, uncertainty and volatility in the capital and credit markets. Our ability to raise such capital successfully would depend upon the facts and circumstances at the time, including our financial position and operating results, market conditions, and
47
Table of Contents
applicable legal issues. Access to capital on attractive terms has been challenging for many companies during the ongoing global credit crisis. If we are unable to obtain adequate capital if and when needed, our business, results of operations and financial condition would be adversely affected.
In August 2009 the term of our $500 million committed revolving credit facility will expire. We may not succeed in renewing this facility on terms attractive to us or at all. Our ability to renew or replace this credit facility is subject to many factors beyond our control, such as more stringent credit criteria and/or conditions emanating from or as a result of the currently difficult conditions in the global capital and credit markets, the effect of which may be to make a renewal or replacement so onerous as to make us consider alternate sources of such liquidity or limit our ability to write business for our clients.
The covenants in our debt agreements limit our financial and operational flexibility, which could have an adverse effect on our financial condition.
We have incurred indebtedness, and may incur additional indebtedness in the future. At December 31, 2008, we had an aggregate of $450.0 million of indebtedness outstanding. Our indebtedness primarily consists of publicly traded notes and letter of credit and revolving credit facilities. For more details on our indebtedness, see Item 7. Managements Discussion and Analysis of Financial Condition and Results of Operations Capital Resources.
The agreements covering our indebtedness, particularly our bank loans, contain covenants that limit our ability, among other things, to borrow money, make particular types of investments or other restricted payments, sell assets, merge or consolidate. These agreements also require us to maintain specific financial ratios. If we fail to comply with these covenants or meet these financial ratios, the lenders under our credit facilities could declare a default and demand immediate repayment of all amounts owed to them, cancel their commitments to lend or issue letters of credit, or both, and require us to pledge additional or a different type of collateral.
Because we are a holding company, we are dependent on dividends and payments from our subsidiaries.
As a holding company with no direct operations, we rely on investment income, cash dividends and other permitted payments from our subsidiaries to make principal and interest payments on our debt and to pay dividends to our shareholders. The holding company does not have any operations and from time to time may not have significant liquid assets. Bermuda law and various U.S. insurance regulations may limit the ability of our subsidiaries to pay dividends. If our subsidiaries are restricted from paying dividends to us, we may be unable to pay dividends or to repay our indebtedness. For example, since our U.S. insurance subsidiaries may only pay dividends out of earned surplus, and as these subsidiaries earned surplus is negative, they cannot currently pay dividends without the applicable state insurance department approval. For a more detailed discussion of these regulations, see Item 1. Business Regulation.
Acquisitions or strategic investments that we made or may make could turn out to be unsuccessful.
As part of our strategy, we frequently monitor and analyze opportunities to acquire or make a strategic investment in new or other businesses that will not detract from our core Reinsurance and Individual Risk operations. The negotiation of potential acquisitions or strategic investments as well as the integration of an acquired business or new personnel could result in a substantial diversion of management resources. Acquisitions could involve numerous additional risks such as potential losses from unanticipated litigation or levels of claims and inability to generate sufficient revenue to offset acquisition costs. Any failure by us to effectively limit such risks or implement our acquisitions or strategic investment strategies could have a material adverse effect on our business, financial condition or results of operations.
Results in certain of our newer or potentially expanding business lines could cause significant volatility in our consolidated financial statements.
As we continue to grow and diversify our operations, certain of our new or potentially expanding business lines could have a significant negative impact on our financial results or cause significant volatility in our results for any fiscal quarter or year. For example, we may experience losses or experience significant volatility in our financial results with respect to our multi-peril crop business as a result of volatility in
48
Table of Contents
commodity prices and weather events, such as flooding, drought, hail, windstorms and other natural phenomena, all of which impacts the profitability of this line of business. In addition, our weather and energy products and trading business is accounted for at fair value and the value of our positions can change significantly which could have a significant negative impact on our financial results, or cause significant volatility in our result for any fiscal quarter or year.
We could be adversely impacted by a failure to comply with the terms of the Companys settlement agreement with the SEC.
On March 20, 2007, the United States District Court for the Southern District of New York signed the final judgment approving our settlement with the SEC arising from the restatement of our financial statements for the fiscal years ended December 31, 2003, 2002 and 2001. In accordance with the terms of the settlement agreement, we previously retained an independent consultant to review certain of our internal controls, policies and procedures as well as the design and implementation of the review conducted by independent counsel reporting to the non-executive members of our Board of Directors and certain additional procedures performed by our auditors in connection with their audit of our financial statements for the fiscal year ended December 31, 2004. While we will strive to fully comply with the settlement agreement with the SEC, it is possible that the enforcement staff of the SEC and/or the independent consultant may take issue with our cooperation despite our efforts. Any such failure to comply with the settlement agreement or any such perception that we have failed to comply, could adversely affect us, perhaps materially so.
Some aspects of our corporate structure may discourage third party takeovers and other transactions or prevent the removal of our current board of directors and management.
Some provisions of our Amended and Restated Bye-Laws have the effect of making more difficult or discouraging unsolicited takeover bids from third parties or preventing the removal of our current board of directors and management. In particular, our Bye-Laws prohibit transfers of our capital shares if the transfer would result in a person owning or controlling shares that constitute 9.9% or more of any class or series of our shares. In addition, our Byelaws reduce the total voting power of any shareholder owning, directly or indirectly, beneficially or otherwise, as described in our Bye-laws, more than 9.9% of our common shares to not more than 9.9% of the total voting power of our capital stock unless otherwise waived at the discretion of the Board. The primary purpose of these provisions is to reduce the likelihood that we will be deemed a controlled foreign corporation within the meaning of the Internal Revenue Code for U.S. federal tax purposes. However, these provisions may also have the effect of deterring purchases of large blocks of common shares or proposals to acquire us, even if some or a majority of our shareholders might deem these purchases or acquisition proposals to be in their best interests.
In addition, our Bye-Laws provide for, among other things:
| |
a classified Board, whose size is fixed and whose members may be removed by the shareholders only for cause upon a 66 2/3% vote; |
| | restrictions on the ability of shareholders to nominate persons to serve as directors, submit resolutions to a shareholder vote and requisition special general meetings; |
| | a large number of authorized but unissued shares which may be issued by the Board without further shareholder action; and |
| |
a 66 2/3% shareholder vote to amend, repeal or adopt any provision inconsistent with several provisions of the Bye-Laws. |
These Bye-Law provisions make it more difficult to acquire control of us by means of a tender offer, open market purchase, proxy contest or otherwise. These provisions are designed to encourage persons seeking to acquire control of us to negotiate with our directors, which we believe would generally best serve the interests of our shareholders. However, these provisions could have the effect of discouraging a prospective acquirer from making a tender offer or otherwise attempting to obtain control of us. In addition, these Bye-Law provisions could prevent the removal of our current board of directors and management. To the extent these provisions discourage takeover attempts, they could deprive shareholders of opportunities to realize takeover premiums for their shares or could depress the market price of the shares.
49
Table of Contents
We indirectly own certain U.S. based insurance subsidiaries. Our ownership of a U.S. insurance company can, under applicable state insurance company laws and regulations, delay or impede a change of control of RenaissanceRe. It is possible that we will form, acquire or invest in other U.S. domestic insurance companies in the future, which could make this risk more severe. Under applicable state insurance regulations, any proposed purchase of 10% or more of our voting securities would require the prior approval of the relevant insurance regulatory authorities.
Investors may have difficulties in serving process or enforcing judgments against us in the U.S.
We are a Bermuda company. In addition, certain of our officers and directors reside in countries outside the U.S. All or a substantial portion of our assets and the assets of these officers and directors are or may be located outside the U.S. Investors may have difficulty effecting service of process within the U.S. on our directors and officers who reside outside the U.S. or recovering against us or these directors and officers on judgments of U.S. courts based on civil liabilities provisions of the U.S. federal securities laws whether or not we appoint an agent in the U.S. to receive service of process.
RISKS RELATED TO OUR INDUSTRY
The reinsurance business is historically cyclical and the pricing and terms for our products may decline, which could affect our profitability.
The reinsurance and insurance industries have historically been cyclical, characterized by periods of decreasing prices followed by periods of increasing prices. Reinsurers have experienced significant fluctuations in their results of operations due to numerous factors, including the frequency and severity of catastrophic events, perceptions of risk, levels of capacity, general economic conditions and underwriting results of other insurers and reinsurers. All of these factors fluctuate and may contribute to price declines generally in the reinsurance and insurance industries. For example, an increase in capital in our industry after the 2005 catastrophe events, and the Florida legislation, described below, helped create a softening market where pricing decreased in certain lines and became less attractive in the past few years.
The catastrophe-exposed lines in which we are a market leader are affected significantly by volatile and unpredictable developments, including natural and man-made disasters. The occurrence, or nonoccurrence, of catastrophic events, the frequency and severity of which are inherently unpredictable, affects both industry results and consequently prevailing market prices of our products.
We expect premium rates and other terms and conditions of trade to vary in the future. If demand for our products falls or the supply of competing capacity rises, our growth and our profitability could, due in part to our disciplined approach to underwriting, be adversely affected. In particular, we might lose existing customers or decline business, which we might not regain when industry conditions improve.
In recent years, hedge funds and investment banks have been increasingly active in the reinsurance market and markets for related risks. While this trend has slowed during the current financial dislocation, we generally expect increased competition from a wider range of entrants over time. It is possible that such new or alternative capital could cause reductions in prices of our products. To the extent that industry pricing of our products does not meet our hurdle rate, we would generally expect to reduce our future underwriting activities thus resulting in reduced premiums and a reduction in expected earnings.
Recent or future legislation may decrease the demand for our property catastrophe reinsurance products and adversely affect our business and results of operations.
In January 2007, the State of Florida enacted legislation known as Bill No. CS/HB-1A (the Bill), which increased the access of primary Florida insurers to the FHCF. Through the FHCF, the State of Florida currently provides below market rate reinsurance of up to $28.0 billion per season, an increase from the previous cap of $16.0 billion, with the State able to further increase the limits up to an additional $4.0 billion per season. In addition, the legislation allows Florida insurers to choose a lower retention level for FHCF reinsurance coverage, at specified rates for specified layers of coverage. Further, the legislation expanded the ability of Citizens, a state-sponsored entity, to compete with private insurance and reinsurance companies, such as ours, by, for example, authorizing Citizens to write multi-peril policies in
50
Table of Contents
high-risk account coverage areas. Moreover, the legislation mandated the reduction of Citizens in force rates by an average of 23%, repealed a 56% rate increase that was to be effective March 1, 2007, and froze any additional rate increases for the remainder of 2007. Also, Citizens premium rates are no longer required to be non-competitive with the voluntary, private market and are no longer required to be based on the highest rate offered by the top 20 insurers in a given area. In sum, the legislation reduced the role of the private markets in providing support for Florida-based risks, a market in which we have established substantial market share. Efforts in 2008 to reduce the scale of the 2008 state involvement in the private markets were not successful.
While we have sought and intend to continue to seek to utilize our strong relationships, record of superior service and financial strength to mitigate the impact of the legislation, we believe the Bill caused a substantial decline in the private reinsurance and insurance markets in and relating to Florida, and contributed to the decline in our property catastrophe gross premiums written in 2008 and 2007 as compared to 2006. Because of our position as one of the largest providers of catastrophe-exposed coverage, both on a global basis and in respect of the Florida market, the Bill may have had a disproportionate adverse impact on us compared to other market participants. Proposals to reduce the expansion of the FHCF introduced in 2008 never materialized and there can be no assurance that additional legislation reducing the size of the private markets relating to Florida will not be enacted.
It is also possible that other states, particularly those with Atlantic or Gulf Coast exposures, may enact new or expanded legislation based on the Florida precedent, or may otherwise enact legislation, which would further diminish aggregate private market demand for our products. Alternatively, legislation adversely impacting the private markets could be enacted on a regional or at the federal level. Moreover, we believe that numerous modeled potential catastrophes could exceed the actual or politically acceptable bonded capacity of the FHCF, which could lead either to a severe dislocation or the necessity of Federal intervention in the Florida market, either of which would adversely impact the private insurance and reinsurance industry.
Other political, regulatory and industry initiatives could adversely affect our business.
The insurance and reinsurance regulatory framework is subject to heavy scrutiny by the U.S. and individual state governments as well as an increasing number of international authorities. Government regulators are generally concerned with the protection of policyholders to the exclusion of other constituencies, including shareholders. Governmental authorities in both the U.S. and worldwide seem increasingly interested in the potential risks posed by the reinsurance industry as a whole, and to commercial and financial systems in general. While we do not believe these inquiries have identified meaningful new risks posed by the reinsurance industry, and we cannot predict the exact nature, timing or scope of possible governmental initiatives, we believe it is likely there will be increased regulatory intervention in our industry in the future. For example, the U.S. federal government has increased its scrutiny of the insurance regulatory framework in recent years, and some state legislators have considered or enacted laws that will alter and likely increase state regulation of insurance and reinsurance companies and holding companies. Moreover, the NAIC, which is an association of the insurance commissioners of all 50 states and the District of Columbia and state insurance regulators, regularly reexamine existing laws and regulations.
For example, we could be adversely affected by proposals to:
| | provide insurance and reinsurance capacity in markets and to consumers that we target, such as the legislation enacted in Florida in early 2007 described above; |
| | require our participation in industry pools and guaranty associations; |
| | expand the scope of coverage under existing policies for matters such as hurricanes Katrina, Rita and Wilma, and the New Orleans flood, or such as a pandemic flu outbreak; |
| | increasingly mandate the terms of insurance and reinsurance policies; |
| | establish a new federal insurance regulator or financial industry systemic risk regulator; |
| | revise laws or regulations under which we operate, such as the 2008 Farm Bill; or |
| | disproportionately benefit the companies of one country over those of another. |
51
Table of Contents
The growth of our primary insurance business, which is regulated more comprehensively than reinsurance, increases our exposure to adverse political, judicial and legal developments.
We are incorporated in Bermuda and are therefore subject to changes in Bermuda law and regulation that may have an adverse impact on our operations, including imposition of tax liability or increased regulatory supervision or change in regulation. In addition, we are subject to changes in the political environment in Bermuda, which could make it difficult to operate in, or attract talent to, Bermuda. The Bermuda insurance and reinsurance regulatory framework recently has become subject to increased scrutiny in many jurisdictions, including in the United States and in various states within the United States. We are unable to predict the future impact on our operations of changes in the laws and regulations to which we are or may become subject. Moreover, our exposure to potential regulatory initiatives could be heightened by the fact that our principal operating companies are domiciled in, and operate exclusively from, Bermuda. For example, Bermuda, a small jurisdiction, may be disadvantaged in participating in global or cross border regulatory matters as compared with larger jurisdictions such as the U.S. or the leading European Union countries. In addition, Bermuda, which is currently an overseas territory of the United Kingdom, may consider changes to its relationship with the United Kingdom in the future. These changes could adversely affect Bermudas position in respect of its regulatory initiatives, which could adversely impact us commercially.
We operate in a highly competitive environment.
The reinsurance industry is highly competitive. We compete, and will continue to compete, with major U.S. and non-U.S. insurers and property catastrophe reinsurers, including other Bermuda-based reinsurers. Many of our competitors have greater financial, marketing and management resources than we do. Historically, periods of increased capacity levels in our industry generally have led to increased competition, and decreased prices for our products.
We believe that our principal competitors in the property catastrophe reinsurance market include other companies active in the Bermuda market, including Ace, Allied World, Arch, Axis, Endurance, Everest Re, IPC, Montpelier Re, Partner Re, Platinum, Transatlantic, Validus, White Mountains and XL. We also compete with certain Lloyds syndicates active in the London market, as well as with a number of other industry participants, such as AIG, Berkshire, Hannover Re, Munich Re Group and Swiss Re. As our business evolves over time, we expect our competitors to change as well. For example, following hurricane Katrina in August 2005, a significant number of new reinsurance companies were formed in Bermuda which have resulted in new competition, which may well continue in subsequent periods. Also, hedge funds and investment banks have shown an interest in entering the reinsurance market, either through the formation of reinsurance companies, or through the use of other financial products, such as catastrophe bonds and other cat-linked securities. In addition, we may not be aware of other companies that may be planning to enter the reinsurance market or of existing companies that may be planning to raise additional capital. We cannot predict what effect any of these developments may have on our businesses.
The markets in which our Individual Risk unit operates are also highly competitive. Primary insurers compete on the basis of factors including distribution channels, product, price, service and financial strength. Many of our primary insurance competitors, especially in jurisdictions in which we have recently expanded, or may expand in the future, are larger and more established than we are and have greater financial resources and consumer recognition. We seek primary insurance pricing that will result in adequate returns on the capital allocated to our primary insurance business. We may lose primary insurance business to competitors offering competitive insurance products at lower prices or on more advantageous terms.
Consolidation in the (re) insurance industry could adversely impact us.
We believe that several (re)insurance industry participants are seeking to consolidate. These consolidated entities may try to use their enhanced market power to negotiate price reductions for our products and services. If competitive pressures reduce our prices, we would expect to write less business. As the insurance industry consolidates, competition for customers will become more intense and the importance of acquiring and properly servicing each customer will become greater. We could incur greater expenses relating to customer acquisition and retention, further reducing our operating margins. In addition, insurance companies that merge may be able to spread their risks across a consolidated, larger capital
52
Table of Contents
base so that they require less reinsurance. The number of companies offering retrocessional reinsurance may decline. Reinsurance intermediaries could also consolidate, potentially adversely impacting our ability to access business and distribute our products. We could also experience more robust competition from larger, better capitalized competitors. Any of the foregoing could adversely affect our business or our results of operation.
The Organization for Economic Cooperation and Development (OECD) and the European Union are considering measures that might increase our taxes and reduce our net income.
The OECD has published reports and launched a global dialogue among member and non-member countries on measures to limit harmful tax competition. These measures are largely directed at counteracting the effects of tax havens and preferential tax regimes in countries around the world. In the OECDs report dated April 18, 2002 and updated as of June 2004 and November 2005 via a Global Forum, Bermuda was not listed as an uncooperative tax haven jurisdiction because it had previously committed to eliminate harmful tax practices and to embrace international tax standards for transparency, exchange of information and the elimination of any aspects of the regimes for financial and other services that attract business with no substantial domestic activity. We are not able to predict what changes will arise from the commitment or whether such changes will subject us to additional taxes.
Regulatory regimes and changes to accounting rules may adversely impact financial results irrespective of business operations.
Accounting standards and regulatory changes may require modifications to our accounting principles, both prospectively and for prior periods and such changes could have an adverse impact on our financial results. In particular, the SEC has formally proposed a plan to first allow and then require companies to file financial statements in accordance with IFRS rather than GAAP. Such changes could have a significant impact on our financial reporting, impacting key matters such as our loss reserving policies and premium and expense recognition. For example, the International Accounting Standards Board is considering adopting an accounting standard that would require all reinsurance and insurance contracts to be accounted for under a new measurement basis, current exit value, which is considered to be closely related to fair value. We are currently evaluating how the SECs initiatives will impact us, including as respects to our loss reserving policy or the effect it might have on recognizing premium revenue and policy acquisition costs. Required modification of our existing principles, either with respect to these issues or other issues in the future, could have an impact on our results of operations, including changing the timing of the recognition of underwriting income, increasing the volatility of our reported earnings and changing our overall financial statement presentation.
Heightened scrutiny of issues and practices in the insurance industry may adversely affect our business.
We believe that certain government authorities, including state officials in Florida, are continuing to scrutinize and investigate a number of issues and practices within the insurance industry. While we have not been named in any actions or proceedings, it is possible such scrutiny could expand to include us in the future, and it is also possible that these investigations or related regulatory developments will mandate or otherwise give rise to changes in industry practices in a fashion that increases our costs or requires us to alter how we conduct our business.
We cannot predict the ultimate effect that these investigations, and any changes in industry practice, including future legislation or regulations that may become applicable to us, will have on the insurance industry, the regulatory framework, or our business.
As noted above, because we frequently assume the credit risk of the counterparties with whom we do business throughout our insurance and reinsurance operations, our results of operations could be adversely affected if the credit quality of these counterparties is severely impacted by the current investigations in the insurance industry or by changes to industry practices.
ITEM 1B. UNRESOLVED STAFF COMMENTS
None.
53
Table of Contents
Glossary of Selected Insurance and Reinsurance Terms
| Accident year |
Year of occurrence of a loss. Claim payments and reserves for claims and claim expenses are allocated to the year in which the loss occurred for losses occurring contracts and in the year the loss was reported for claims made contracts. |
| Acquisition expenses |
The aggregate expenses incurred by a company acquiring new business, including commissions, underwriting expenses, premium taxes and administrative expenses. |
| Additional case reserves |
Additional case reserves represent managements estimate of reserves for claims and claim expenses that are allocated to specific contracts, less paid and reported losses by the client. |
| Attachment point |
The dollar amount of loss (per occurrence or in the aggregate, as the case may be) above which excess of loss reinsurance becomes operative. |
| Backup premiums written |
The premiums written for additional reinsurance coverage purchased after a series of catastrophic events has exhausted or significantly reduced the initial and reinstatement limits available under the original coverages purchased. |
| Bordereau |
A report providing premium or loss data with respect to identified specific risks. This report is periodically furnished to a reinsurer by the ceding insurers or reinsurers. |
| Bound |
A (re)insurance policy is considered bound, and the (re)insurer responsible for the risks of the policy, when both parties agree to the terms and conditions set forth in the policy. |
| Broker |
An intermediary who negotiates contracts of insurance or reinsurance, receiving a commission for placement and other services rendered, between (1) a policy holder and a primary insurer, on behalf of the insured party, (2) a primary insurer and reinsurer, on behalf of the primary insurer, or (3) a reinsurer and a retrocessionaire, on behalf of the reinsurer. |
| Capacity |
The percentage of surplus, or the dollar amount of exposure, that an insurer or reinsurer is willing or able to place at risk. Capacity may apply to a single risk, a program, a line of business or an entire book of business. Capacity may be constrained by legal restrictions, corporate restrictions or indirect restrictions. |
| Case reserves |
Loss reserves, established with respect to specific, individual reported claims. |
| Casualty insurance or reinsurance |
Insurance or reinsurance that is primarily concerned with the losses caused by injuries to third persons and their property (in other words, persons other than the policyholder) and the legal liability imposed on the insured resulting there from. Also referred to as liability insurance. |
54
Table of Contents
| Catastrophe |
A severe loss, typically involving multiple claimants. Common perils include earthquakes, hurricanes, hailstorms, severe winter weather, floods, fires, tornadoes, explosions and other natural or man-made disasters. Catastrophe losses may also arise from acts of war, acts of terrorism and political instability. |
| Catastrophe excess of loss reinsurance |
A form of excess of loss reinsurance that, subject to a specified limit, indemnifies the ceding company for the amount of loss in excess of a specified retention with respect to an accumulation of losses resulting from a catastrophe. |
| Catastrophe-linked securities; cat-linked securities |
Cat-linked securities are generally privately placed fixed income securities where all or a portion of the repayment of the principal is linked to catastrophic events. This includes securities where the repayment is linked to the occurrence and/or size of, for example, one or more hurricanes or earthquakes, or other industry losses associated with these catastrophic events. |
| Cede; cedant; ceding company |
When a party reinsures its liability with another, it cedes business and is referred to as the cedant or ceding company. |
| Claim |
Request by an insured or reinsured for indemnification by an insurance company or a reinsurance company for losses incurred from an insured peril or event. |
| Claims made contracts |
Contracts that cover claims for losses occurring during a specified period that are reported during the term of the contract. |
| Claims and claim expense ratio, net |
The ratio of net claims and claim expenses to net premiums earned determined in accordance with either SAP or GAAP. |
| Claim reserves |
Liabilities established by insurers and reinsurers to reflect the estimated costs of claim payments and the related expenses that the insurer or reinsurer will ultimately be required to pay in respect of insurance or reinsurance policies it has issued. Claims reserves consist of case reserves, established with respect to individual reported claims, additional case reserves and IBNR reserves. For reinsurers, loss expense reserves are generally not significant because substantially all of the loss expenses associated with particular claims are incurred by the primary insurer and reported to reinsurers as losses. |
| Combined ratio |
The combined ratio is the sum of the net claims and claim expense ratio and the underwriting expense ratio. A combined ratio below 100% generally indicates profitable underwriting prior to the consideration of investment income. A combined ratio over 100% generally indicates unprofitable underwriting prior to the consideration of investment income. |
| Decadal |
Refers to events occurring over a 10-year period, such as an oscillation whose period is roughly 10 years. |
55
Table of Contents
| Deemed inuring reinsurance |
A designation of other reinsurances which are first applied pursuant to the terms of the reinsurance agreement to reduce the loss subject to a particular reinsurance agreement. If the other reinsurances are to be disregarded as respects loss to that particular agreement, they are said to inure only to the benefit of the reinsured. |
| Earned premium |
(1) That part of the premium applicable to the expired part of the policy period, including the short-rate premium on cancellation, the entire premium on the amount of loss paid under some contracts, and the entire premium on the contract on the expiration of the policy, which is recognized as income during the period. |
(2) That portion of the reinsurance premium calculated on a monthly, quarterly or annual basis which is to be retained by the reinsurer and recognized as income in the period should their cession be canceled.
(3) When a premium is paid in advance for a certain time, the company is said to earn the premium as the time advances. For example, a policy written for three years and paid for in advance would be one-third earned at the end of the first year.
| Excess and surplus lines reinsurance |
Any type of coverage that cannot be placed with an insurer admitted to do business in a certain jurisdiction. Risks placed in excess and surplus lines markets are often substandard as respects adverse loss experience, unusual, or unable to be placed in conventional markets due to a shortage of capacity. |
| Excess of loss |
Reinsurance or insurance that indemnifies the reinsured or insured against all or a specified portion of losses on underlying insurance policies in excess of a specified amount, which is called a level or retention. Also known as non-proportional reinsurance. Excess of loss reinsurance is written in layers. A reinsurer or group of reinsurers accepts a layer of coverage up to a specified amount. The total coverage purchased by the cedant is referred to as a program and will typically be placed with predetermined reinsurers in pre-negotiated layers. Any liability exceeding the outer limit of the program reverts to the ceding company, which also bears the credit risk of a reinsurers insolvency. |
| Exclusions |
Those risk, perils, or classes of insurance with respect to which the reinsurer will not pay loss or provide reinsurance, notwithstanding the other terms and conditions of reinsurance. |
| Frequency |
The number of claims occurring during a given coverage period. |
| Generally Accepted Accounting Principles in the United States |
Also referred to as GAAP. Accounting principles as set forth in opinions of the Accounting Principles Board of the American Institute of Certified Public Accountants and/or statements of the Financial Accounting Standards Board and/or their respective successors and which are applicable in the circumstances as of the date in question. |
56
Table of Contents
| Gross premiums written |
Total premiums for insurance written and assumed reinsurance during a given period. |
| Incurred but not reported (IBNR) |
Reserves for estimated losses that have been incurred by insureds and reinsureds but not yet reported to the insurer or reinsurer, including unknown future developments on losses that are known to the insurer or reinsurer. |
| International Financial Reporting Standards |
Also referred to as IFRS. Accounting principles, standards and interpretations as set forth in opinions of the International Accounting Standards Board which are applicable in the circumstances as of the date in question. |
| Layer |
The interval between the retention or attachment point and the maximum limit of indemnity for which a reinsurer is responsible. |
| Line |
The amount of excess of loss reinsurance protection provided to an insurer or another reinsurer, often referred to as limit. |
| Line of business |
The general classification of insurance written by insurers and reinsurers, e.g. fire, allied lines, homeowners and surety, among others. |
| Loss; losses |
An occurrence that is the basis for submission and/or payment of a claim. Whether losses are covered, limited or excluded from coverage is dependent on the terms of the policy. |
| Losses occurring contracts |
Contracts that cover claims arising from loss events that occur during the term of the reinsurance contract, although not necessarily reported during the term of the contract. |
| Loss ratio |
Net claims incurred expressed as a percentage of net earned premiums. |
| Loss reserve |
For an individual loss, an estimate of the amount the insurer expects to pay for the reported claim. For total losses, estimates of expected payments for reported and unreported claims. These may include amounts for claims expenses. |
| Net claims and claim expenses |
The expenses of settling claims net of recoveries, including legal and other fees and the portion of general expenses allocated to claim settlement costs (also known as claim adjustment expenses) plus losses incurred with respect to net claims. |
| Net premiums earned |
The portion of net premiums written during or prior to a given period that was actually recognized as income during such period. |
| Net premiums written |
Gross premiums written for a given period less premiums ceded to reinsurers and retrocessionaires during such period. |
| No claims bonus |
A reduction of premiums assumed or ceded if no claims have been made within a specified period. |
| Non-proportional reinsurance |
See Excess of loss. |
57
Table of Contents
| Perils |
This term refers to the causes of possible loss in the property field, such as fire, windstorm, collision, hail, etc. In the casualty field, the term hazard is more frequently used. |
| Premiums; written, earned and unearned |
The amount charged during the term on policies and contracts issued, renewed or reinsured by an insurance company or reinsurance company. Written premium is premium registered on the books of an issuer or reinsurer at the time a policy is issued and paid for. Unearned premium is premium for a future exposure period. Earned premium is written premium minus unearned premium for an individual policy. |
| Property insurance or reinsurance |
Insurance or reinsurance that provides coverage to a person with an insurable interest in tangible property for that persons property loss, damage or loss of use. |
| Property per risk treaty reinsurance |
Reinsurance on a treaty basis of individual property risks insured by a ceding company. |
| Proportional reinsurance |
A generic term describing all forms of reinsurance in which the reinsurer shares a proportional part of the original premiums and losses of the reinsured. (Also known as pro-rata reinsurance, quota share reinsurance or participating reinsurance.) In proportional reinsurance the reinsurer generally pays the ceding company a ceding commission. The ceding commission generally is based on the ceding companys cost of acquiring the business being reinsured (including commissions, premium taxes, assessments and miscellaneous administrative expense) and also may include a profit factor. See also Quota Share Reinsurance and Surplus Share Reinsurance. |
| Quota share reinsurance |
A form of proportional reinsurance in which the reinsurer assumes an agreed percentage of each insurance being reinsured and shares all premiums and losses according with the reinsured. See also Proportional Reinsurance and Surplus Share Reinsurance. |
| Reinstatement premium |
The premium charged for the restoration of the reinsurance limit of a catastrophe contract to its full amount after payment by the reinsurer of losses as a result of an occurrence. |
| Reinsurance |
An arrangement in which an insurance company, the reinsurer, agrees to indemnify another insurance or reinsurance company, the ceding company, against all or a portion of the insurance or reinsurance risks underwritten by the ceding company under one or more policies. Reinsurance can provide a ceding company with several benefits, including a reduction in net liability on individual risks and catastrophe protection from large or multiple losses. Reinsurance also provides a ceding company with additional underwriting capacity by permitting it to accept larger risks and write more business than would be possible without a concomitant increase in capital and surplus, and facilitates the maintenance of acceptable financial ratios by the ceding company. Reinsurance does not legally discharge the primary insurer from its liability with respect to its obligations to the insured. |
58
Table of Contents
| Retention |
The amount or portion of risk that an insurer retains for its own account. Losses in excess of the retention level are paid by the reinsurer. In proportional treaties, the retention may be a percentage of the original policys limit. In excess of loss business, the retention is a dollar amount of loss, a loss ratio or a percentage. |
| Retrocessional reinsurance; Retrocessionaire |
A transaction whereby a reinsurer cedes to another reinsurer, the retrocessionaire, all or part of the reinsurance that the first reinsurer has assumed. Retrocessional reinsurance does not legally discharge the ceding reinsurer from its liability with respect to its obligations to the reinsured. Reinsurance companies cede risks to retrocessionaires for reasons similar to those that cause primary insurers to purchase reinsurance: to reduce net liability on individual risks, to protect against catastrophic losses, to stabilize financial ratios and to obtain additional underwriting capacity. |
| Risk excess of loss reinsurance |
A form of excess of loss reinsurance that covers a loss of the reinsured on a single risk in excess of its retention level of the type reinsured, rather than to aggregate losses for all covered risks, as does catastrophe excess of loss reinsurance. A risk in this context might mean the insurance coverage on one building or a group of buildings or the insurance coverage under a single policy, which the reinsured treats as a single risk. |
| Risks |
A term used to denote the physical units of property at risk or the object of insurance protection that are not perils or hazards. Also defined as chance of loss or uncertainty of loss. |
| Risks attaching contracts |
Contracts that cover claims that arise on underlying insurance policies that incept during the term of the reinsurance contract. |
| Specialty lines |
Lines of insurance and reinsurance that provide coverage for risks that are often unusual or difficult to place and do not fit the underwriting criteria of standard commercial products carriers. |
| Statutory accounting principles (SAP) |
Recording transactions and preparing financial statements in accordance with the rules and procedures prescribed or permitted by Bermuda and/or the U.S. state insurance regulatory authorities including the NAIC, which in general reflect a liquidating, rather than going concern, concept of accounting. |
| Stop loss |
A form of reinsurance under which the reinsurer pays some or all of a cedants aggregate retained losses in excess of a predetermined dollar amount or in excess of a percentage of premium. |
| Submission |
An unprocessed application for (i) insurance coverage forwarded to a primary insurer by a prospective policyholder or by a broker on behalf of such prospective policyholder, (ii) reinsurance coverage forwarded to a reinsurer by a prospective ceding insurer or by a broker or intermediary on behalf of such prospective ceding insurer or (iii) retrocessional coverage forwarded to a retrocessionaire by a prospective ceding reinsurer or by a broker or intermediary on behalf of such prospective ceding reinsurer. |
59
Table of Contents
| Surplus share reinsurance |
A form of pro-rata reinsurance (proportional) indemnifying the ceding company against loss to the extent of the surplus insurance liability ceded, on a share basis similar to quota share. See also Proportional Reinsurance and Quota Share Reinsurance. |
| Treaty |
A reinsurance agreement covering a book or class of business that is automatically accepted on a bulk basis by a reinsurer. A treaty contains common contract terms along with a specific risk definition, data on limit and retention, and provisions for premium and duration. |
| Underwriting |
The insurers or reinsurers process of reviewing applications submitted for insurance coverage, deciding whether to accept all or part of the coverage requested and determining the applicable premiums. |
| Underwriting capacity |
The maximum amount that an insurance company can underwrite. The limit is generally determined by a companys retained earnings and investment capital. Reinsurance serves to increase a companys underwriting capacity by reducing its exposure from particular risks. |
| Underwriting expense ratio |
The ratio of the sum of the acquisition expenses and operational expenses to net premiums earned, determined in accordance with GAAP. |
| Underwriting expenses |
The aggregate of policy acquisition costs, including commissions, and the portion of administrative, general and other expenses attributable to underwriting operations. |
| Unearned premium |
The portion of premiums written representing the unexpired portions of the policies or contracts that the insurer or reinsurer has on its books as of a certain date. |
60
Table of Contents
We lease office space in Bermuda, which houses our executive offices and operations for both our Reinsurance and Individual Risk segments. In addition, our Individual Risk segment and other U.S. based subsidiaries lease office space in a number of U.S. states. Our Reinsurance segment also leases office space in Dublin, Ireland. While we believe that for the foreseeable future our current office space is sufficient for us to conduct our operations, it is likely that we will expand into additional facilities and perhaps new locations to accommodate future growth. To date, the cost of acquiring and maintaining our office space has not been material to us as a whole.
As previously disclosed, we received a subpoena from the SEC in February 2005, a subpoena from the Office of the Attorney General of the State of New York (the NYAG) in March 2005, and a subpoena from the United States Attorneys Office for the Southern District of New York in June 2005, each of which related to industry-wide investigations into non-traditional, or loss mitigation, (re)insurance products.
On February 6, 2007, we announced that the SEC had accepted our offer of settlement to the SEC to resolve the SECs investigation. The settlement was approved by the United States District Court for the Southern District of New York pursuant to a final judgment entered on March 20, 2007, and we have made payment on all financial penalties agreed to under the settlement. Pursuant to the settlement, we were also required to retain an independent consultant to review certain of our internal controls, policies and procedures as well as the design and implementation of the review conducted by independent counsel reporting to the non-executive members of our Board of Directors and certain additional procedures performed by our auditors in connection with their audit of our financial statements for the fiscal year ended December 31, 2004. While we continue to strive to fully comply with the terms of the settlement agreement with the SEC, it is possible we will fail to do so, or that the enforcement staff of the SEC and/or the independent consultant may take issue with our cooperation despite our efforts. Any such failure to comply with the settlement agreement or any such perception that we have failed to comply could adversely affect us, perhaps materially so.
As previously disclosed, in September 2006, the SEC filed an enforcement action in the United States District Court for the Southern District of New York (the Court) against certain of our former officers, including James N. Stanard, our former Chairman and Chief Executive Officer, charging such individuals with violations of federal securities laws, including securities fraud, and seeking permanent injunctive relief, disgorgement of ill-gotten gains, if any, plus prejudgment interest, civil money penalties, and orders barring each defendant from acting as an officer or director of any public company. The civil litigation between the SEC and Mr. Stanard, to which the Company was not a party, went to trial in September 2008. On January 27, 2009, the Court issued an opinion and order finding Mr. Stanard liable for securities fraud and other violations of Federal securities laws. The Court permanently enjoined Mr. Stanard from future securities violations and ordered Mr. Stanard to pay a $100 thousand civil penalty. The Court denied the SECs request for an order barring Mr. Stanard from serving as an officer or director of a public company. This ongoing matter, including whether or not an appeal is taken, could give rise to additional costs, distractions, or impacts to our reputation.
Our operating subsidiaries are subject to claims litigation involving disputed interpretations of policy coverages. Generally, our primary insurance operations are subject to greater frequency and diversity of claims and claims-related litigation and, in some jurisdictions, may be subject to direct actions by allegedly injured persons or entities seeking damages from policyholders. These lawsuits, involving claims on policies issued by our subsidiaries which are typical to the insurance industry in general and in the normal course of business, are considered in our loss and loss expense reserves which are discussed in its loss reserves discussion. In addition to claims litigation, we and our subsidiaries are subject to lawsuits and regulatory actions in the normal course of business that do not arise from or directly relate to claims on insurance policies. This category of business litigation may involve allegations of underwriting or claims-handling errors or misconduct, employment claims, regulatory activity or disputes arising from our business ventures. Any such litigation or arbitration contains an element of uncertainty, and we believe the inherent uncertainty in such matters may have increased recently and will likely continue to increase. Currently, we believe that no
61
Table of Contents
individual, normal course litigation or arbitration to which we are presently a party is likely to have a material adverse effect on its financial condition, business or operations.
ITEM 4. SUBMISSION OF MATTERS TO A VOTE OF SECURITY HOLDERS
None.
ITEM 5. MARKET FOR REGISTRANTS COMMON EQUITY, RELATED SHAREHOLDER MATTERS AND ISSUER REPURCHASES OF EQUITY SECURITIES
PRICE RANGE OF COMMON SHARES
Our common shares began publicly trading on June 27, 1995 on the New York Stock Exchange under the symbol RNR. The following table sets forth, for the periods indicated, the high and low prices per share of our common shares as reported in composite New York Stock Exchange trading:
|
Price Range of Common Shares |
||||||
| Period |
High | Low | ||||
| 2008 |
||||||
| First Quarter |
$ | 60.34 | $ | 49.54 | ||
| Second Quarter |
55.40 | 44.59 | ||||
| Third Quarter |
56.95 | 43.92 | ||||
| Fourth Quarter |
52.25 | 31.50 | ||||
| 2007 |
||||||
| First Quarter |
$ | 60.69 | $ | 49.35 | ||
| Second Quarter |
62.39 | 49.52 | ||||
| Third Quarter |
66.53 | 52.58 | ||||
| Fourth Quarter |
66.75 | 55.02 | ||||
On February 11, 2009, the last reported sale price for our common shares was $43.57 per share. At February 11, 2009, there were 230 holders of record of our common shares.
62
Table of Contents
PERFORMANCE GRAPH
The following graph compares the cumulative return on our common shares including reinvestment of our dividends on our common shares to such return for the Standard & Poors (S&P) 500 Composite Stock Price Index (S&P 500) and S&Ps Property-Casualty Industry Group Stock Price Index (S&P P/C), for the five-year period commencing January 1, 2004 and ending December 31, 2008, assuming $100 was invested on January 1, 2004. Each measurement point on the graph below represents the cumulative shareholder return as measured by the last sale price at the end of each calendar year during the period from January 1, 2004 through December 31, 2008. As depicted in the graph below, during this period, the cumulative return was (1) 14.2% on our common shares; (2) negative 10.5% for the S&P 500; and (3) negative 12.1% for the S&P P/C.
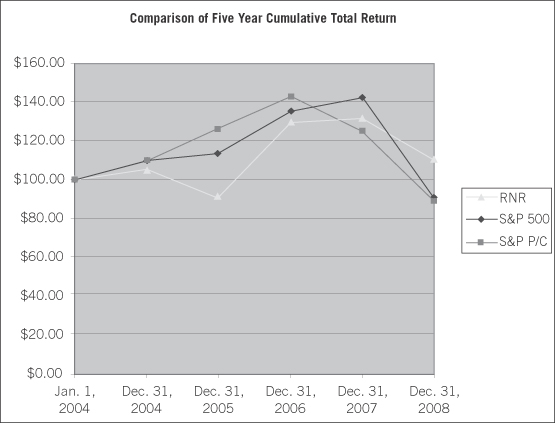
DIVIDEND POLICY
Historically, we have paid dividends on our common shares every quarter, and have increased our dividend during each of the twelve years since our initial public offering. The Board of Directors of RenaissanceRe declared regular quarterly dividends of $0.23 per share during 2008 with dividend record dates of March 14, June 13, September 15 and December 15, 2008. The Board of Directors declared regular quarterly dividends of $0.22 per share during 2007 with dividend record dates of March 15, June 15, September 14 and December 14, 2007. On February 18, 2009, the Board of Directors approved an increased dividend of $0.24 per common share, payable on March 31, 2009, to shareholders of record on March 13, 2009. The declaration and payment of dividends are subject to the discretion of the Board and depend on, among other things, our financial condition, general business conditions, legal, contractual and regulatory restrictions regarding the payment of dividends by us and our subsidiaries and other factors which the Board may in the future consider to be relevant.
63
Table of Contents
ISSUER REPURCHASES OF EQUITY SECURITIES
The Companys share repurchase program may be effected from time to time, depending on market conditions and other factors, through open market purchases and privately negotiated transactions. On May 20, 2008, the Board of Directors publicly announced an increase in the Companys authorized share repurchase program to $500.0 million. Unless terminated earlier by resolution of the Companys Board of Directors, the program will expire when the Company has repurchased the full value of the shares authorized. During the three months ended December 31, 2008, no shares were repurchased under this program. The repurchases reflected below during the three months ended December 31, 2008 exclusively represent withholdings from employees surrendered in respect of withholding tax obligations on the vesting of restricted stock, or in lieu of cash payments for the exercise price of employee stock options.
| Total shares purchased | Other shares purchased |
Shares purchased under repurchase program |
Dollar amount still available under repurchase program |
||||||||||||||||
| Shares purchased |
Average price per share |
Shares purchased |
Average price per share |
Shares purchased |
Average price per share |
||||||||||||||
| (in millions) | |||||||||||||||||||
| Beginning dollar amount available to be repurchased |
$ | 377.3 | |||||||||||||||||
| January 1 31, 2008 |
2,789,003 | $ | 57.23 | 1,603 | $ | 58.11 | 2,787,400 | $ | 57.23 | (159.6 | ) | ||||||||
| February 1 29, 2008 |
509,611 | $ | 58.23 | 711 | $ | 53.19 | 508,900 | $ | 58.24 | (29.6 | ) | ||||||||
| March 1 31, 2008 |
1,009,149 | $ | 51.75 | 37,449 | $ | 51.15 | 971,700 | $ | 51.77 | (50.4 | ) | ||||||||
| April 1 30, 2008 |
482,759 | $ | 52.92 | 59 | $ | 54.47 | 482,700 | $ | 52.92 | (25.5 | ) | ||||||||
| May 1 20, 2008 |
901,050 | $ | 51.58 | 15,750 | $ | 52.23 | 885,300 | $ | 51.57 | (45.7 | ) | ||||||||
| May 20, 2008 increase authorized share repurchase program to $500.0 million |
433.5 | ||||||||||||||||||
| Dollar amount available to be repurchased |
500.0 | ||||||||||||||||||
| May 21 31, 2008 |
716,100 | $ | 52.22 | | $ | | 716,100 | $ | 52.22 | (37.4 | ) | ||||||||
| June 1 30, 2008 |
83,636 | $ | 52.38 | 36 | $ | 52.37 | 83,600 | $ | 52.38 | (4.4 | ) | ||||||||
| July 1 31, 2008 |
1,644,872 | $ | 46.56 | 16,972 | $ | 46.62 | 1,627,900 | $ | 46.56 | (75.8 | ) | ||||||||
| August 1 31, 2008 |
703 | $ | 50.92 | 703 | $ | 50.92 | | $ | | | |||||||||
| September 1 30, 2008 |
7,301 | $ | 51.07 | 7,301 | $ | 51.07 | | $ | | | |||||||||
| October 1 31, 2008 |
646 | $ | 45.29 | 646 | $ | 45.29 | | $ | | | |||||||||
| November 1 30, 2008 |
4,638 | $ | 44.90 | 4,638 | $ | 44.90 | | $ | | | |||||||||
| December 1 31, 2008 |
443 | $ | 44.36 | 443 | $ | 44.36 | | $ | | | |||||||||
| Total |
8,149,911 | $ | 53.08 | 86,311 | $ | 50.18 | 8,063,600 | $ | 53.11 | $ | 382.4 | ||||||||
In the future, the Company may adopt additional trading plans or authorize purchase activities under the remaining authorization, which the Board may increase in the future. See Note 13 of our Notes to Consolidated Financial Statements for information regarding our stock repurchase program.
64
Table of Contents
ITEM 6. SELECTED CONSOLIDATED FINANCIAL DATA
The following tables set forth our selected financial data and other financial information at the end of and for each of the years in the five-year period ended December 31, 2008. This historical financial information was prepared in accordance with GAAP. The consolidated statement of operations data for the years ended December 31, 2008, 2007, 2006, 2005 and 2004 and the balance sheet data at December 31, 2008, 2007, 2006, 2005 and 2004 were derived from our consolidated financial statements. You should read the selected financial data in conjunction with our consolidated financial statements and related notes thereto and Managements Discussion and Analysis of Financial Condition and Results of Operations included in this filing and all other information appearing elsewhere or incorporated into this filing by reference.
| Year ended December 31, |
2008 | 2007 | 2006 | 2005 | 2004 | |||||||||||||||
| (in thousands, except share and per share data and percentages) |
||||||||||||||||||||
| Statement of Operations Data: |
||||||||||||||||||||
| Gross premiums written |
$ | 1,736,028 | $ | 1,809,637 | $ | 1,943,647 | $ | 1,809,128 | $ | 1,544,157 | ||||||||||
| Net premiums written |
1,353,620 | 1,435,335 | 1,529,620 | 1,543,287 | 1,349,287 | |||||||||||||||
| Net premiums earned |
1,386,824 | 1,424,369 | 1,529,777 | 1,402,709 | 1,338,227 | |||||||||||||||
| Net investment income |
24,231 | 402,463 | 318,106 | 217,252 | 162,722 | |||||||||||||||
| Net realized (losses) gains on sales of investments |
(206,314 | ) | 1,293 | (34,464 | ) | (6,962 | ) | 23,442 | ||||||||||||
| Net claims and claim expenses incurred |
760,489 | 479,274 | 446,230 | 1,635,656 | 1,096,299 | |||||||||||||||
| Acquisition costs |
213,553 | 254,930 | 280,697 | 237,594 | 244,930 | |||||||||||||||
| Operational expenses |
122,165 | 110,464 | 109,586 | 85,838 | 56,361 | |||||||||||||||
| Underwriting income (loss) |
290,617 | 579,701 | 693,264 | (556,379 | ) | (59,363 | ) | |||||||||||||
| Income (loss) before taxes |
29,588 | 594,004 | 798,045 | (246,763 | ) | 168,245 | ||||||||||||||
| Net (loss) income (attributable) available to common shareholders |
(13,280 | ) | 569,575 | 761,635 | (281,413 | ) | 133,108 | |||||||||||||
| (Loss) earnings per common share diluted (1) |
(0.21 | ) | 7.93 | 10.57 | (3.99 | ) | 1.85 | |||||||||||||
| Dividends per common share |
0.92 | 0.88 | 0.84 | 0.80 | 0.76 | |||||||||||||||
| Weighted average common shares outstanding diluted (1) |
62,531 | 71,825 | 72,073 | 70,592 | 71,774 | |||||||||||||||
| Return on average common equity |
(0.5 | %) | 20.9 | % | 36.3 | % | (13.6 | %) | 6.2 | % | ||||||||||
| Combined ratio |
79.0 | % | 59.3 | % | 54.7 | % | 139.7 | % | 104.4 | % | ||||||||||
| At December 31, |
2008 | 2007 | 2006 | 2005 | 2004 | |||||||||||||||
| Balance Sheet Data: |
||||||||||||||||||||
| Total investments |
$ | 6,042,582 | $ | 6,634,348 | $ | 6,342,805 | $ | 5,291,153 | $ | 4,826,249 | ||||||||||
| Total assets |
7,984,051 | 8,286,355 | 7,769,026 | 6,871,261 | 5,526,318 | |||||||||||||||
| Reserve for claims and claim expenses |
2,160,612 | 2,028,496 | 2,098,155 | 2,614,551 | 1,459,398 | |||||||||||||||
| Reserve for unearned premiums |
510,235 | 563,336 | 578,424 | 501,744 | 365,335 | |||||||||||||||
| Debt |
450,000 | 451,951 | 450,000 | 500,000 | 350,000 | |||||||||||||||
| Capital leases |
26,292 | 2,533 | 2,742 | 2,931 | | |||||||||||||||
| Subordinated obligation to capital trust |
| | 103,093 | 103,093 | 103,093 | |||||||||||||||
| Preferred shares |
650,000 | 650,000 | 800,000 | 500,000 | 500,000 | |||||||||||||||
| Total shareholders equity attributable to common shareholders |
2,382,743 | 2,827,503 | 2,480,497 | 1,753,840 | 2,144,042 | |||||||||||||||
| Total shareholders equity |
3,032,743 | 3,477,503 | 3,280,497 | 2,253,840 | 2,644,042 | |||||||||||||||
| Common shares outstanding |
61,503 | 68,920 | 72,140 | 71,523 | 71,029 | |||||||||||||||
| Book value per common share |
$ | 38.74 | $ | 41.03 | $ | 34.38 | $ | 24.52 | $ | 30.19 | ||||||||||
| Accumulated dividends |
7.92 | 7.00 | 6.12 | 5.28 | 4.48 | |||||||||||||||
| Book value per common share plus accumulated dividends |
$ | 46.66 | $ | 48.03 | $ | 40.50 | $ | 29.80 | $ | 34.67 | ||||||||||
| Change in book value per common share plus accumulated dividends |
(2.9 | %) | 18.6 | % | 35.9 | % | (14.0 | %) | 4.0 | % | ||||||||||
| (1) | (Loss) earnings per common share diluted was calculated by dividing net (loss) income (attributable) available to common shareholders by the number of weighted average common shares and common share equivalents outstanding. Common share equivalents are calculated on the basis of the treasury stock method. In accordance with FAS 128, diluted (loss) earnings per share calculations use weighted average common shares outstanding basic, when in a net loss position. |
65
Table of Contents
| Years ended December 31, |
2008 | 2007 | 2006 | 2005 | 2004 | |||||||||||||||
| (in thousands, except ratios) | ||||||||||||||||||||
| Segment Information: |
||||||||||||||||||||
| Reinsurance |
||||||||||||||||||||
| Gross premiums written (1) |
$ | 1,154,391 | $ | 1,290,420 | $ | 1,321,163 | $ | 1,202,975 | $ | 1,084,896 | ||||||||||
| Net premiums written |
871,893 | 1,024,493 | 1,039,103 | 1,024,010 | 930,946 | |||||||||||||||
| Underwriting income (loss) |
281,625 | 528,659 | 636,236 | (461,540 | ) | 46,389 | ||||||||||||||
| Net claims and claim expense ratio |
48.5 | % | 25.2 | % | 15.2 | % | 132.2 | % | 79.0 | % | ||||||||||
| Underwriting expense ratio |
20.5 | % | 19.6 | % | 19.3 | % | 16.5 | % | 16.1 | % | ||||||||||
| Combined ratio |
69.0 | % | 44.8 | % | 34.5 | % | 148.7 | % | 95.1 | % | ||||||||||
| Individual Risk |
||||||||||||||||||||
| Gross premiums written |
$ | 587,309 | $ | 556,594 | $ | 689,392 | $ | 651,430 | $ | 478,092 | ||||||||||
| Net premiums written |
481,727 | 410,842 | 490,517 | 519,277 | 418,341 | |||||||||||||||
| Underwriting income (loss) |
8,992 | 51,042 | 57,028 | (94,839 | ) | (105,752 | ) | |||||||||||||
| Net claims and claim expense ratio |
67.0 | % | 51.0 | % | 53.5 | % | 84.1 | % | 89.0 | % | ||||||||||
| Underwriting expense ratio |
31.1 | % | 38.1 | % | 36.3 | % | 36.7 | % | 37.9 | % | ||||||||||
| Combined ratio |
98.1 | % | 89.1 | % | 89.8 | % | 120.8 | % | 126.9 | % | ||||||||||
| Total |
||||||||||||||||||||
| Gross premiums written |
$ | 1,736,028 | $ | 1,809,637 | $ | 1,943,647 | $ | 1,809,128 | $ | 1,544,157 | ||||||||||
| Net premiums written |
1,353,620 | 1,435,335 | 1,529,620 | 1,543,287 | 1,349,287 | |||||||||||||||
| Underwriting income (loss) |
290,617 | 579,701 | 693,264 | (556,379 | ) | (59,363 | ) | |||||||||||||
| Net claims and claim expense ratio |
54.8 | % | 33.6 | % | 29.2 | % | 116.6 | % | 81.9 | % | ||||||||||
| Underwriting expense ratio |
24.2 | % | 25.7 | % | 25.5 | % | 23.1 | % | 22.5 | % | ||||||||||
| Combined ratio |
79.0 | % | 59.3 | % | 54.7 | % | 139.7 | % | 104.4 | % | ||||||||||
| (1) | Includes $5.7 million, $37.4 million, $66.9 million, $45.3 million and $18.8 million of premium assumed from our Individual Risk segment in the years ended December 31, 2008, 2007, 2006, 2005 and 2004, respectively. |
66
Table of Contents
ITEM 7. MANAGEMENTS DISCUSSION AND ANALYSIS OF FINANCIAL CONDITION AND RESULTS OF OPERATIONS
The following is a discussion and analysis of our results of operations for the year ended December 31, 2008, compared with the years ended December 31, 2007 and 2006. The following also includes a discussion of our liquidity and capital resources at December 31, 2008. This discussion and analysis should be read in conjunction with the audited consolidated financial statements and related notes included in this filing. This filing contains forward-looking statements that involve risks and uncertainties. Actual results may differ materially from the results described or implied by these forward-looking statements. See Note on Forward-Looking Statements.
OVERVIEW
RenaissanceRe, established in Bermuda in 1993 to write principally property catastrophe reinsurance, is today a leading global provider of reinsurance and insurance coverages and related services. Through our operating subsidiaries, we seek to obtain a portfolio of reinsurance, insurance and financial risks in each of our businesses that are significantly better than the market average and produce an attractive return on equity. We accomplish this by leveraging our core capabilities of risk assessment and information management, and by investing in our capabilities to serve our customers across the cycles that have historically characterized our markets. Overall, our strategy focuses on superior risk selection, marketing, capital management and joint ventures. We provide value to our clients and joint venture partners in the form of financial security, innovative products, and responsive service. We are known as a leader in paying valid reinsurance claims promptly. We principally measure our financial success through long-term growth in tangible book value per common share plus accumulated dividends, which we believe is the most appropriate measure of our Companys performance, and believe we have delivered superior performance in respect of this measure over time.
Since a substantial portion of the reinsurance and insurance we write provides protection from damages relating to natural and man-made catastrophes, our results depend to a large extent on the frequency and severity of such catastrophic events, and the coverages we offer to clients affected by these events. We are exposed to significant losses from these catastrophic events and other exposures that we cover. Accordingly, we expect a significant degree of volatility in our financial results and our financial results may vary significantly from quarter-to-quarter or from year-to-year, based on the level of insured catastrophic losses occurring around the world.
Our revenues are principally derived from three sources: 1) net premiums earned from the reinsurance and insurance policies we sell; 2) net investment income and realized gains from the investment of our capital funds and the investment of the cash we receive on the policies which we sell; and 3) other income received from our joint ventures, advisory services, weather-trading activities and various other items.
Our expenses primarily consist of: 1) net claims and claim expenses incurred on the policies of reinsurance and insurance we sell; 2) acquisition costs which typically represent a percentage of the premiums we write; 3) operating expenses which primarily consist of personnel expenses, rent and other operating expenses; 4) corporate expenses which include certain executive, legal and consulting expenses, costs for research and development, and other miscellaneous costs associated with operating as a publicly traded company; 5) minority interest, which represents the interest of third parties with respect to the net income of DaVinciRe; and 6) interest and dividend costs related to our debt, preference shares and subordinated obligation to our capital trust. We are also subject to taxes in certain jurisdictions in which we operate; however, since the majority of our income is currently earned in Bermuda, a non-taxable jurisdiction, the tax impact to our operations has historically been minimal. We currently expect our growth outside of Bermuda to result in a higher effective tax rate in future periods.
The operating results, also known as the underwriting results, of an insurance or reinsurance company are discussed frequently by reference to its net claims and claim expense ratio, underwriting expense ratio, and combined ratio. The net claims and claim expense ratio is calculated by dividing net claims and claim expenses incurred by net premiums earned. The underwriting expense ratio is calculated by dividing underwriting expenses (acquisition expenses and operational expenses) by net premiums earned. The combined ratio is the sum of the net claims and claim expense ratio and the underwriting expense ratio. A
67
Table of Contents
combined ratio below 100% generally indicates profitable underwriting prior to the consideration of investment income. A combined ratio over 100% generally indicates unprofitable underwriting prior to the consideration of investment income. We also discuss our net claims and claim expense ratio on an accident year basis. This ratio is calculated by taking net claims and claim expenses, excluding development on net claims and claim expenses from events that took place in prior fiscal years, divided by net premiums earned.
We conduct our business through two reportable segments, Reinsurance and Individual Risk. Those segments are more fully described as follows:
Reinsurance
Our Reinsurance segment has three main units:
| 1) | Property catastrophe reinsurance, written for our own account and for DaVinci, is our traditional core business. We believe we are one of the worlds leading providers of this coverage, based on catastrophe gross premiums written. This coverage protects against large natural catastrophes, such as earthquakes, hurricanes and tsunamis, as well as claims arising from other natural and man-made catastrophes such as winter storms, freezes, floods, fires, wind storms, tornadoes, explosions and acts of terrorism. We offer this coverage to insurance companies and other reinsurers primarily on an excess of loss basis. This means that we begin paying when our customers claims from a catastrophe exceed a certain retained amount. |
| 2) | Specialty reinsurance, written for our own account and for DaVinci, covering certain targeted classes of business where we believe we have a sound basis for underwriting and pricing the risk that we assume. Our portfolio includes various classes of business, such as catastrophe exposed workers compensation, surety, terrorism, medical malpractice, catastrophe exposed personal lines property, casualty clash, catastrophe exposed personal lines property, certain other casualty lines and other specialty lines of reinsurance that we collectively refer to as specialty reinsurance. We believe that we are seen as a market leader in certain of these classes of business, such as casualty clash, surety, catastrophe-exposed workers compensation and terrorism. |
| 3) | Through our ventures unit, we pursue joint ventures and other strategic relationships. Our four principal business activities in this area are: 1) property catastrophe joint ventures which we manage, such as Top Layer Re and DaVinci; 2) strategic investments in other market participants, such as our investments in ChannelRe, Platinum and the Tower Hill Companies, where, rather than assuming exclusive management responsibilities ourselves, we partner with other market participants; 3) weather and energy products and trading activities; and 4) fee-based consulting services, research and development and loss and mitigation activities. Only business activities that appear in our consolidated underwriting results, such as DaVinci and certain reinsurance transactions, are included in our Reinsurance segment results; our share of the results of our investments in other ventures, accounted for under the equity method and our weather-related activities are included in the Other category of our segment results. |
Individual Risk
We define our Individual Risk segment to include underwriting that involves understanding the characteristics of the original underlying insurance policy. Our principal contracts include insurance policies and quota share reinsurance with respect to risks including: 1) multi-peril crop, which includes multi-peril crop insurance, crop hail and other named peril agriculture risk management products; 2) commercial property, which principally includes catastrophe-exposed commercial property products; 3) commercial multi-line, which includes commercial property and liability coverage, such as general liability, automobile liability and physical damage, building and contents, professional liability and various specialty products; and 4) personal lines property, which principally includes homeowners personal lines property coverage and catastrophe exposed personal lines property coverage.
Our Individual Risk business is primarily produced through four distribution channels: 1) a wholly owned program manager where we write primary insurance through our own subsidiary; 2) third party program managers where we write primary insurance through third party program managers, who produce
68
Table of Contents
business pursuant to agreed-upon underwriting guidelines and provide related back-office functions; 3) quota share reinsurance where we write quota share reinsurance with primary insurers who, similar to our third party program managers, provide most of the back-office and support functions; and 4) brokers and agents where we write primary insurance produced through licensed intermediaries on a risk-by-risk basis.
Our Individual Risk business is written by the Glencoe Group through its principal operating subsidiaries Glencoe and Lantana, which write on an excess and surplus lines basis, and through Stonington and Stonington Lloyds, which write on an admitted basis. Since the inception of our Individual Risk business, we have substantially relied on third parties for services including the generation of premium, the issuance of policies and the processing of claims. We actively oversee our third party partners through an operations review team at Glencoe Specialty Services, which conducts initial due diligence as well as ongoing monitoring. We have been investing in initiatives to strengthen our operating platform, enhance our internal capabilities, and expand the resources we commit to our Individual Risk operations. In furtherance of these initiatives, we completed the acquisition of substantially all the net assets of Agro National, LLC and CMS in 2008, as further described below.
Acquisitions
On June 2, 2008, the Company acquired substantially all the assets and assumed certain liabilities of Agro National, LLC. Agro National is based in Council Bluffs, Iowa and is a managing general underwriter of multi-peril crop insurance. Agro National offers high quality risk protection products and services to the agricultural community throughout the U.S. Agro National participates in the U.S. Federal governments Multi-Peril Crop Insurance Program and has been writing business on behalf of Stonington, a wholly owned subsidiary of the Company, since 2004. The base purchase price paid by the Company was $80.5 million, plus additional amounts as determined in accordance with the terms of the asset purchase agreement. In connection with the purchase, the Company recorded $46.3 million of intangible assets and $20.4 million of goodwill. The acquisition was undertaken to purchase the distribution channel for the Companys multi- peril crop insurance business which was previously conducted through a managing general agency contractual relationship with Agro National, LLC. Other factors that added to the value of Agro National, LLC included its agent relationships, systems and technology, brand name and workforce. These factors resulted in a purchase price greater than the fair value of the net assets acquired and the recognition of goodwill and intangible assets. The acquisition of the net assets was accounted for using the purchase method in accordance with FASB Statement No. 141, Business Combinations (FAS 141).
Effective April 1, 2008, the Company purchased substantially all the assets of CMS. CMS was subsequently renamed Glencoe Claims. Glencoe Claims is based in Roswell, Georgia and is a privately held company specializing in claims administration, adjusting and consulting services for insurance companies, managing general agents, self-insured clients, fronted programs and clients with substantial retentions or deductibles. Glencoe Claims has a proprietary network of licensed adjusters and offers services on a national basis. The Company uses Glencoe Claims for claims services solely for its own business and Glencoe Claims is not currently providing claims services to third parties. The base purchase price paid by the Company was $3.8 million, plus additional amounts as determined in accordance with the terms of the asset purchase agreement. In connection with the purchase, the Company acquired net assets with a fair value of $0.5 million and recorded $3.3 million of goodwill. Goodwill is estimated to have an indefinite life and is recorded entirely in the Companys Individual Risk segment.
In addition to the Companys $10.0 million investment in Tower Hill during 2005, the Company invested $50.0 million on July 1, 2008, representing a 25.0% equity interest, in the Tower Hill Companies. The Tower Hill Companies operate primarily in the State of Florida. THIG is a managing general agency specializing in insurance coverage for site built and manufactured homes. THCS and THCM provide claim adjustment services through exclusive agreements with THIG. The investment in the Tower Hill Companies was undertaken to expand the Companys core platforms by obtaining ownership in an additional distribution channel for the Florida homeowners market and to enhance relationships with other stakeholders. Other factors that added to the value of the Tower Hill Companies included its reputation, agent relationships, systems and technology. These factors resulted in an investment greater than the fair
69
Table of Contents
value of the net assets acquired and the recognition of goodwill and intangible assets. In connection with the investment, the Company recorded $40.0 million of intangible assets and $7.8 million of goodwill on the July 1, 2008 effective date. The investment in the Tower Hill Companies was accounted for using the equity method in accordance with Accounting Principles Board Opinion 18, The Equity Method of Accounting for Investments in Common Stock (APB 18) and as such, the goodwill and intangible assets are recorded under Investments in other ventures, under equity method in the Companys consolidated balance sheet at December 31, 2008.
New Business
In addition to the potential growth of our existing reinsurance and insurance businesses, from time to time we consider diversification into new ventures, either through organic growth, the formation of new joint ventures, or the acquisition of or the investment in other companies or books of business of other companies. This potential diversification includes opportunities to write targeted, additional classes of risk-exposed business, both directly for our own account and through possible new joint venture opportunities. We also regularly evaluate opportunities to grow our business by utilizing our skills, capabilities, proprietary technology and relationships to expand into further risk-related coverages, services and products. Generally, we focus on underwriting or trading risks where reasonably sufficient data may be available, and where our analytical abilities may provide us a competitive advantage, in order for us to seek to model estimated probabilities of losses and returns in accordance with our approach in respect of our current portfolio of risks. We also regularly review potential new investments, in both operating entities and financial instruments. We believe the current period of market dislocation may have increased the prospects that we can deploy capital in such initiatives at attractive expected rates of return.
In evaluating potential new ventures or investments, we generally seek an attractive return on equity, the ability to develop or capitalize on a competitive advantage, and opportunities which we believe will not detract from our core Reinsurance and Individual Risk operations. Accordingly, we regularly review strategic opportunities and periodically engage in discussions regarding possible transactions, although there can be no assurance that we will complete any such transactions or that any such transaction would be successful or contribute materially to our results of operations or financial condition. We believe that our ability to potentially attract investment and operational opportunities is supported by our strong reputation and financial resources, and by the capabilities and track record of our ventures unit.
Summary of Critical Accounting Estimates
Claims and Claim Expense Reserves
General Description
We believe the most significant accounting judgment made by management is our estimate of claims and claim expense reserves. Claims and claim expense reserves represent estimates, including actuarial and statistical projections at a given point in time, of the ultimate settlement and administration costs for unpaid claims and claim expenses arising from the insurance and reinsurance contracts we sell. We establish our claims and claim expense reserves by taking claims reported to us by insureds and ceding companies, but which have not yet been paid (case reserves), adding the costs for additional case reserves (additional case reserves) which represent our estimates for claims previously reported to us which we believe may not be adequately reserved as of that date, and adding estimates for the anticipated cost of claims incurred but not yet reported to us (IBNR).
70
Table of Contents
The following table summarizes our claims and claim expense reserves by line of business and split between case reserves, additional case reserves and IBNR at December 31, 2008 and 2007:
| At December 31, 2008 |
Case Reserves |
Additional Case Reserves |
IBNR | Total | ||||||||
| (in thousands) | ||||||||||||
| Property catastrophe reinsurance |
$ | 312,944 | $ | 297,279 | $ | 250,946 | $ | 861,169 | ||||
| Specialty reinsurance |
113,953 | 135,345 | 387,352 | 636,650 | ||||||||
| Total Reinsurance |
426,897 | 432,624 | 638,298 | 1,497,819 | ||||||||
| Individual Risk |
253,327 | 14,591 | 394,875 | 662,793 | ||||||||
| Total |
$ | 680,224 | $ | 447,215 | $ | 1,033,173 | $ | 2,160,612 | ||||
| At December 31, 2007 |
||||||||||||
| (in thousands) | ||||||||||||
| Property catastrophe reinsurance |
$ | 275,436 | $ | 287,201 | $ | 204,487 | $ | 767,124 | ||||
| Specialty reinsurance |
109,567 | 93,280 | 448,756 | 651,603 | ||||||||
| Total Reinsurance |
385,003 | 380,481 | 653,243 | 1,418,727 | ||||||||
| Individual Risk |
237,747 | 10,359 | 361,663 | 609,769 | ||||||||
| Total |
$ | 622,750 | $ | 390,840 | $ | 1,014,906 | $ | 2,028,496 | ||||
Our estimates of claims and claim expense reserves are not precise in that, among other matters, they are based on predictions of future developments and estimates of future trends and other variable factors. Some, but not all, of our reserves are further subject to the uncertainty inherent in actuarial methodologies and estimates. Because a reserve estimate is simply an insurers estimate at a point in time of its ultimate liability, and because there are numerous factors which affect reserves and claims payments but cannot be determined with certainty in advance, our ultimate payments will vary, perhaps materially, from our estimates of reserves. If we determine in a subsequent period that adjustments to our previously established reserves are appropriate, such adjustments are recorded in the period in which they are identified. During the twelve months ended December 31, 2008, 2007 and 2006, changes to prior year estimated claims reserves increased our net income by $234.8 million, $233.2 million and $136.6 million, respectively, excluding the consideration of changes in reinstatement premium, profit commissions, DaVinciRe minority interest and income tax expense.
Our reserving methodology for each line of business uses a loss reserving process that calculates a point estimate for the Companys ultimate settlement and administration costs for claims and claim expenses. We do not calculate a range of estimates. We use this point estimate, along with paid claims and case reserves, to record our best estimate of additional case reserves and IBNR in our financial statements. Under GAAP, we are not permitted to establish estimates for catastrophe claims and claim expense reserves until an event occurs that gives rise to a loss.
Reserving for our reinsurance claims involves other uncertainties, such as the dependence on information from ceding companies, which among other matters, includes the time lag inherent in reporting information from the primary insurer to us or to our ceding companies and differing reserving practices among ceding companies. The information received from ceding companies is typically in the form of bordereaux, broker notifications of loss and/or discussions with ceding companies or their brokers. This information can be received on a monthly, quarterly or transactional basis and normally includes estimates of paid claims and case reserves. We sometimes also receive an estimate or provision for IBNR. This information is often updated and adjusted from time-to-time during the loss settlement period as new data or facts in respect of initial claims, client accounts, industry or event trends may be reported or emerge in addition to changes in applicable statutory and case laws.
Included in our results for 2008 are $468.0 million of net claims and claim expenses incurred as a result of losses arising from hurricanes Gustav and Ike which struck the United States in the third quarter of 2008. Our estimates of losses from hurricanes Gustav and Ike are based on factors including currently available information derived from the Companys preliminary claims information from certain clients and brokers,
71
Table of Contents
industry assessments of losses from the events, proprietary models, and the terms and conditions of our contracts. Given the magnitude and recent occurrence of these events, meaningful uncertainty remains regarding total covered losses for the insurance industry and, accordingly, several of the key assumptions underlying our loss estimates. In addition, actual losses from these events may increase if our reinsurers or other obligors fail to meet their obligations. Our actual losses from these events will likely vary, perhaps materially, from these current estimates due to the inherent uncertainties in reserving for such losses, including the preliminary nature of the available information, the potential inaccuracies and inadequacies in the data provided by clients and brokers, the inherent uncertainty of modeling techniques and the application of such techniques, the effects of any demand surge on claims activity and complex coverage and other legal issues.
Included in our results for 2007 are $157.5 million of net claims and claim expenses from Kyrill and the U.K. flood losses which occurred in 2007, as well as $60.0 million in estimated losses associated with exposure to sub-prime related casualty losses. Estimates of these losses are based on a review of potentially exposed contracts, information reported by and discussions with counterparties, and the Companys estimate of losses related to those contracts and are subject to change as more information is reported and becomes available. Such information is frequently reported more slowly, and with less initial accuracy, with respect to non-U.S. events such as Kyrill and the U.K. floods than with large U.S. catastrophe losses. In addition, the sub-prime related casualty net claims and claim expenses are based on underlying liability contracts which are considered long-tail business, and will therefore take many years before the actual losses are known and reported, which increases the uncertainty with respect to the estimate for ultimate losses for this event. The net claims and claim expenses from Kyrill, the U.K. floods and sub-prime related casualty losses are all attributable to the Companys Reinsurance segment.
During 2005, we incurred significant losses from hurricanes Katrina, Rita and Wilma. Our estimates of these losses are based on factors including currently available information derived from claims information from our clients and brokers, industry assessments of losses from the events, proprietary models and the terms and conditions of our contracts. In particular, due to the size and unusual complexity of certain legal and claims issues, particularly but not exclusively relating to hurricane Katrina, meaningful uncertainty remains regarding total covered losses for the insurance industry and, accordingly, our loss estimates. Our actual losses from these events will likely vary, perhaps materially, from our current estimates due to the inherent uncertainties in reserving for such losses, the potential inaccuracies and inadequacies in the data provided by clients and brokers, the inherent uncertainty of modeling techniques and the application of such techniques, and complex coverage and other legal issues.
Because of the inherent uncertainties discussed above, we have developed a reserving philosophy which attempts to incorporate prudent assumptions and estimates, and we have generally experienced favorable development on prior year reserves in the last several years. However, there is no assurance that this will occur in future periods.
Our reserving techniques, assumptions and processes differ between our Reinsurance and Individual Risk segments, as well as between our property catastrophe reinsurance and specialty reinsurance businesses within our Reinsurance segment. Following is a discussion of the risks we insure and reinsure, the reserving techniques, assumptions and processes we follow to estimate our claims and claim expense reserves, and our current estimates versus our initial estimates of our claims reserves, for each of these units.
Reinsurance Segment
Property Catastrophe Reinsurance
Within our property catastrophe reinsurance unit, we principally write property catastrophe excess of loss reinsurance contracts to insure insurance and reinsurance companies against natural and man-made catastrophes. Under these contracts, we indemnify an insurer or reinsurer when its aggregate paid claims and claim expenses from a single occurrence of a covered peril exceed the attachment point specified in the contract, up to an amount per loss specified in the contract. Our most significant exposure is to losses from earthquakes and hurricanes and other windstorms, although we are also exposed to claims arising from other catastrophes, such as tsunamis, freezes, floods, fires, tornadoes, explosions and acts of
72
Table of Contents
terrorism. Our predominant exposure under such coverage is to property damage. However, other risks, including business interruption and other non-property losses, may also be covered under our property catastrophe reinsurance contracts when arising from a covered peril. Our coverages are offered on either a worldwide basis or are limited to selected geographic areas.
Coverage can also vary from all property perils to limited coverage on selected perils, such as earthquake only coverage. We also enter into retrocessional contracts that provide property catastrophe coverage to other reinsurers or retrocedants. This coverage is generally in the form of excess of loss retrocessional contracts and may cover all perils and exposures on a worldwide basis or be limited in scope to selected geographic areas, perils and/or exposures. The exposures we assume from retrocessional business can change within a contract term as the underwriters of a retrocedant may alter their book of business after the retrocessional coverage has been bound. We also offer dual trigger reinsurance contracts which require us to pay claims based on claims incurred by insurers and reinsurers in addition to the estimate of insured industry losses as reported by referenced statistical reporting agencies.
Our property catastrophe reinsurance business is generally characterized by loss events of low frequency and high severity. Initial reporting of paid and incurred claims in general, tends to be relatively prompt. We consider this business short-tail as compared to the reporting of claims for long-tail products, which tends to be slower. However, the timing of claims payment and reporting also varies depending on various factors, including: whether the claims arise under reinsurance of primary insurance companies or reinsurance of other reinsurance companies; the nature of the events (e.g., hurricanes, earthquakes or terrorism); the geographic area involved; post-event inflation which may cause the cost to repair damaged property to increase significantly from current estimates, or for property claims to remain open for a longer period of time, due to limitations on the supply of building materials, labor and other resources; and the quality of each clients claims management and reserving practices. Managements judgments regarding these factors are reflected in our claims reserve estimates.
Reserving for substantially all of our property catastrophe reinsurance business does not involve the use of traditional actuarial techniques. Rather, claims and claim expense reserves are estimated by management after a catastrophe occurs by completing an in-depth analysis of the individual contracts which may potentially be impacted by the catastrophic event. The in-depth analysis generally involves: 1) estimating the size of insured industry losses from the catastrophic event; 2) reviewing our portfolio of reinsurance contracts to identify those contracts which are exposed to the catastrophic event; 3) reviewing information reported by clients and brokers; 4) discussing the event with our clients and brokers; and 5) estimating the ultimate expected cost to settle all claims and administrative costs arising from the catastrophic event on a contract-by-contract basis and in aggregate for the event. Once an event has occurred, during the then current reporting period we record our best estimate of the ultimate expected cost to settle all claims arising from the event. Our estimate of claims and claim expense reserves is then determined by deducting cumulative paid losses from our estimate of the ultimate expected loss for an event and our estimate of IBNR is determined by deducting cumulative paid losses, case reserves and additional case reserves from our estimate of the ultimate expected loss for an event. Once we receive a notice of loss or payment request under a catastrophe reinsurance contract, we are generally able to process and pay such claims promptly.
Because the events from which claims arise under policies written by our property catastrophe reinsurance business are typically prominent, public occurrences such as hurricanes and earthquakes, we are often able to use independent reports as part of our loss reserve estimation process. We also review catastrophe bulletins published by various statistical reporting agencies to assist us in determining the size of the industry loss, although these reports may not be available for some time after an event. In addition to the loss information and estimates communicated by cedants and brokers, we also use industry information which we gather and retain in our REMS© modeling system. The information stored in our REMS© modeling system enables us to analyze each of our policies in relation to a loss and compare our estimate of the loss with those reported by our policyholders. The REMS© modeling system also allows us to compare and analyze individual losses reported by policyholders affected by the same loss event. Although the REMS© modeling system assists with the analysis of the underlying loss and provides us with the information and ability to perform increased analysis, the estimation of claims resulting from catastrophic events is inherently difficult because of the variability and uncertainty associated with property catastrophe claims and the unique characteristics of each loss.
73
Table of Contents
For smaller events including localized severe weather events such as windstorms, hail, ice, snow, flooding, freezing and tornadoes, which are not necessarily prominent, public occurrences, we initially place greater reliance on catastrophe bulletins published by statistical reporting agencies to assist us in determining what events occurred during the reporting period than we do for large events. This includes reviewing Catastrophe Bulletins published by Property Claim Services for U.S. catastrophes. We set our initial estimates of reserves for claims and claim expenses for these smaller events based on a combination of our historical market share for these types of losses and the estimate of the total insured industry property losses as reported by statistical reporting agencies, although we generally make significant adjustments based on our current exposure to the geographic region involved as well as the size of the loss and the peril involved. This approach supplements our approach for estimating losses for larger catastrophes, which as discussed above, includes discussions with brokers and ceding companies, reviewing individual contracts impacted by the event, and modeling the loss in our REMS© system.
In general, our property catastrophe reinsurance reserves for our more recent reinsured catastrophic events are subject to greater uncertainty and, therefore, greater potential variability, and are likely to experience material changes from one period to the next. This is due to the uncertainty as to the size of the industry losses from the event, uncertainty as to which contracts have been exposed to the catastrophic event, uncertainty due to complex legal and coverage issues that can arise out of large or complex catastrophic events such as the events of September 11, 2001 and hurricane Katrina, and uncertainty as to the magnitude of claims incurred by our clients. As our property catastrophe reinsurance claims age, more information becomes available and we believe our estimates become more certain, although there is no assurance this trend will continue in the future. As seen in the Actual vs. Initial Estimated Property Catastrophe Reinsurance Claims and Claim Expense Reserve Analysis table below, 68.8% of our inception to date claims and claim expenses in our property catastrophe reinsurance unit were incurred in the 2004, 2005 and 2008 accident years, due principally to the losses from hurricanes Charley, Frances, Ivan, Jeanne, Katrina, Rita, Wilma, Gustav and Ike. Due to the size and complexity of the losses in these accident years, there still remains significant uncertainty as to the ultimate settlement costs associated with these accident years.
Within our property catastrophe reinsurance business, we seek to review substantially all of our claims and claim expense reserves quarterly. Our quarterly review procedures include identifying events that have occurred up to the latest balance sheet date, determining our best estimate of the ultimate expected cost to settle all claims and administrative costs associated with those new events which have arisen during the reporting period, and reviewing the ultimate expected cost to settle claims and administrative costs associated with those events which occurred during previous periods. This process is judgmental in that it involves reviewing changes in paid and reported losses each period and adjusting our estimates of the ultimate expected losses for each event if there are developments that are different from our previous expectations. If we determine that adjustments to an earlier estimate are appropriate, such adjustments are recorded in the period in which they are identified. During the twelve months ended December 31, 2008, 2007 and 2006, changes to our prior year estimated claims reserves in our property catastrophe reinsurance unit increased our net income by $131.6 million, increased our net income $93.1 million, and decreased our net income by $13.9 million, respectively, excluding the consideration of changes in reinstatement premium, profit commissions, minority interest and income tax expense.
Actual Results vs. Initial Estimates
The table below summarizes our initial assumptions and changes in those assumptions for claims and claim expense reserves within our property catastrophe reinsurance unit. As discussed above, the key assumption in estimating reserves for our property catastrophe reinsurance unit is our estimate of ultimate claims and claim expenses. The table shows our initial estimates of ultimate claims and claim expenses for each accident year and how these initial estimates have developed over time. The initial estimate of accident year claims and claim expenses represents our estimate of the ultimate settlement and administration costs for claims incurred from catastrophic events occurring during a particular accident year, and as reported as of December 31 of that year. The re-estimated ultimate claims and claim expenses as of December 31, 2006, 2007 and 2008, represent our revised estimates as reported as of those dates. The cumulative favorable (adverse) development shows how our most recent estimates as reported at
74
Table of Contents
December 31, 2008 differ from our initial accident year estimates. Favorable development implies that our current estimates are lower than our initial estimates while adverse development implies that our current estimates are higher than our original estimates. Total reserves as of December 31, 2008 reflect the unpaid portion of our estimates of ultimate claims and claim expenses. The table is presented on a gross basis and therefore does not include the benefit of reinsurance recoveries. It also does not consider the impact of loss related premium or DaVinciRe minority interest.
Actual vs. Initial Estimated Property Catastrophe Reinsurance Claims and Claim Expense Reserve Analysis
| (in thousands, except percentages)
Accident Year |
Initial Estimate of Accident Year Claims and Claim Expenses |
Re-estimated Claims and Claim Expenses as of December 31, |
Cumulative Favorable (Adverse) Development |
% Decrease (Increase) of Current Ultimate |
Claims and Claim Expense Reserves as of December 31, 2008 |
% of Claims and Claim Expenses Unpaid as of December 31, 2008 |
||||||||||||||||||
| 2006 | 2007 | 2008 | ||||||||||||||||||||||
| 1994 |
$ | 100,816 | $ | 137,623 | $ | 137,491 | $ | 137,396 | $ | (36,580) | (36.3) | % | $ | 2,624 | 1.9 | % | ||||||||
| 1995 |
72,561 | 64,236 | 64,234 | 64,086 | 8,475 | 11.7 | 489 | 0.8 | ||||||||||||||||
| 1996 |
67,671 | 45,955 | 45,868 | 45,855 | 21,816 | 32.2 | 4 | 0.0 | ||||||||||||||||
| 1997 |
43,050 | 7,213 | 7,200 | 7,203 | 35,847 | 83.3 | 21 | 0.3 | ||||||||||||||||
| 1998 |
129,171 | 154,943 | 154,797 | 154,701 | (25,530) | (19.8) | 3,251 | 2.1 | ||||||||||||||||
| 1999 |
267,981 | 215,420 | 209,540 | 207,884 | 60,097 | 22.4 | 10,827 | 5.2 | ||||||||||||||||
| 2000 |
54,600 | 19,334 | 19,118 | 18,793 | 35,807 | 65.6 | 683 | 3.6 | ||||||||||||||||
| 2001 |
257,285 | 226,261 | 225,486 | 220,220 | 37,065 | 14.4 | 28,747 | 13.1 | ||||||||||||||||
| 2002 |
155,573 | 75,967 | 74,589 | 73,353 | 82,220 | 52.8 | 9,805 | 13.4 | ||||||||||||||||
| 2003 |
126,312 | 79,099 | 77,042 | 76,736 | 49,576 | 39.2 | 9,513 | 12.4 | ||||||||||||||||
| 2004 |
762,392 | 857,537 | 851,586 | 846,652 | (84,260) | (11.1) | 46,445 | 5.5 | ||||||||||||||||
| 2005 |
1,473,974 | 1,501,226 | 1,461,140 | 1,380,484 | 93,490 | 6.3 | 180,279 | 13.1 | ||||||||||||||||
| 2006 |
121,754 | 121,754 | 77,093 | 63,153 | 58,601 | 48.1 | 3,561 | 5.6 | ||||||||||||||||
| 2007 |
245,892 | | 245,892 | 210,447 | 35,445 | 14.4 | 121,503 | 57.7 | ||||||||||||||||
| 2008 |
599,481 | | | 599,481 | | | 443,417 | 74.0 | ||||||||||||||||
| $ | 4,478,513 | $ | 3,506,568 | $ | 3,651,076 | $ | 4,106,444 | $ | 372,069 | 9.6 | % | $ | 861,169 | 21.0 | % | |||||||||
As quantified in the table above, since the inception of the Company in 1993 we have experienced $372.1 million of cumulative favorable development on the run-off of our gross reserves within our property catastrophe reinsurance unit. This represents 9.6% of our initial estimated gross claims and claim expenses for accident years 2007 and prior of $3.9 billion and is calculated based on our estimates of claims and claim expense reserves as of December 31, 2008, compared to our initial estimates of ultimate claims and claim expenses, as of the end of each accident year. As described above, given the complexity in reserving for claims and claims expenses associated with catastrophe losses for property catastrophe excess of loss reinsurance contracts, we have experienced development, both favorable and unfavorable, in any given accident year in amounts that exceed our inception to date percentage of 9.6%. For example, our 1997 accident year developed favorably by $35.8 million, which is 83.3% better than our initial estimates of claims and claim expenses for the 1997 accident year as estimated as of December 31, 1997, while our 1994 accident year developed unfavorably by $36.6 million, or 36.3%. On a net basis our cumulative favorable or unfavorable development is generally reduced by offsetting changes in our reinsurance recoverables, as well as changes to loss related premiums such as reinstatement premiums, and minority interest for changes in claims and claim expenses that impact DaVinciRe, all of which generally move in the opposite direction to changes in our ultimate claims and claim expenses.
The percentage of claims unpaid at December 31, 2008 for each accident year reflects both the speed at which claims and claim expenses for each accident year have been paid and our estimate of claims and claim expenses for that accident year. As seen above, claims and claim expenses for the 2004 accident year have to date been paid quickly compared to prior accident years. This is due to the fact that hurricanes Charley, Frances, Ivan and Jeanne which occurred in 2004 have been rapid claims paying events. This is driven in part by the mix of our business in Florida, which primarily includes property catastrophe excess of loss reinsurance for personal lines property coverage, rather than commercial
75
Table of Contents
property coverage or retrocessional coverage, and the speed of the settlement and payment of claims by our underlying cedants. In contrast, our 2001 accident year, which includes losses from the events of September 11, 2001, and our 2005 accident year, which includes significant losses from hurricane Katrina, includes a higher mix of commercial business and retrocessional coverage where the underlying claims of our cedants tend to be settled and paid more slowly. In addition, claims from our underlying cedants for the 2001 and 2005 accident years are subject to more complex coverage and legal matters due to the complexity of the catastrophic events taking place in those years.
Sensitivity Analysis
The table below shows the impact on our ultimate claims and claim expenses, net income and shareholders equity as of and for the year ended December 31, 2008 of reasonably likely changes to our estimates of ultimate losses for claims and claim expenses incurred from catastrophic events within our property catastrophe reinsurance business unit. The reasonably likely changes are based on an historical analysis of the period-to-period variability of our ultimate costs to settle claims from catastrophic events, giving due consideration to changes in our reserving practices over time. In general, our claim reserves for our more recent catastrophic events are subject to greater uncertainty and, therefore, greater variability and are likely to experience material changes from one period to the next. This is due to the uncertainty as to the size of the industry losses from the event, uncertainty as to which contracts have been exposed to the catastrophic event, and uncertainty as to the magnitude of claims incurred by our clients. As our claim reserves age, more information becomes available and we believe our estimates become more certain, although there is no assurance this trend will continue in the future. As a result, the sensitivity analysis below is based on the age of each accident year, our current estimated ultimate claims and claim expenses for the catastrophic events occurring in each accident year, and the reasonably likely variability of our current estimates of claims and claim expenses by accident year. The impact on net income and shareholders equity assumes no increase or decrease in reinsurance recoveries, loss related premium or DaVinciRe minority interest.
Property Catastrophe Reinsurance Claims and Claim Expense Reserve Sensitivity Analysis
| (in thousands, except percentages) | ||||||||||||||||
| Ultimate Claims and Claim Expenses as of December 31, 2008 |
$ Impact of Change in Ultimate Claims and Claim Expenses as of December 31, 2008 |
% Impact of Change in Ultimate Claims and Claim Expenses as of December 31, 2008 |
% Impact of Change on Net Income for the Year Ended December 31, 2008 |
% Impact of Change on Shareholders Equity as of December 31, 2008 |
||||||||||||
| Higher |
$ | 4,457,413 | $ | 350,969 | 8.5 | % | (1209.4 | %) | (11.6 | %) | ||||||
| Recorded |
4,106,444 | | | | | |||||||||||
| Lower |
$ | 3,755,475 | $ | (350,969 | ) | (8.5 | %) | 1209.4 | % | 11.6 | % | |||||
We believe the changes we made to our estimated ultimate claims and claim expenses represent reasonably likely outcomes. While we believe these are reasonably likely outcomes, we do not believe the reader should consider the above sensitivity analysis an actuarial reserve range. In addition, the sensitivity analysis only reflects reasonably likely changes in our underlying assumptions. It is possible that our estimated ultimate claims and claim expenses could be significantly higher or lower than the sensitivity analysis described above. For example, we could be liable for events for which we have not estimated claims and claim expenses or for exposures we do not currently believe are covered under our policies. These changes could result in significantly larger changes to our estimated ultimate claims and claim expenses, net income and shareholders equity than those noted above. We also caution the reader that the above sensitivity analysis is not used by management in developing our reserve estimates and is also not used by management in managing the business.
76
Table of Contents
Specialty Reinsurance
Within our specialty reinsurance business unit we write a number of reinsurance lines such as catastrophe exposed workers compensation, surety, terrorism, medical malpractice, catastrophe exposed personal lines property, casualty clash, property per risk, catastrophe exposed personal lines property and other specialty lines of reinsurance, which we collectively refer to as specialty reinsurance. We offer our specialty reinsurance products principally on an excess of loss basis, as described above with respect to our property catastrophe reinsurance products, and we also provide some proportional coverage. In a proportional reinsurance arrangement (also referred to as quota share reinsurance or pro-rata reinsurance), the reinsurer shares a proportional part of the original premiums and losses of the reinsured. We offer our specialty reinsurance products to insurance companies and other reinsurance companies and provide coverage for specific geographic regions or on a worldwide basis. We expanded our specialty reinsurance business in 2002 and have increased our presence in the specialty reinsurance market since that time.
Our specialty reinsurance business can generally be characterized as providing coverage for low frequency and high severity losses, similar to our property catastrophe reinsurance business. As with our property catastrophe reinsurance business, our specialty reinsurance contracts frequently provide coverage for relatively large limits or exposures. As a result of the foregoing, our specialty reinsurance business is subject to significant claims volatility. In periods of low claims frequency or severity, our results will generally be favorably impacted while in periods of high claims frequency or severity our results will generally be negatively impacted.
Our processes and methodologies in respect of loss estimation for the coverages we offer through our specialty reinsurance operation differ from those used for our property catastrophe-oriented coverages. For example, our specialty reinsurance coverages are more likely to be impacted by factors such as long-term inflation and changes in the social and legal environment, which we believe gives rise to greater uncertainty in our claims reserves. Moreover, in reserving for our specialty reinsurance coverages we do not have the benefit of a significant amount of our own historical experience in these lines. We believe this makes our specialty reinsurance reserving subject to greater uncertainty than our property catastrophe reinsurance unit.
When initially developing our reserving techniques for our specialty reinsurance coverages, we considered estimating reserves utilizing several actuarial techniques such as paid and incurred development methods. We elected to use the Bornhuetter-Ferguson actuarial technique because this method is appropriate for lines of business, such as our specialty reinsurance business, where there is a lack of historical claims experience. This method allows for greater weight to be applied to expected results in periods where little or no actual experience is available, and, hence, is less susceptible to the potential pitfall of being excessively swayed by one year or one quarter of actual paid and/or reported loss data. This method uses initial expected loss ratio expectations to the extent that losses are not paid or reported, and it assumes that past experience is not fully representative of the future. As the Companys reserves for claims and claim expenses age, and actual claims experience becomes available, this method places less weight on expected experience and places more weight on actual experience. We reevaluate our actuarial reserving techniques on a periodic basis.
The utilization of the Bornhuetter-Ferguson actuarial technique requires us to estimate an expected ultimate claims and claim expense ratio and select an expected loss reporting pattern. We select our estimates of the expected ultimate claims and claim expense ratios and expected loss reporting patterns by reviewing industry standards and adjusting these standards based upon the terms of the coverages we offer. The estimated expected claims and claim expense ratio may be modified to the extent that reported losses at a given point in time differ from what would be expected based on the selected loss reporting pattern. Our estimate of IBNR is the product of the premium we have earned, the initial expected ultimate claims and claim expense ratio and the percentage of estimated unreported losses. In addition, certain of our specialty reinsurance coverages may be impacted by natural and man-made catastrophes. We estimate claim reserves for these losses after the event giving rise to these losses occur, following a process that is similar to our property catastrophe reinsurance unit described above.
77
Table of Contents
Within our specialty reinsurance business, we seek to review substantially all of our claims and claim expense reserves quarterly. Typically, our quarterly review procedures include reviewing paid and reported claims in the most recent reporting period, reviewing the development of paid and reported claims from prior periods, and reviewing our overall experience by underwriting year and in the aggregate. We monitor our expected ultimate claims and claim expense ratios and expected loss reporting assumptions on a quarterly basis and compare them to our actual experience. These actuarial assumptions are generally reviewed annually, based on input from our actuaries, underwriters, claims personnel and finance professionals, although adjustments may be made more frequently if needed. Assumption changes are made to adjust for changes in the pricing and terms of coverage we provide, changes in industry standards, as well as our actual experience, to the extent we have enough data to rely on our own experience. If we determine that adjustments to an earlier estimate are appropriate, such adjustments are recorded in the period in which they are identified. During the twelve months ended December 31, 2008, 2007 and 2006, changes to our prior year estimated claims reserves in our specialty reinsurance unit increased our net income by $56.5 million, $101.3 million and $139.2 million, respectively, excluding the consideration of changes in reinstatement premium, profit commissions, DaVinciRe minority interest and income tax expense.
Actual Results vs. Initial Estimates
The Actual vs. Initial Estimated Ultimate Claims and Claim Expense Ratio table below summarizes our key actuarial assumptions in reserving for our specialty reinsurance business. As noted above, the key actuarial assumptions include the estimated ultimate claims and claim expense ratios and the estimated loss reporting patterns. The table shows our initial estimates of the ultimate claims and claim expense ratio by underwriting year. The table shows how our initial estimates of these ratios have developed over time, with the re-estimated ratios reflecting a combination of the amount and timing of paid and reported losses compared to our initial estimates. The initial estimate is based on the actuarial assumptions that were in place at the end of that year. A decrease in the ultimate claims and claim expense ratio implies that our current estimates are lower than our initial estimates while an increase in the ultimate claims and claim expense ratio implies that our current estimates are higher than our initial estimates. The result would be a corresponding favorable impact on shareholders equity and net income or a corresponding unfavorable impact on shareholders equity and net income, respectively. The table also shows how our initial estimated ultimate claims and claim expense ratios have changed from one underwriting year to the next. The table below reflects a summary of the weighted average assumptions for all classes of business written within our specialty reinsurance unit. The table is presented on a gross loss basis and therefore does not include the benefit of reinsurance recoveries or loss related premium.
Actual vs. Initial Estimated Specialty Reinsurance Claims and Claim Expense Reserve AnalysisEstimated Ultimate Claims and Claim Expense Ratio
| Estimated Ultimate Claims and Claim Expenses Ratio | ||||||||||||
| Underwriting Year |
Initial Estimate | Re-estimate as of | ||||||||||
| December 31, 2006 | December 31, 2007 | December 31, 2008 | ||||||||||
| 2002 |
77.2 | % | 29.7 | % | 24.4 | % | 24.7 | % | ||||
| 2003 |
76.8 | 31.1 | 28.5 | 30.3 | ||||||||
| 2004 |
78.2 | 58.7 | 49.8 | 46.1 | ||||||||
| 2005 |
78.2 | 55.4 | 49.3 | 42.4 | ||||||||
| 2006 |
76.6 | 57.6 | 59.5 | 55.1 | ||||||||
| 2007 |
62.9 | | 91.9 | 73.9 | ||||||||
| 2008 |
57.9 | | | 89.4 | ||||||||
The table above shows our initial estimated ultimate claims and claim expense ratios for attritional losses for each new underwriting year within our specialty reinsurance unit as of the end of each calendar year. Until 2007, our initial estimated ultimate remained relatively constant between 76.6% in 2006 and 78.2% in 2004 and 2005. This reflects the fact that management had not made significant changes to its initial estimates of expected ultimate claims and claim expense ratios from one underwriting year to the next. The principal reason for the modest changes from one underwriting year to the next is that the mix of business
78
Table of Contents
has changed. For example, the mix of business for the 2007 and 2008 underwriting years have a lower initial expected ultimate claims and claim expense ratio than in prior years as it is more heavily weighted to business that is expected to produce a lower level of losses. The decrease in the initial estimated ultimate claims and claim expense ratio from 2006 to 2008 also reflects assumption changes made for certain classes of business where our experience, and the industry experience in general, has been better than expected and, as a result, we decreased our initial estimated ultimate claims and claim expense ratio for these classes of business.
As each underwriting year has developed, our re-estimated expected ultimate claims and claim expense ratios have changed. In particular, our re-estimated ultimate claims and claim expense ratios have decreased significantly from the initial estimates for the 2002 through 2005 underwriting years. This was principally due to our 2005 reserve review. During our 2005 reserve review, we further segmented the specialty business with the aim of grouping risks into more homogeneous categories which respond to the evolution of actual exposures. This became possible as the volume of this business increased over the three preceding years. This further segmentation required the selection of loss reporting patterns to be applied to these new groups. We also updated our assumptions for our original loss reporting patterns based on a combination of new industry information and actual experience accumulated over the three preceding years. The assumptions for the new loss reporting patterns were applied to all prior underwriting years. In addition, we made explicit allowances for commuted contracts whereas previously these were considered in the overall reserving assumptions. We also reviewed substantially all of our case reserves and additional case reserves. The result of the foregoing was a decrease in our specialty reinsurance re-estimated ultimate claims and claim expense reserves in 2005. Subsequent to this reserve review, the results of our specialty book of business have been mixed. The 2006 underwriting year includes favorable development as actual paid and reported losses during 2006 have been less than expected, which has resulted in a reduction in our expected ultimate claims and claim expense ratio for this year. However, the 2008 and 2007 underwriting years have performed worse than expected and our current estimates are significantly higher than our initial estimates. This is due in part to the losses in our casualty clash line of business in 2008 and 2007, associated with exposure to the deterioration of the credit and capital markets in 2008 as well the Madoff matter discovered in the fourth quarter of 2008 and with sub-prime exposure in 2007. As noted above, our specialty reinsurance business is characterized by events of low frequency and high severity which results in actual experience that can be significantly better or worse than long term trends or industry standards may imply.
As noted above, some of our specialty reinsurance contracts are exposed to net claims and claim expenses from large natural and man-made catastrophes. Net claims and claim expenses from these large catastrophes are reserved for after the events which gave rise to the claims in a manner which is consistent with our property catastrophe reinsurance reserving practices as discussed above. The large catastrophes occurring during the period from 2003 to 2008 impacting our specialty unit principally include hurricanes Katrina, Rita and Wilma, which occurred in 2005. Our estimate of ultimate net claims and claim expenses from hurricanes Katrina, Rita and Wilma, within our specialty reinsurance unit, net of reinsurance recoveries and assumed and ceded loss related premium, totaled $98.8 million, $77.1 million, $73.1 million and $73.1 million at December 31, 2005, 2006, 2007 and 2008, respectively.
Sensitivity Analysis
The table below quantifies the impact on our reserves for claims and claim expenses, net income and shareholders equity as of and for the year ended December 31, 2008 of reasonably likely changes to the actuarial assumptions used to estimate our December 31, 2008 claims and claim expense reserves within our specialty reinsurance business unit. The table quantifies reasonably likely changes in our initial estimated ultimate claims and claim expense ratios and estimated loss reporting patterns. The changes to the initial estimated ultimate claims and claim expense ratios represent percentage increases or decreases to our current estimated ultimate claims and claim expense ratios. The change to the reporting patterns represent claims reporting that is both faster and slower than our current estimated claims reporting patterns. The impact on net income and shareholders equity assumes no increase or decrease in reinsurance recoveries, loss related premium or DaVinciRe minority interest.
79
Table of Contents
Specialty Reinsurance Claims and Claim Expense Reserve Sensitivity Analysis
| (in thousands, except percentages) | |||||||||||||||
| Estimated Ultimate Claims and Claim Expense Ratio |
Estimated Loss Reporting Pattern |
$ Impact of Change in Reserves for Claims and Claim Expenses as of December 31, 2008 |
% Impact of Change in Reserves for Claims and Claim Expenses as of December 31, 2008 |
% Impact of Change in Net Income for the Year Ended December 31, 2008 |
% Impact of Change in Shareholders Equity as of December 31, 2008 |
||||||||||
| Increase expected claims and claim expense ratio by 25% |
Slower reporting | $ | 229,588 | 36.1% | (791.1% | ) | (7.6% | ) | |||||||
| Increase expected claims and claim expense ratio by 25% |
Expected reporting | 96,837 | 15.2% | (333.7% | ) | (3.2% | ) | ||||||||
| Increase expected claims and claim expense ratio by 25% |
Faster reporting | (14,578 | ) | (2.3% | ) | 50.2% | 0.5% | ||||||||
| Expected claims and claim expense ratio |
Slower reporting | 106,201 | 16.7% | (366.0% | ) | (3.5% | ) | ||||||||
| Expected claims and claim expense ratio |
Expected reporting | | | | | ||||||||||
| Expected claims and claim expense ratio |
Faster reporting | (89,132 | ) | (14.0% | ) | 307.1% | 2.9% | ||||||||
| Decrease expected claims and claim expense ratio by 25% |
Slower reporting | (17,187 | ) | (2.7% | ) | 59.2% | .6% | ||||||||
| Decrease expected claims and claim expense ratio by 25% |
Expected reporting | (96,837 | ) | (15.2% | ) | 333.7% | 3.2% | ||||||||
| Decrease expected claims and claim expense ratio by 25% |
Faster reporting | $ | (163,686 | ) | (25.7% | ) | 564.0% | 5.4% | |||||||
We believe that ultimate claims and claim expense ratios 25.0% above or below our estimated assumptions constitute reasonably likely changes. In addition, we believe that the adjustments that we made to speed up or slow down our estimated loss reporting patterns are reasonably likely changes. While we believe these are reasonably likely changes, we do not believe the reader should consider the above sensitivity analysis an actuarial reserve range. In addition, we caution the reader that the above sensitivity analysis only reflects reasonably likely changes. It is possible that our initial estimated claims and claim expense ratios and loss reporting patterns could be significantly different from the sensitivity analysis described above. For example, we could be liable for events which we have not estimated reserves for or for exposures we do not currently think are covered under our contracts. These changes could result in significantly larger changes to reserves for claims and claim expenses, net income and shareholders equity than those noted above. We also caution the reader that the above sensitivity analysis is not used by management in developing our reserve estimates and is also not used by management in managing the business.
Individual Risk Segment
We define our Individual Risk segment to include underwriting that involves understanding the characteristics of the underlying insurance policy. Our principal contracts include insurance policies and quota share reinsurance with respect to risks including: 1) multi-peril crop, which includes multi-peril crop insurance, crop hail and other named peril agriculture risk management products; 2) commercial property, which principally includes catastrophe-exposed commercial property products; 3) commercial multi-line, which includes commercial property and liability coverage, such as general liability, automobile liability and physical damage, building and contents, professional liability and various specialty products; and 4) personal lines property, which principally includes homeowners personal lines property coverage and catastrophe exposed personal lines property coverage.
80
Table of Contents
We use the Bornhuetter-Ferguson actuarial technique to estimate claims and claim expenses within our Individual Risk segment. The comments discussed above relating to our reserving techniques and processes for our specialty reinsurance unit also apply to our Individual Risk segment. In addition, certain of our coverages may be impacted by natural and man-made catastrophes. We estimate claim reserves for these losses after the event giving rise to these losses occurs, following a process that is similar to our property catastrophe reinsurance unit described above.
During the twelve months ended December 31, 2008, 2007 and 2006, changes to our prior year estimated claims reserves in our Individual Risk unit increased our net income by $46.7 million, $38.8 million and $11.3 million, respectively, excluding the consideration of changes in reinstatement premium, profit commissions and income tax expense.
Actual Results vs. Initial Estimates
The Actual vs. Initial Estimated Ultimate Claims and Claim Expense Ratio table below summarizes our key actuarial assumptions in reserving for our Individual Risk segment. As noted above, the key actuarial assumptions include the estimated ultimate claims and claim expense ratios and the estimated loss reporting patterns. The table shows our initial estimates of the ultimate claims and claim expense ratios by accident year. The table shows how our initial estimates of these ratios have developed over time with the re-estimated ratios reflecting a combination of the amount and timing of paid and reported losses compared to our initial estimates. The initial estimate is based on the actuarial assumptions that were in place at the end of that year. A decrease in the ultimate claims and claim expense ratio implies that our current estimates are lower than our initial estimates while an increase in the ultimate claims and claim expense ratio implies that our current estimates are higher than our initial estimates. The result would be a corresponding favorable impact on shareholders equity and net income or a corresponding unfavorable impact on shareholders equity and net income, respectively. The table also shows how our initial estimated ultimate claims and claim expense ratios have changed from one accident year to the next. The table below reflects a summary of the weighted average assumptions for all classes of business written within our Individual Risk segment. The table is presented on a gross loss basis and therefore does not include the benefit of reinsurance recoveries or loss related premium.
Actual vs. Initial Estimated Individual Risk Segment Claims and Claim Expense Reserve AnalysisEstimated Ultimate Claims and Claim Expense Ratio
| Estimated Expected Ultimate Claims and Claim Expense Ratio | ||||||||||||
| Accident Year |
Initial Estimate | Re-estimate as of | ||||||||||
| December 31, 2006 | December 31, 2007 | December 31, 2008 | ||||||||||
| 2003 |
55.3 | % | 38.2 | % | 38.0 | % | 37.3 | % | ||||
| 2004 |
59.2 | 48.9 | 48.1 | 46.3 | ||||||||
| 2005 |
51.9 | 49.5 | 49.1 | 48.4 | ||||||||
| 2006 |
55.8 | 54.1 | 51.8 | 50.2 | ||||||||
| 2007 |
55.9 | | 50.9 | 43.7 | ||||||||
| 2008 |
68.5 | | | 66.2 | ||||||||
The table above shows that our initial estimated ultimate claims and claim expense ratios for attritional losses for each new accident year within our Individual Risk segment as of the end of each calendar year, have historically stayed relatively constant between 2003 and 2007. This reflects the fact that management has not made significant changes to its estimated initial expected ultimate claims and claim expense ratio from one period to the next. The principal reason for the changes from one year to the next is that the mix of business has changed. For example, during 2008, our initial estimated ultimate claims and claim expense ratio increased relative to the preceding five years, as a result of the increase in our multi-peril crop insurance line of business which has a higher net claims and claim expenses ratio relative to the other lines of business within the Individual Risk segment and comprises a larger percentage of our overall Individual Risk premiums. As each accident year has developed, our re-estimated ultimate claims and claim expense ratios have generally been reduced. This reflects the impact of actual experience in our Individual Risk
81
Table of Contents
business where actual paid and reported losses to date for attritional losses are less than originally expected. As described above, under the Bornhuetter-Ferguson actuarial technique less weight is placed on initial estimates and more weight is placed on actual experience as our claims and claim expense reserves age.
As noted above, some of our Individual Risk contracts are exposed to net claims and claim expenses from large natural and man-made catastrophes. Net claims and claim expenses from these large catastrophes are reserved for after the event which gave rise to the claims in a manner which is consistent with our property catastrophe reinsurance reserving practices as discussed above. The large catastrophes occurring during the period from 2004 to 2008 principally include hurricanes Charley, Frances, Ivan and Jeanne in 2004, hurricanes Katrina, Rita and Wilma in 2005, and hurricanes Gustav and Ike in 2008. Our ultimate net claims and claim expenses from these events within our Individual Risk segment, net of reinsurance recoveries and assumed and ceded loss related premium, are shown in the table below.
| Estimated Net Claims and Claim Expenses | |||||||||||||||
| Events |
December 31, 2004 |
December 31, 2005 |
December 31, 2006 |
December 31, 2007 |
December 31, 2008 |
||||||||||
| (in thousands) | |||||||||||||||
| Charley, Frances, Ivan and Jeanne |
$ | 158,303 | $ | 182,327 | $ | 184,593 | $ | 185,829 | $ | 189,863 | |||||
| Katrina, Rita and Wilma |
| 140,080 | 134,953 | 131,620 | 127,874 | ||||||||||
| Gustav and Ike |
$ | | $ | | $ | | $ | | $ | 40,298 | |||||
Sensitivity Analysis
The table below quantifies the impact on our reserves for claims and claim expenses, net income and shareholders equity as of and for the year ended December 31, 2008 of reasonably likely changes to the actuarial assumptions used to estimate our December 31, 2008 claims and claim expense reserves within our Individual Risk segment. The table quantifies reasonably likely changes in our initial estimated ultimate claims and claim expense ratios and estimated loss reporting patterns. The changes to the initial estimated ultimate claims and claim expense ratios represent percentage increases or decreases to our current estimated ultimate claims and claim expense ratios. The change to the reporting patterns represent claims reporting that is both faster and slower than our current estimated reporting patterns. The impact on net income and shareholders equity assumes no increase or decrease in reinsurance recoveries or loss related premium and is before tax.
82
Table of Contents
Individual Risk Claims and Claim Expense Reserve Sensitivity Analysis
| (in thousands, except percentages) | |||||||||||||||
| Estimated Ultimate Claims and Claim |
Estimated Loss Reporting Pattern |
$ Impact of Change in Reserves for Claims and Claim Expenses as of December 31, 2008 |
% Impact of Change in Reserves for Claims and Claim Expenses as of December 31, 2008 |
% Impact of Change in Net Income for the Year Ended December 31, 2008 |
% Impact of Change in Shareholders Equity as of December 31, 2008 |
||||||||||
| Increase expected claims and claim expense ratio by 10% |
Slower reporting | $ | 113,126 | 17.1% | (389.8% | ) | (3.7% | ) | |||||||
| Increase expected claims and claim expense ratio by 10% |
Expected reporting | 39,488 | 6.0% | (136.1% | ) | (1.3% | ) | ||||||||
| Increase expected claims and claim expense ratio by 10% |
Faster reporting | (21,053 | ) | (3.2% | ) | 72.5% | 0.7% | ||||||||
| Expected claims and claim expense ratio |
Slower reporting | 67,676 | 10.2% | (233.2% | ) | (2.2% | ) | ||||||||
| Expected claims and claim expense ratio |
Expected reporting | | | | | ||||||||||
| Expected claims and claim expense ratio |
Faster reporting | (55,037 | ) | (8.3% | ) | 189.7% | 1.8% | ||||||||
| Decrease expected claims and claim expense ratio by 10% |
Slower reporting | 22,441 | 3.4% | (77.3% | ) | (0.7% | ) | ||||||||
| Decrease expected claims and claim expense ratio by 10% |
Expected reporting | (39,488 | ) | (6.0% | ) | 136.1% | 1.3% | ||||||||
| Decrease expected claims and claim expense ratio by 10% |
Faster reporting | $ | (89,021 | ) | (13.4% | ) | 306.8% | 2.9% | |||||||
We believe that ultimate claims and claim expense ratios 10.0% above or below our estimated assumptions constitute reasonably likely changes. In addition, we believe that the adjustments that we made to speed up or slow down our estimated loss reporting patterns are reasonably likely changes. While we believe these are reasonably likely changes, we do not believe the reader should consider the above sensitivity analysis an actuarial reserve range. In addition, we caution the reader that the above sensitivity analysis only reflects reasonably likely changes. It is possible that our initial estimated claims and claim expense ratios and loss reporting patterns could be significantly different from the sensitivity analysis described above. For example, we could be liable for events which we have not estimated reserves for or for exposures we do not currently think are covered under our contracts. These changes could result in significantly larger changes to our reserves for claims and claim expenses, net income and shareholders equity than those noted above. We also caution the reader that the above sensitivity analysis is not used by management in developing our reserve estimates and is also not used by management in managing the business.
Losses Recoverable
We enter into reinsurance agreements in order to help reduce our exposure to large losses and to help manage our risk portfolio. Amounts recoverable from reinsurers are estimated in a manner consistent with the claims and claim expense reserves associated with the related assumed reinsurance. For multi-year retrospectively rated contracts, we accrue amounts (either assets or liabilities) that are due to or from assuming companies based on estimated contract experience. If we determine that adjustments to earlier estimates are appropriate, such adjustments are recorded in the period in which they are determined.
The estimate of losses recoverable can be more subjective than estimating the underlying claims and claim expense reserves as discussed under the heading Claims and Claim Expense Reserves above. In particular, losses recoverable may be affected by deemed inuring reinsurance, industry losses reported by various statistical reporting services, and other factors. Losses recoverable on dual trigger reinsurance contracts require us to estimate our ultimate losses applicable to these contracts as well as estimate the
83
Table of Contents
ultimate amount of insured losses for the industry as a whole that will be reported by the applicable statistical reporting agency, as per the contract terms. In addition, the level of our additional case reserves and IBNR reserves has a significant impact on losses recoverable. These factors can impact the amount and timing of the losses recoverable to be recorded.
The majority of the balance we have accrued as recoverable will not be due for collection until some point in the future. The amounts recoverable ultimately collected are open to uncertainty due to the ultimate ability and willingness of reinsurers to pay our claims, for reasons including insolvency and elective run-off, contractual dispute and various other reasons. In addition, because the majority of the balances recoverable will not be collected for some time, economic conditions as well as the financial and operational performance of a particular reinsurer may change, and these changes may affect the reinsurers willingness and ability to meet their contractual obligations to us. To reflect these uncertainties, we estimate and record a valuation allowance for potential uncollectible losses recoverable which reduces losses recoverable and net earnings.
We estimate our valuation allowance by applying specific percentages against each recovery based on our counterpartys credit rating. The percentages applied are based on historical industry default statistics developed by major rating agencies and are then adjusted by us based on industry knowledge and our judgment and estimates. We also apply case-specific valuation allowances against certain recoveries that we deem unlikely to be collected in full. We then evaluate the overall adequacy of the valuation allowance based on other qualitative and judgmental factors. The valuation allowance recorded against losses recoverable was $8.7 million at December 31, 2008 (2007 $8.9 million). The reinsurers with the three largest balances accounted for 26.6%, 18.2% and 8.1%, respectively, of our losses recoverable balance at December 31, 2008 (2007 19.5%, 17.7% and 10.0%, respectively). The three largest company-specific components of the valuation allowance represented 40.5%, 23.0% and 9.6% of our total valuation allowance at December 31, 2008 (2007 39.4%, 22.5% and 10.5%).
Fair Value Measurements and Impairments
Fair Value
The use of fair value to measure certain assets and liabilities with resulting unrealized gains or losses, is pervasive within our financial statements, and is a critical accounting policy and estimate for us. Fair value is the price that would be received upon the sale of an asset or paid to transfer a liability in an orderly transaction between open market participants at the measurement date. We recognize unrealized gains and losses arising from changes in fair value in our statements of operations, with the exception of unrealized gains and losses on our fixed maturity investments available for sale, which currently are recognized as a component of accumulated other comprehensive income in shareholders equity.
The degree of judgment used in measuring the fair value of financial instruments generally correlates with the level of observable pricing inputs. Financial instruments with quoted prices in active markets require less judgment in measuring fair value. Conversely, financial instruments traded in other-than-active markets or that do not have quoted prices have less observability and are measured at fair value using valuation models or other pricing techniques that require more judgment. Observable pricing inputs are affected by a number of factors, including the type of financial instrument, whether the financial instrument is new to the market and not yet established, and the characteristics specific to the transaction and general market conditions.
Under FAS 157, assets and liabilities recorded at fair value in the consolidated balance sheet are classified in a hierarchy for disclosure purposes consisting of three levels based on the observability of inputs available to measure the fair value. The three levels of the fair value hierarchy under FAS 157 are described below:
| | Fair values determined by Level 1 inputs utilize unadjusted quoted prices obtained from active markets for identical assets or liabilities that the Company has access to. The fair value is determined by multiplying the quoted price by the quantity held by the Company; |
84
Table of Contents
| | Fair values determined by Level 2 inputs utilize inputs other than quoted prices included in Level 1 that are observable for the asset or liability, either directly or indirectly. Level 2 inputs include quoted prices for similar assets and liabilities in active markets, and inputs other than quoted prices that are observable for the asset or liability, such as interest rates and yield curves that are observable at commonly quoted intervals, broker quotes and certain pricing indices; and |
| | Level 3 inputs are based on unobservable inputs for the asset or liability, and include situations where there is little, if any, market activity for the asset or liability. In these cases, significant management assumptions can be used to establish managements best estimate of the assumptions used by other market participants in determining the fair value of the asset or liability. |
See Note 6. Fair Value Measurements in the Notes to the Consolidated Financial Statements for additional information about fair value measurements.
Below is a summary of the assets and liabilities that are measured at fair value on a recurring basis:
| At December 31, 2008 |
Total | Quoted Prices in Active Markets for Identical Assets (Level 1) |
Significant Other Observable Inputs (Level 2) |
Significant Unobservable Inputs (Level 3) |
||||||||||||
| (in thousands) | ||||||||||||||||
| Assets |
||||||||||||||||
| Fixed maturity investments available for sale |
$ | 2,996,885 | $ | 467,480 | $ | 2,529,405 | $ | | ||||||||
| Short term investments |
2,172,343 | | 2,172,343 | | ||||||||||||
| Other investments |
773,475 | | 391,395 | 382,080 | ||||||||||||
| Other secured assets |
76,424 | | 76,424 | | ||||||||||||
| Other (liabilities) and assets (1) |
(8,714 | ) | 31,167 | 2,631 | (42,512 | ) | ||||||||||
| $ | 6,010,413 | $ | 498,647 | $ | 5,172,198 | $ | 339,568 | |||||||||
| Percentage of total fair value assets and liabilities |
100.0 | % | 8.3 | % | 86.1 | % | 5.6 | % | ||||||||
| (1) | Other assets of $34.3 million, $29.9 million and $10.3 million are included in Level 1, Level 2 and Level 3, respectively. Other liabilities of $3.1 million, $27.3 million and $52.8 million are included in Level 1, Level 2 and Level 3, respectively. |
As at December 31, 2008, we classified $392.4 million and $52.8 million of assets and liabilities, respectively, at fair value on a recurring basis using Level 3 inputs. This represented 4.9% and 1.3% of our total assets and liabilities, respectively. Level 3 fair value measurements are based on valuation techniques that use at least one significant input that is unobservable. These measurements are made under circumstances in which there is little, if any, market activity for the asset or liability. We use valuation models or other pricing techniques that require a variety of inputs including contractual terms, market prices and rates, yield curves, credit curves, measures of volatility, prepayment rates and correlations of such inputs, some of which may be unobservable, to value these Level 3 assets and liabilities. Our assessment of the significance of a particular input to the fair value measurement in its entirety requires judgment. In making the assessment, we considered factors specific to the asset or liability. In certain cases, the inputs used to measure fair value of an asset or a liability may fall into different levels of the fair value hierarchy. In such cases, the level in the fair value hierarchy within which the fair value measurement in its entirety is classified is determined based on the lowest level input that is significant to the fair value measurement of the asset or liability.
Impairments
Fixed Maturity Investments Available For Sale
On a quarterly basis we assess whether declines in the fair value of our fixed maturity investments available for sale represent impairments that are other than temporary. There are several factors that we consider in the assessment of a security, which include (i) the time period during which there has been a significant
85
Table of Contents
decline below cost, (ii) the extent of the decline below cost, (iii) our intent and ability to hold the security, (iv) the potential for the security to recover in value, (v) an analysis of the financial condition of the issuer and (vi) an analysis of the collateral structure and credit support of the security, if applicable. Where we have determined that there is an other than temporary decline in the fair value of the security, the cost of the security is written down to its fair value and the unrealized loss at the time of determination is reflected in the consolidated statements of operations. After recording the other than temporary impairment charges, we then must determine which investments are impaired due to issuer credit risk. For investments which we do not expect to collect the full principal amount of the investment at maturity, we do not accrete the discount to par of these investments. For those impairments which are driven by other factors, such as changes in interest rates, we accrete the discount to par over the remaining expected average life of the investment as we expect to collect our principal if such investment is held to maturity.
The majority of our fixed maturity investments available for sale are currently managed by external investment managers in accordance with specific investment mandates and guidelines. The investment managers are currently directed to manage our investments to maximize total investment return in accordance with these investment mandates and guidelines. While we have adequate capital and liquidity to support our operations and to hold our fixed maturity investments available for sale which are in an unrealized loss position until they recover in value, we have not prohibited or restricted our investment managers from selling these investments and our investment managers actively trade our investments. We are therefore unable to represent or certify that we have the intent or ability to hold these investments until they recover in value. As a consequence, we have impaired principally all of our fixed maturity investments available for sale that were in an unrealized loss position at each quarterly reporting date throughout the three years presented. During the year ended December 31, 2008, the Company recorded $217.0 million in other than temporary impairment charges (2007 $25.5 million, 2006 $46.4 million) including impairment charges for which we believe we will not be able to recover the full principal amount if the impaired security is held to maturity, of $8.3 million (2007 $nil, 2006 $0.1 million). As of December 31, 2008 and 2007, the Company had essentially no fixed maturity investments available for sale in an unrealized loss position.
Investments in Other Ventures, Under Equity Method
Investments in which we have significant influence over the operating and financial policies of the investee are classified as investments in other ventures, under equity method, and are accounted for under the equity method of accounting. Under this method, the Company records its proportionate share of income or loss from such investments in its results for the period. Any decline in the value of investments in other ventures, under equity method, including goodwill and other intangible assets arising upon acquisition of the investee, considered by management to be other than temporary, is impaired and is reflected in our consolidated statements of operations in the period in which it is determined. As of December 31, 2008, the Company had $99.9 million (2007 $90.6 million) in investments in other ventures, under equity method on its consolidated balance sheets, including $8.5 million of goodwill and $41.3 million of other intangible assets (2007 $nil and $nil).
In determining whether an equity method investment is impaired, we look at a variety of factors including the operating and financial performance of the investee, the investees future business plans and projections, recent transactions and market valuations of publicly traded companies where available, and our intent and ability to hold the investment until it recovers in value. In doing this, we make assumptions and estimates in assessing whether an impairment has occurred and if, in the future, our assumptions and estimates made in assessing the fair value of these investments change, this could result in a material decrease in the carrying value of these investments. This would cause us to write-down the carrying value of these investments and could have a material adverse effect on our results of operations in the period the impairment charge is taken. During the year ended December 31, 2008, the Company recorded $1.0 million (2007 $nil, 2006 $nil) in other than temporary impairment charges related to investments in other ventures, under the equity method.
86
Table of Contents
Goodwill and Other Intangible Assets
Goodwill and other intangible assets acquired are initially recorded at fair value. Subsequent to initial recognition, finite lived other intangible assets are amortized over their estimated useful life, subject to impairment, and goodwill and indefinite lived other intangible assets are carried at the lower of cost or fair value. If goodwill or other intangible assets are impaired, they are written down to their estimated fair values with a corresponding expense reflected in our consolidated statements of operations.
We test goodwill and other intangible assets for impairment in the fourth quarter of each year, or more frequently if events or changes in circumstances indicate that the carrying amount may not be recoverable. For purposes of the annual impairment evaluation, goodwill is assigned to the applicable reporting unit of the acquired entities giving rise to the goodwill and other intangible assets are tested based on the cash flows they produce. There are many assumptions and estimates underlying the fair value calculation. Principally, we identify the reporting unit or business entity that the goodwill or other intangible asset is attributed to, and review historical and forecasted operating and financial performance and other underlying factors affecting such analysis, including market conditions. Other assumptions used could produce significantly different results which may result in a change in the value of goodwill or our other intangible assets and related charge in our consolidated statements of operations. An impairment charge could be recognized in the event of a significant decline in the implied fair value of those operations where the goodwill or other intangible assets are applicable. As at December 31, 2008, our consolidated balance sheets include $26.0 million of goodwill (2007 $2.3 million) and $48.2 million of other intangible assets (2007 $3.9 million). Impairment charges were $nil during 2008 (2007 $nil, 2006 $nil).
Premiums
We recognize premiums as revenue over the terms of the related contracts and policies. Our written premiums are based on policy and contract terms and include estimates based on information received from both insureds and ceding companies. The information received is typically in the form of bordereaux, broker notifications and/or discussions with ceding companies or their broker. This information can be received on a monthly, quarterly or transactional basis and normally includes estimates of written premium (including adjustment and reinstatement premium), earned premium, acquisition costs and ceding commissions.
We generally recognize premium on the date the contract is bound, even if the contract provides for an effective date prior to the date the contract is bound, thus preventing premature revenue recognition. The date the contract is bound is usually the date we are on risk for the policy and this is generally the date on which the reinsurance slip is signed. The signing of the reinsurance contract normally occurs after the date the slip is signed.
We book premiums on non-proportional contracts in accordance with the contract terms. Premiums written on losses occurring contracts are typically earned over the contract period. Premiums on risks attaching contracts are either estimated or earned as reported by the cedants, which may be over a period more than twice as long as the contract period. For multi-year policies, only the initial annual premium is included as written at policy inception. The remaining annual premiums are included as written at each successive anniversary date within the multi-year term. Management is required to make estimates based on judgment and historical experience for periods during which information has not yet been received.
In our Individual Risk business, it is often necessary to estimate portions of premiums written from quota-share contracts and by third party program managers and the related commission expense. Management estimates these amounts based on discussions with ceding companies and third party program managers, together with historical experience and judgment. Total premiums written estimated in our Individual Risk business at December 31, 2008, 2007 and 2006 were $12.9 million, $6.5 million and $16.2 million, respectively, and total estimated premiums earned were $2.5 million, $0.9 million and $6.8 million, respectively. Total earned commissions estimated at December 31, 2008, 2007 and 2006 were $2.4 million, $0.2 million and $3.4 million, respectively. Management tracks the actual premium received and commissions incurred and compares this to the estimates previously booked. Such estimates are subject to adjustment in subsequent periods when actual figures are recorded. To date such subsequent adjustments have not been material.
87
Table of Contents
Since premiums for our Reinsurance segment are contractually driven and the reporting lag for such premiums is minimal, estimates for premiums written for this segment are usually not significant. The minimum and deposit premiums on excess policies are usually set forth in the language of the contract and are used to record premiums on these policies. Actual premiums are determined in subsequent periods based on actual exposures and any adjustments are recorded in the period in which they are identified.
Reinstatement premiums are estimated after the occurrence of a significant loss and are recorded in accordance with the contract terms based upon paid losses and case reserves. Reinstatement premiums are earned when written.
Ceded premiums are also recognized on the date the contract is bound and are deducted from gross premiums written, to arrive at net premiums written. Ceded premiums are earned over the terms of the related contracts and policies, and are reflected as a reduction to gross premiums earned to arrive at net premiums earned.
Income Taxes
Income taxes have been provided in accordance with the provisions of FASB Statement No. 109, Accounting for Income Taxes (FAS 109), on those operations which are subject to income tax. Deferred tax assets and liabilities result from temporary differences between the amounts recorded in our consolidated financial statements and the tax basis of the Companys assets and liabilities. Such temporary differences are primarily due to the tax basis discount on unpaid losses and loss expenses, unearned premium reserves, net operating loss carryforwards, intangible assets, accrued expenses, deferred policy acquisition costs and certain investments. The effect on deferred tax assets and liabilities of a change in tax rates is recognized in income in the period that includes the enactment date. A valuation allowance against deferred tax assets is recorded if it is more likely than not that all, or some portion, of the benefits related to deferred tax assets will not be realized.
At December 31, 2008, our net deferred tax asset and valuation allowance were $17.0 million (2007 $18.7 million) and $1.4 million (2007 $3.1 million), respectively (see Note 17 of the consolidated financial statements for more information). At each balance sheet date, we assess the need to establish a valuation allowance that reduces the net deferred tax asset when it is more likely than not that all, or some portion, of the deferred tax assets will not be realized. The valuation allowance is based on all available information including projections of future taxable income from each tax-paying component in each tax jurisdiction. In 2008, 2007 and 2006, we generated cumulative taxable income in our U.S. tax-paying subsidiaries which was offset by the utilization of a net operating loss carryforward. During 2008 and 2007, our valuation allowance was reassessed and we now believe that it is more likely than not that we will continue to generate taxable income in our U.S. tax-paying subsidiaries and therefore be able to recover all of our U.S. net deferred tax asset. As a result, we reduced our valuation allowance for the years ending December 31, 2008 and December 31, 2007 by $1.7 million and $25.8 million, respectively. This resulted in a corresponding increase to net income in 2008 and 2007, respectively. Projections of future taxable income incorporate several assumptions of future business and operations that are likely to differ from actual experience.
In June 2006, the FASB issued FASB Interpretation No. 48, Accounting for Uncertainty in Income Taxes (FIN 48). FIN 48 prescribes guidance for the financial statement recognition, measurement and disclosure of uncertain tax positions recognized in an enterprises financial statements in accordance with FASB Statement No. 109, Accounting for Income Taxes. Tax positions must meet a more-likely-than-not recognition threshold at the effective date to be recognized upon the adoption of FIN 48 and in subsequent periods. FIN 48 became effective for us on January 1, 2007. The Company had no unrecognized tax benefits upon adoption of FIN 48 and through the period ended December 31, 2008. Tax years ending December 31, 2005 through December 31, 2007 are open for examination by the Internal Revenue Service.
88
Table of Contents
SUMMARY OF RESULTS OF OPERATIONS FOR 2008, 2007 AND 2006
Summary Overview
| Year ended December 31, |
2008 | 2007 | 2006 | |||||||||
| (in thousands, except per share amounts and ratios) | ||||||||||||
| Highlights |
||||||||||||
| Gross premiums written |
$ | 1,736,028 | $ | 1,809,637 | $ | 1,943,647 | ||||||
| Net premiums written |
1,353,620 | 1,435,335 | 1,529,620 | |||||||||
| Net premiums earned |
1,386,824 | 1,424,369 | 1,529,777 | |||||||||
| Net claims and claim expenses incurred |
760,489 | 479,274 | 446,230 | |||||||||
| Underwriting income |
290,617 | 579,701 | 693,264 | |||||||||
| Net investment income |
24,231 | 402,463 | 318,106 | |||||||||
| Net realized (losses) gains on investments |
(206,314 | ) | 1,293 | (34,464 | ) | |||||||
| Net (loss) income (attributable) available to common shareholders |
(13,280 | ) | 569,575 | 761,635 | ||||||||
| Total assets |
$ | 7,984,051 | $ | 8,286,355 | $ | 7,769,026 | ||||||
| Total shareholders equity |
$ | 3,032,743 | $ | 3,477,503 | $ | 3,280,497 | ||||||
| Per share data |
||||||||||||
| Net (loss) income (attributable) available to common shareholders per common share diluted (1) |
$ | (0.21 | ) | $ | 7.93 | $ | 10.57 | |||||
| Dividends per common share |
$ | 0.92 | $ | 0.88 | $ | 0.84 | ||||||
| Book value per common share |
$ | 38.74 | $ | 41.03 | $ | 34.38 | ||||||
| Accumulated dividends per common share |
7.92 | 7.00 | 6.12 | |||||||||
| Book value per common share plus accumulated dividends |
$ | 46.66 | $ | 48.03 | $ | 40.50 | ||||||
| Change in book value per common share plus accumulated dividends |
(2.9 | %) | 18.6 | % | 35.9 | % | ||||||
| Key ratios |
||||||||||||
| Net claims and claim expense ratio current accident year |
71.8 | % | 50.0 | % | 38.1 | % | ||||||
| Net claims and claim expense ratio prior accident years |
(17.0 | %) | (16.4 | %) | (8.9 | %) | ||||||
| Net claims and claim expense ratio calendar year |
54.8 | % | 33.6 | % | 29.2 | % | ||||||
| Underwriting expense ratio |
24.2 | % | 25.7 | % | 25.5 | % | ||||||
| Combined ratio |
79.0 | % | 59.3 | % | 54.7 | % | ||||||
| Return on average common equity |
(0.5 | %) | 20.9 | % | 36.3 | % | ||||||
| (1) | In accordance with FAS 128, earnings per share calculations use average common shares outstandingbasic, when in a net loss position. |
We incurred a $13.3 million net loss attributable to common shareholders in 2008 which represents a $582.9 million decrease from $569.6 million of net income available to common shareholders in 2007. In 2006, we generated $761.6 million of net income available to common shareholders which represents the highest net income available to common shareholders that the Company has recorded since its inception. As a result of our net loss attributable to common shareholders in 2008, we incurred a negative 0.5% return on average common equity and our book value per common share plus accumulated dividends decreased from $48.03 at December 31, 2007 to $46.66 at December 31, 2008, a 2.9% decrease. In 2007 and 2006, we generated returns on average common equity of 20.9% and 36.3%, respectively, and increased our book value per common share plus accumulated dividends by 18.6% and 35.9%, respectively.
89
Table of Contents
During 2008, the most significant events affecting our financial performance on a comparative basis to 2007 include:
| | Lower Investment Results our net investment income decreased $378.2 million to $24.2 million in 2008 from $402.5 million in 2007, driven by $219.6 million of net investment losses within our other investments, principally private equity partnerships, hedge funds and bank loan funds, which represents a $325.1 million decrease from $105.5 million of net investment income on these investments in 2007. In addition, net investment income from our short term investments decreased $70.0 million to $48.4 million in 2008 from $118.5 million in 2007, as a result of a reduction in short term interest rates and lower average balances for these investments. In addition, other than temporary impairments in our portfolio of fixed maturity investments available for sale increased by $191.5 million in 2008 to $217.0 million, compared to $25.5 million in 2007, primarily due to widening credit spreads as a result of the turmoil in the financial markets; |
| | Lower Underwriting Income our underwriting income decreased $289.1 million to $290.6 million in 2008 and our combined ratio increased 19.7 percentage points to 79.0% for the year, compared to $579.7 million of underwriting income and a combined ratio of 59.3% in 2007. The decrease in our underwriting income was principally driven by hurricanes Gustav and Ike, which as described in more detail below, generated underwriting losses of $419.1 million and increased our combined ratio by 32.3 percentage points; and |
| | Lower Minority Interest our minority interest expense decreased $109.3 million to $55.1 million in 2008, compared to $164.4 million in 2007, principally due to the reduction in net investment income and underwriting income as noted above which also impacted DaVinciRe and decreased its net income in 2008 and consequently decreased our minority interest expense. |
Following is supplemental financial data regarding the net financial statement impact on our results for 2008 due to hurricanes Gustav and Ike:
| Year ended December 31, 2008 |
Gustav | Ike | Total | |||||||||
| (in thousands, except ratios) | ||||||||||||
| Net claims and claim expenses incurred |
$ | (77,013 | ) | $ | (391,018 | ) | $ | (468,031 | ) | |||
| Net reinstatement premiums earned |
8,821 | 44,784 | 53,605 | |||||||||
| Lost profit commissions |
(1,901 | ) | (2,789 | ) | (4,690 | ) | ||||||
| Net impact on underwriting result |
(70,093 | ) | (349,023 | ) | (419,116 | ) | ||||||
| Minority interestDaVinciRe |
22,607 | 120,275 | 142,882 | |||||||||
| Net negative impact |
$ | (47,486 | ) | $ | (228,748 | ) | $ | (276,234 | ) | |||
| Impact on combined ratio |
5.2 | % | 26.7 | % | 32.3 | % | ||||||
The net negative impact from hurricanes Gustav and Ike includes the sum of net claims and claim expenses incurred, assumed and ceded reinstatement premiums earned, lost profit commissions, assessment related losses and expenses, and minority interest. Net negative impact is based on managements estimates following a review of our potential exposures and discussions with our counterparties. Given the magnitude and recent occurrence of these events, meaningful uncertainty remains regarding total covered losses for the insurance industry and, accordingly, several of the key assumptions underlying our loss estimates. In addition, actual losses from these events may increase if the Companys reinsurers or other obligors fail to meet their obligations. Actual losses from these events will likely vary, perhaps materially, from these current estimates due to the inherent uncertainties in reserving for such losses, including the preliminary nature of the available information, the potential inaccuracies and inadequacies in the data provided by clients and brokers, the inherent uncertainty of modeling techniques and the application of such techniques, the effects of any demand surge on claims activity and complex coverage and other legal issues. Changes to these estimates will be recorded in the periods in which they occur.
90
Table of Contents
During 2007, the most significant events affecting our financial performance on a comparative basis to 2006 include:
| | Declining Premium Volume a $105.4 million decrease in net premiums earned, due principally to a softening of premium rates in the property and casualty market which resulted in a $134.0 million, or 6.9% decrease, in the Companys gross premiums written; |
| | Higher Current Accident Year Claims a $129.6 million increase in current accident year net claims and claims expenses, which was principally driven by $217.5 million of net claims and claim expenses from Kyrill, flooding in the U.K. and sub-prime related casualty losses in our Reinsurance segment and partially offset by a $32.6 million decrease in current accident year net claims and claim expenses within our Individual Risk segment as a result of lower premium volumes and therefore a lower level of attritional losses; |
| | ChannelRe Losses a $167.2 million loss as a result of the reduction in the Companys carried value of ChannelRe to $nil due to estimated losses at ChannelRe which were driven by net unrealized mark-to-market losses in ChannelRes portfolio of financial guaranty contracts accounted for as derivatives under GAAP; |
| | Prior Year Favorable Development $233.2 million of favorable development on prior year reserves, an increase of $96.6 million from 2006, including $93.1 million attributable to our catastrophe unit driven by a reduction in ultimate losses in the 2006 and 2005 accident years, and $101.3 million and $38.8 million attributable to our specialty unit and Individual Risk segment, respectively, principally due to lower than expected claims emergence; and |
| | Higher Net Investment Income an $84.4 million increase in net investment income, inclusive of a $39.8 million increase in net investment income from our other investments, due to higher average invested assets due to the generation of cash flow from operations during the last three years that has been invested in our investment portfolio, combined with higher average yields on our portfolio of fixed maturity investments available for sale, short term investments and other investments. |
The three most significant items impacting our 2006 financial performance on a comparative basis to 2005 include:
| | Higher Premium Volume an increase in our net premiums earned, principally due to growth in gross premiums written in our catastrophe reinsurance unit where we found pricing and terms more favorable in 2006 compared with 2005 and we chose to write more business in that unit in 2006; |
| | Declining Claims a significant decrease in net claims and claim expenses as a result of light insured catastrophe loss activity for 2006; our net claims and claims expenses were significantly impacted by hurricanes Katrina, Rita and Wilma in 2005, and losses of that magnitude did not occur in 2006; and |
| | Higher Net Investment Income a significant increase in net investment income due to higher average invested assets due to the generation of cash flow from operations during the year that was invested in our investment portfolio, combined with higher average yields on our portfolio of fixed maturity investments available for sale and short term investments. |
91
Table of Contents
Underwriting Results by Segment
Reinsurance Segment
Below is a summary of the underwriting results and ratios for our Reinsurance segment followed by an analysis of our property catastrophe reinsurance unit and specialty reinsurance unit underwriting results and ratios for the years ended December 31, 2008, 2007 and 2006:
| Reinsurance segment overview | ||||||||||||
| Year ended December 31, |
2008 | 2007 | 2006 | |||||||||
| (in thousands) | ||||||||||||
| Gross premiums written (1) |
$ | 1,154,391 | $ | 1,290,420 | $ | 1,321,163 | ||||||
| Net premiums written |
$ | 871,893 | $ | 1,024,493 | $ | 1,039,103 | ||||||
| Net premiums earned |
909,759 | 957,661 | 972,017 | |||||||||
| Net claims and claim expenses incurred |
440,900 | 241,118 | 148,052 | |||||||||
| Acquisition expenses |
105,437 | 119,915 | 115,324 | |||||||||
| Operational expenses |
81,797 | 67,969 | 72,405 | |||||||||
| Underwriting income |
$ | 281,625 | $ | 528,659 | $ | 636,236 | ||||||
| Net claims and claim expenses incurred current accident year |
$ | 629,022 | $ | 435,495 | $ | 273,286 | ||||||
| Net claims and claim expenses incurred prior accident years |
(188,122 | ) | (194,377 | ) | (125,234 | ) | ||||||
| Net claims and claim expenses incurred total |
$ | 440,900 | $ | 241,118 | $ | 148,052 | ||||||
| Net claims and claim expense ratio current accident year |
69.1 | % | 45.5 | % | 28.1 | % | ||||||
| Net claims and claim expense ratio prior accident years |
(20.6 | %) | (20.3 | %) | (12.9 | %) | ||||||
| Net claims and claim expense ratio calendar year |
48.5 | % | 25.2 | % | 15.2 | % | ||||||
| Underwriting expense ratio |
20.5 | % | 19.6 | % | 19.3 | % | ||||||
| Combined ratio |
69.0 | % | 44.8 | % | 34.5 | % | ||||||
| (1) | Includes gross premiums ceded from the Individual Risk segment to the Reinsurance segment of $5.7 million, $37.4 million and $66.9 million for the years ended December 31, 2008, 2007 and 2006, respectively. |
Reinsurance Segment Gross Premiums Written Gross premiums written in our Reinsurance segment decreased $136.0 million, or 10.5%, to $1,154.4 million in 2008, compared to $1,290.4 million in 2007, primarily due to the then softening market conditions in 2008 which resulted in lower premium rates and a reduction in business that met our underwriting standards and partially offset by $58.4 million of reinstatement premiums written following hurricanes Gustav and Ike. As discussed below, in 2007 we entered into a large transaction in our specialty reinsurance unit that renewed at a lower participation rate and on a smaller premium base in 2008, resulting in a $66.4 million decrease in gross premiums written from this contract in our Reinsurance segment, compared to 2007.
For 2007, our gross premiums written in our Reinsurance segment decreased by $30.7 million to $1,290.4 million primarily due to softening market conditions in 2007 where the pricing for property catastrophe reinsurance decreased from 2006. In addition, we believe that legislation passed in Florida in early 2007, expanding the size of its State-funded reinsurance and insurance facilities, caused a substantial decline in the private reinsurance and insurance markets in and relating to Florida, and contributed to the decline in private industry property catastrophe gross premiums written in 2007 as compared to 2006. As discussed in more detail below, in 2007 we entered into a large transaction in our specialty reinsurance unit that resulted in $98.8 million of gross premium written. In the absence of this contract, the Companys Reinsurance segment gross premiums written would have decreased further, compared to 2006.
For 2006, our gross premiums written in our Reinsurance segment increased by $118.2 million to $1,321.2 million, compared to 2005, primarily due to the favorable pricing and terms experienced during our 2006 catastrophe reinsurance renewals. The improved pricing and terms for our 2006 catastrophe reinsurance
92
Table of Contents
renewals was principally driven by a hardening property catastrophe reinsurance market following the large catastrophes occurring during 2005. In 2006, we also wrote $114.0 million of gross premiums on behalf of two new fully-collateralized joint ventures which were established to take advantage of the favorable pricing and terms in 2006. The increase in our catastrophe gross premiums written more than offset a significant decline in our specialty reinsurance premium in 2006.
Gross Premiums Written by Geographic Region
The following is a summary of our gross reinsurance premiums written, excluding premiums assumed from our Individual Risk segment, allocated to the territory of coverage exposure:
| Reinsurance segment gross premiums written | ||||||||||||||||||
| 2008 | 2007 | 2006 | ||||||||||||||||
| Year ended December 31, |
Gross Premiums Written |
Percentage of Gross Premiums Written |
Gross Premiums Written |
Percentage of Gross Premiums Written |
Gross Premiums Written |
Percentage of Gross Premiums Written |
||||||||||||
| (in thousands, except percentages) | ||||||||||||||||||
| Property catastrophe reinsurance |
||||||||||||||||||
| United States and Caribbean |
$ | 745,016 | 64.8 | % | $ | 735,322 | 58.7 | % | $ | 792,311 | 63.1 | % | ||||||
| Worldwide (excluding U.S) (1) |
75,489 | 6.6 | 66,392 | 5.3 | 71,116 | 5.7 | ||||||||||||
| Europe |
72,153 | 6.3 | 111,702 | 8.9 | 73,500 | 5.9 | ||||||||||||
| Worldwide |
67,371 | 5.9 | 27,577 | 2.2 | 68,575 | 5.5 | ||||||||||||
| Australia and New Zealand |
5,455 | 0.5 | 4,360 | 0.3 | 2,732 | 0.2 | ||||||||||||
| Other |
23,465 | 2.0 | 20,374 | 1.6 | 23,972 | 1.9 | ||||||||||||
| Specialty reinsurance (2) |
159,770 | 13.9 | 287,316 | 23.0 | 222,049 | 17.7 | ||||||||||||
| Total Reinsurance gross premiums written (3) |
$ | 1,148,719 | 100.0 | % | $ | 1,253,043 | 100.0 | % | $ | 1,254,255 | 100.0 | % | ||||||
| (1) | The category Worldwide (excluding U.S.) consists of contracts that cover more than one geographic region (other than the U.S.). The exposure in this category for gross written premiums written to date is predominantly from Europe and Japan. |
| (2) | The category Specialty reinsurance consists of contracts that are predominantly exposed to U.S. and worldwide risks. |
| (3) | Reinsurance segment gross premiums written excludes $5.7 million, $37.4 million and $66.9 million of premiums assumed from the Individual Risk segment in 2008, 2007 and 2006, respectively. |
Our property catastrophe reinsurance gross premiums written continues to be characterized by a large percentage of U.S. and Caribbean premium as we have found business derived from exposures in Europe and the rest of the world to be, in general, less attractive on a risk-adjusted basis during recent periods. A significant amount of our U.S. and Caribbean premium provides coverage against windstorms, mainly U.S. Atlantic hurricanes, as well as earthquakes and other natural and man-made catastrophes.
Ceded Premiums Written
| Year ended December 31, |
2008 | 2007 | 2006 | ||||||
| (in thousands) | |||||||||
| Ceded premiums written Reinsurance segment |
$ | 282,498 | $ | 265,927 | $ | 282,060 | |||
93
Table of Contents
Due to the potential volatility of the property catastrophe reinsurance contracts which we sell, we purchase reinsurance to reduce our exposure to large losses and to help manage our risk portfolio. We use our REMS© modeling system to evaluate how each purchase interacts with our portfolio of reinsurance contracts we write, and with the other ceded reinsurance contracts we purchase, to determine the appropriateness of the pricing of each contract and whether or not it helps us to balance our portfolio of risks.
Ceded premiums written increased by $16.6 million in 2008, primarily as a result of the Company electing to purchase additional reinsurance protection due to appropriately priced coverage being available during 2008 and partially offset by the Company electing to not participate in a fully-collateralized joint venture due to a decrease in demand for these vehicles in 2008 compared to 2007.
Ceded premiums written decreased by $16.1 million in 2007, primarily as a result of the Companys decreased utilization of fully-collateralized joint ventures during 2007. In 2007, the Company assumed $59.4 million of catastrophe reinsurance premium which was fully ceded to its fully-collateralized joint ventures, primarily Starbound II, compared to 2006, where $114.0 million of assumed catastrophe reinsurance premium was fully ceded to Starbound Re and Tim Re. The decrease in premium ceded to fully-collateralized joint ventures was due to a decrease in demand for these vehicles in 2007 compared to 2006.
Ceded premiums written increased by $103.1 million in 2006, primarily as a result of the utilization in the 2006 U.S. hurricane season of two fully-collateralized joint ventures, Starbound Re and Tim Re, pursuant to which $114.0 million of assumed catastrophe reinsurance premium was fully ceded to those entities.
To the extent that appropriately priced coverage is available, we anticipate continued use of reinsurance to reduce the impact of large losses on our financial results and to manage our portfolio of risk; however, the buying of ceded reinsurance in our Reinsurance segment is based on market opportunities and is not based on placing a specific reinsurance program each year. In addition, in future periods we may utilize the growing market for cat-linked securities to expand our ceded reinsurance buying if we find the pricing and terms of such coverages attractive.
Reinsurance Segment Underwriting Results Our Reinsurance segment generated $281.6 million of underwriting income and a combined ratio of 69.0% in 2008, representing a $247.0 million decrease in underwriting income and a 24.2 percentage point increase in our combined ratio compared to 2007. The decrease in underwriting income in 2008 was principally driven by a $199.8 million increase in net claims and claim expenses, principally driven by losses associated with hurricanes Gustav and Ike, combined with a $47.9 million decrease in net premiums earned due to the decrease in gross premiums written noted above. Hurricanes Gustav and Ike resulted in $378.8 million in underwriting losses and increased the Reinsurance segments combined ratio by 46.6 percentage points, as detailed in the table below. The most significant losses in 2007 were from Kyrill, the U.K. floods and sub-prime related casualty losses which collectively resulted in $217.5 million of net claims and claim expenses.
| Reinsurance | ||||||||||||
| Year ended December 31, 2008 |
Gustav | Ike | Total | |||||||||
| (in thousands, except ratios) | ||||||||||||
| Net claims and claim expenses incurred |
$ | (65,753 | ) | $ | (366,771 | ) | $ | (432,524 | ) | |||
| Net reinstatement premiums earned |
8,821 | 49,575 | 58,396 | |||||||||
| Lost profit commissions |
(1,901 | ) | (2,789 | ) | (4,690 | ) | ||||||
| Net impact on underwriting result |
$ | (58,833 | ) | $ | (319,985 | ) | $ | (378,818 | ) | |||
| Impact on combined ratio |
6.8 | % | 39.0 | % | 46.6 | % | ||||||
In 2007, we generated underwriting income of $528.7 million and recorded a net claims and claim expense ratio of 25.2%, an expense ratio of 19.6%, and a combined ratio of 44.8%, compared to $636.2 million of underwriting income, a net claims and claim expense ratio of 15.2%, an expense ratio of 19.3% and a combined ratio of 34.5%, in 2006. The decrease in underwriting income in 2007 was principally driven by an increase in net claims and claims expenses which was primarily due to $217.5 million of net claims and
94
Table of Contents
claim expenses from Kyrill, the U.K. floods and sub-prime related casualty losses and partially offset by a $69.1 million increase in favorable development on prior year reserves. Hurricanes Katrina, Rita and Wilma resulted in $1,076.1 million of net claims and claim expenses in 2005 and added 113.6 percentage points to our net claims and claim expense ratio in 2005. There was an absence of large, land falling hurricanes and other catastrophes impacting the insurance industry in 2007 and 2006, which substantially contributed to the significant improvement in our underwriting profits in 2007 and 2006, compared to 2005.
Our underwriting results over the last three years have been, and may well continue to be, impacted by prior year reserve development. Our prior year reserves experienced $188.1 million, $194.4 million and $125.2 million of net favorable development in 2008, 2007 and 2006, respectively. For 2008, the favorable prior year reserve development was principally the result of a reduction in ultimate net losses associated with the 2005 hurricanes, Katrina, Rita and Wilma. The favorable prior year reserve development in 2007 was principally attributable to a reduction in our catastrophe unit ultimate losses related to the 2006 and 2005 accident years, combined with continued lower than expected claims emergence in our specialty unit. The favorable prior year reserve development in 2006 was principally driven by our specialty reinsurance unit as a result of the application of our formulaic reserving methodology for this book of business with the reductions being due to actual paid and reported loss activity being better than what we anticipated when setting the initial IBNR reserves. In addition, within our specialty reinsurance unit, $46.0 million of the favorable development in 2006 was driven by a reduction in carried reserves due to commutations.
Losses from our property catastrophe reinsurance and specialty reinsurance policies can be infrequent, but severe, as demonstrated by our 2008 results compared to 2007 and 2006. During periods with low levels of property catastrophe loss activity, such as 2007 and 2006, we have the potential to produce a low level of losses and a related increase in underwriting income. As described above, we believe there has been an increase in the frequency and severity of hurricanes that have the potential to make landfall in the U.S., potentially as a result of decadal ocean water temperature cyclical trends, a longer-term trend towards global warming, or both or other factors.
Our underwriting expenses consist of acquisition expenses and operational expenses. Acquisition expenses consist of the costs to acquire premiums and are principally comprised of broker commissions and excise taxes. Acquisition expenses are driven by contract terms and are normally a set percentage of premiums and, accordingly, these costs will normally move in line with the fluctuation in gross premiums earned. In 2008, the acquisition expense ratio of 11.6% was slightly lower than the 12.5% recorded in 2007. In 2006, the acquisition expense ratio was 11.9%.
Operating expenses consist of salaries and other general and administrative expenses. In 2008, operating expenses increased $13.8 million to $81.8 million primarily as a result of increased headcount and the related increase in compensation, general and administrative expenses. Operating expenses decreased by $4.4 million to $68.0 million in 2007 when compared to 2006, principally due to the Company reviewing and updating its methodology for allocating certain operating expenses combined with an increase in fee income as discussed below. Our operating expense ratio may increase over time, as a result of factors including the absolute and comparative growth of our operating expenses, further refinements to internal expense allocations, and market trends and dynamics.
We have entered into joint ventures and specialized quota share cessions of our book of business. In accordance with the joint venture and quota share agreements, we are entitled to certain fee income and profit commissions. We record these fees and profit commissions as a reduction in acquisition and operating expenses and, accordingly, these fees have reduced our underwriting expense ratios. These fees totaled $47.8 million, $29.5 million and $10.5 million in 2008, 2007 and 2006, respectively and resulted in a corresponding decrease to the underwriting expense ratio of 5.3%, 3.1% and 1.1% for the years ended December 31, 2008, 2007 and 2006, respectively. In addition, we are entitled to certain fee income and profit commissions from DaVinci. Because the results of DaVinci, and its parent DaVinciRe, are consolidated in our results of operations, these fees and profit commissions are eliminated in our consolidated financial statements and are principally reflected in minority interest. The net impact of all fees and profit commissions related to these joint ventures and specialized quota share cessions within our Reinsurance segment were $77.3 million, $80.6 million and $55.4 million for the years ending December 31, 2008, 2007 and 2006, respectively.
95
Table of Contents
Catastrophe
| Catastrophe overview |
||||||||||||
| Year ended December 31, |
2008 | 2007 | 2006 | |||||||||
| (in thousands, except percentages) | ||||||||||||
| Property catastrophe gross premiums written |
||||||||||||
| Renaissance |
$ | 633,611 | $ | 662,987 | $ | 773,638 | ||||||
| DaVinci |
361,010 | 340,117 | 325,476 | |||||||||
| Total property catastrophe gross premiums written (1) |
$ | 994,621 | $ | 1,003,104 | $ | 1,099,114 | ||||||
| Net premiums written |
$ | 712,341 | $ | 737,177 | $ | 817,054 | ||||||
| Net premiums earned |
717,570 | 726,265 | 733,777 | |||||||||
| Net claims and claim expenses incurred |
372,760 | 128,573 | 131,475 | |||||||||
| Acquisition expenses |
62,038 | 77,089 | 82,936 | |||||||||
| Operational expenses |
62,626 | 49,370 | 47,364 | |||||||||
| Underwriting income |
$ | 220,146 | $ | 471,233 | $ | 472,002 | ||||||
| Net claims and claim expenses incurred current accident year |
$ | 504,351 | $ | 221,662 | $ | 117,528 | ||||||
| Net claims and claim expenses incurred prior accident years |
(131,591 | ) | (93,089 | ) | 13,947 | |||||||
| Net claims and claim expenses incurred total |
$ | 372,760 | $ | 128,573 | $ | 131,475 | ||||||
| Net claims and claim expense ratio current accident year |
70.3 | % | 30.5 | % | 16.0 | % | ||||||
| Net claims and claim expense ratio prior accident years |
(18.4 | %) | (12.8 | %) | 1.9 | % | ||||||
| Net claims and claim expense ratio calendar year |
51.9 | % | 17.7 | % | 17.9 | % | ||||||
| Underwriting expense ratio |
17.4 | % | 17.4 | % | 17.8 | % | ||||||
| Combined ratio |
69.3 | % | 35.1 | % | 35.7 | % | ||||||
| (1) | Includes gross premiums written ceded from the Individual Risk segment to the catastrophe unit of $5.7 million, $37.0 million and $64.6 million for the years ended December 31, 2008, 2007 and 2006, respectively. |
Catastrophe Reinsurance Gross Premiums Written In 2008, our catastrophe reinsurance gross premiums written decreased $8.5 million, or 0.8%, to $994.6 million, compared to $1,003.1 million in 2007, principally due to the then softening market conditions in 2008 resulting in lower premium rates and a reduction in business that met the Companys underwriting standards, combined with a $31.3 million decrease in gross premiums written assumed from our Individual Risk segment. Offsetting these decreases was $58.4 million of reinstatement premiums written and earned as a result of hurricanes Gustav and Ike during 2008. In the absence of this loss related premium our catastrophe gross premiums written would have decreased 6.7% in 2008 compared to the 0.8% decrease noted above.
Our catastrophe reinsurance gross premiums written decreased $96.0 million to $1,003.1 million in 2007, principally as a result of softening market conditions in 2007 where the pricing for property catastrophe reinsurance decreased from 2006. In addition, we believe that legislation passed in Florida in early 2007, expanding the size of its State-funded reinsurance and insurance facilities, caused a substantial decline in the private reinsurance and insurance markets in and relating to Florida, and contributed to the decline in
96
Table of Contents
private industry property catastrophe gross premiums written in 2007 as compared to 2006. Excluding gross premiums written assumed from our Individual Risk segment, our catastrophe gross premiums written decreased $68.4 million, or 6.6%, in 2007 compared to 2006.
During 2007, we wrote $59.4 million of gross premiums on behalf of Starbound II, a fully-collateralized joint venture, compared to 2006, when we wrote $114.0 million of gross premiums on behalf of two fully-collateralized joint ventures, Starbound Re and Tim Re, which were established to provide capacity to our clients and take advantage of the favorable pricing and terms that were available. These premiums are fully ceded to the fully-collateralized joint ventures in return for a profit commission and expense override. Due to market conditions, the Company elected not to participate in a new fully-collateralized joint venture in 2008.
Our property catastrophe reinsurance gross premiums written continues to be characterized by a large percentage of U.S. and Caribbean premium, as we have found business derived from exposures in Europe or the rest of the world to be, in general, less attractive on a risk-adjusted basis during recent periods. A significant amount of our U.S. and Caribbean premium provides coverage against windstorms, mainly U.S. Atlantic hurricanes, as well as earthquakes and other natural and man-made catastrophes.
Catastrophe Reinsurance Underwriting Results Our 2008 catastrophe reinsurance unit underwriting results were negatively impacted from losses associated with hurricanes Gustav and Ike. We generated $220.1 million of underwriting income and recorded a net claims and claims expense ratio of 51.9%, underwriting expense ratio of 17.4% and combined ratio of 69.3% in 2008, compared to $471.2 million of underwriting income, a net claims and claim expense ratio of 17.7%, underwriting expense ratio of 17.4% and a combined ratio of 35.1% in 2007. Our 2008 accident year net claims and claim expenses of $504.4 million were $282.7 million higher than 2007, primarily as a result of losses associated with hurricanes Gustav and Ike. Hurricanes Gustav and Ike added 60.2 percentage points to the catastrophe units combined ratio as detailed in the table below.
| Catastrophe | ||||||||||||
| Year ended December 31, 2008 |
Gustav | Ike | Total | |||||||||
| (in thousands, except ratios) | ||||||||||||
| Net claims and claim expenses incurred |
$ | (65,753 | ) | $ | (366,771 | ) | $ | (432,524 | ) | |||
| Net reinstatement premiums earned |
8,821 | 49,575 | 58,396 | |||||||||
| Lost profit commissions |
(1,901 | ) | (2,789 | ) | (4,690 | ) | ||||||
| Net impact on underwriting result |
$ | (58,833 | ) | $ | (319,985 | ) | $ | (378,818 | ) | |||
| Impact on combined ratio |
8.7 | % | 50.2 | % | 60.2 | % | ||||||
In 2007, our catastrophe reinsurance underwriting results benefited from a low level of insured U.S. land falling hurricanes and were negatively impacted from losses associated with the U.K. flooding and Kyrill. We generated $471.2 million of underwriting income and recorded a net claims and claims expense ratio of 17.7%, underwriting expense ratio of 17.4% and combined ratio of 35.1%, compared to $472.0 million of underwriting income, a net claims and claims expense ratio of 17.9%, an underwriting expense ratio of 17.8% and a combined ratio of 35.7%, in 2006. Our 2007 accident year net claims and claim expenses of $221.7 million were $104.1 million higher than 2006, primarily as a result of losses related to the U.K. floods and Kyrill, in the amounts of $72.2 million and $85.2 million, respectively. Our 2006 underwriting results benefited by the low level of insured catastrophe losses in 2006, compared to 2005.
Our catastrophe reinsurance unit experienced $131.6 million of favorable development in 2008 principally as a result of a reduction in ultimate net losses associated with the 2005 hurricanes, Katrina, Rita and Wilma. In 2007, we experienced $93.1 million of favorable development which improved our calendar year loss ratio by 12.8 percentage points, principally as a result of a reduction of ultimate losses for the 2006 and 2005 accident years, due to lower than expected reported claims. In 2006, we experienced $13.9 million of adverse development on prior year reserves, which increased our calendar year net claims and claims expenses ratio by 1.9 percentage points. We cannot provide assurance that favorable reserve releases will continue, or that we will not experience unfavorable reserve development in the future.
97
Table of Contents
Specialty
| Specialty overview | ||||||||||||
| Year ended December 31, |
2008 | 2007 | 2006 | |||||||||
| (in thousands, except percentages) | ||||||||||||
| Specialty gross premiums written |
||||||||||||
| Renaissance |
$ | 153,701 | $ | 277,882 | $ | 198,111 | ||||||
| DaVinci |
6,069 | 9,434 | 23,938 | |||||||||
| Total specialty gross premiums written (1) |
$ | 159,770 | $ | 287,316 | $ | 222,049 | ||||||
| Net premiums written |
$ | 159,552 | $ | 287,316 | $ | 222,049 | ||||||
| Net premiums earned |
192,189 | 231,396 | 238,240 | |||||||||
| Net claims and claim expenses incurred |
68,140 | 112,545 | 16,577 | |||||||||
| Acquisition expenses |
43,399 | 42,826 | 32,388 | |||||||||
| Operational expenses |
19,171 | 18,599 | 25,041 | |||||||||
| Underwriting income |
$ | 61,479 | $ | 57,426 | $ | 164,234 | ||||||
| Net claims and claim expenses incurred current accident year |
$ | 124,671 | $ | 213,833 | $ | 155,758 | ||||||
| Net claims and claim expenses incurred prior accident years |
(56,531 | ) | (101,288 | ) | (139,181 | ) | ||||||
| Net claims and claim expenses incurred total |
$ | 68,140 | $ | 112,545 | $ | 16,577 | ||||||
| Net claims and claim expense ratio current accident year |
64.9 | % | 92.4 | % | 65.4 | % | ||||||
| Net claims and claim expense ratio prior accident years |
(29.4 | %) | (43.8 | %) | (58.4 | %) | ||||||
| Net claims and claim expense ratio calendar year |
35.5 | % | 48.6 | % | 7.0 | % | ||||||
| Underwriting expense ratio |
32.5 | % | 26.6 | % | 24.1 | % | ||||||
| Combined ratio |
68.0 | % | 75.2 | % | 31.1 | % | ||||||
| (1) | Includes gross premiums written ceded from the Individual Risk segment to the Specialty unit of $nil, $0.4 million and $2.3 million for the years ended December 31, 2008, 2007 and 2006, respectively. |
Specialty Reinsurance Gross Premiums Written In 2008, our specialty reinsurance gross premiums written decreased $127.5 million, or 44.4%, to $159.8 million, compared to $287.3 million of gross premiums written in 2007. The decrease is principally due to one new large contract in 2007 that renewed in 2008 at a lower participation rate and on a smaller premium base than in 2007, resulting in a $66.4 million decrease in gross premiums written from this contract, combined with the then softening market conditions experienced in 2008, compared to 2007, which impacted principally all lines of business.
Our specialty reinsurance gross premiums written increased by $65.3 million, or 29.4%, to $287.3 million in 2007, primarily due to one large transaction that resulted in $98.8 million of gross premiums written. In the absence of this contract, our specialty reinsurance gross premiums written would have declined in 2007, compared to 2006.
The decrease in our specialty reinsurance gross premiums written in 2006 was due to several factors including the non-renewal of contracts due to clients in general retaining more risk, and our underwriters non-renewing certain programs where the pricing and terms deteriorated to a point where we no longer found the programs attractive enough for us to write. In addition, our 2006 specialty reinsurance gross premiums written were negatively impacted by $28.3 million of return premium on contracts that were commuted in 2006 which resulted in a corresponding decrease in gross premiums written.
Specialty Reinsurance Underwriting Results In 2008, our specialty reinsurance unit generated underwriting income of $61.5 million, a net claims and claim expense ratio of 35.5%, underwriting expense ratio of 32.5% and a combined ratio of 68.0%, compared to $57.4 million of underwriting income, a net claims and claim expense ratio of 48.6%, underwriting expense ratio of 26.6% and a combined ratio of
98
Table of Contents
75.2% in 2007. The increase in underwriting income and decrease in the combined ratio in 2008 was primarily due to a decrease in net claims and claim expenses as a result of a $60.0 million reserve for casualty clash losses related to sub-prime events being established in the fourth quarter of 2007. Net underwriting losses in 2008 associated with sub-prime related losses as well as the Madoff matter, both arising out of exposures within our casualty clash line of business, were $2.5 million and $15.0 million, respectively, with the 2008 sub-prime related losses decreasing significantly from 2007. The decrease in net claims and claim expenses was partially offset by a decrease in net premiums earned as a result of the decrease in gross premiums written, as noted above.
During 2007, our specialty reinsurance unit generated underwriting income of $57.4 million, a net claims and claim expense ratio of 48.6%, underwriting expense ratio of 26.6% and combined ratio of 75.2%, compared to $164.2 million of underwriting income, a net claims and claim expense ratio of 7.0%, an underwriting expense ratio of 24.1% and a combined ratio of 31.1%, in 2006. The decrease in underwriting income was primarily due to a higher level of loss activity in the 2007 accident year compared with 2006, specifically, $60.0 million of net claims and claim expenses as a result of sub-prime related casualty losses arising in our casualty clash book of business, which added 25.9 percentage points to our 2007 net claims and claim expense ratio.
Our specialty reinsurance unit experienced favorable development on prior year reserves of $56.5 million, $101.3 million and $139.2 million, in 2008, 2007 and 2006, respectively. The favorable development on prior year reserves in 2008 was due to reported claim activity being less than expected. The reductions in our prior year reserves in 2007 and 2006 were principally driven by the application of our formulaic reserving methodology used for this book of business with the decrease being due to actual paid and reported loss activity coming in better than what we anticipated when setting the initial reserve estimates. Our 2007 accident year was also favorably impacted by a reduction to our initial expected loss ratios for two lines of business. In addition, during 2006, $46.0 million of the $139.2 million favorable development in our specialty reinsurance unit was driven by a reduction in carried reserves due to commutations. Since establishing the specialty reinsurance business unit in 2002, reported claim activity has been less than expected and therefore we have adjusted our estimated loss reporting patterns to reflect this experience. We cannot provide assurance that favorable reserve releases will continue, or that we will not experience unfavorable reserve development in the future.
99
Table of Contents
Individual Risk Segment
Below is a summary of the underwriting results and ratios for the years ended December 31, 2008, 2007 and 2006 for our Individual Risk segment:
| Individual Risk segment overview | ||||||||||||
| Year ended December 31, |
2008 | 2007 | 2006 | |||||||||
| (in thousands, except percentages) | ||||||||||||
| Gross premiums written |
$ | 587,309 | $ | 556,594 | $ | 689,392 | ||||||
| Net premiums written |
$ | 481,727 | $ | 410,842 | $ | 490,517 | ||||||
| Net premiums earned |
$ | 477,065 | $ | 466,708 | $ | 557,760 | ||||||
| Net claims and claim expenses incurred |
319,589 | 238,156 | 298,178 | |||||||||
| Acquisition expenses |
108,116 | 135,015 | 165,373 | |||||||||
| Operational expenses |
40,368 | 42,495 | 37,181 | |||||||||
| Underwriting income |
$ | 8,992 | $ | 51,042 | $ | 57,028 | ||||||
| Net claims and claim expenses incurred current accident year |
$ | 366,294 | $ | 276,929 | $ | 309,502 | ||||||
| Net claims and claim expenses incurred prior accident years |
(46,705 | ) | (38,773 | ) | (11,324 | ) | ||||||
| Net claims and claim expenses incurred total |
$ | 319,589 | $ | 238,156 | $ | 298,178 | ||||||
| Net claims and claim expense ratio current accident year |
76.8 | % | 59.3 | % | 55.5 | % | ||||||
| Net claims and claim expense ratio prior accident years |
(9.8 | %) | (8.3 | %) | (2.0 | %) | ||||||
| Net claims and claim expense ratio calendar year |
67.0 | % | 51.0 | % | 53.5 | % | ||||||
| Underwriting expense ratio |
31.1 | % | 38.1 | % | 36.3 | % | ||||||
| Combined ratio |
98.1 | % | 89.1 | % | 89.8 | % | ||||||
Individual Risk Segment Gross Premiums Written The following table shows our Individual Risk gross premiums written by major type of business for the years ended December 31, 2008, 2007 and 2006:
| 2008 | 2007 | 2006 | ||||||||||||||||
| Year ended December 31, |
Gross Premiums Written |
Percentage of Gross Premiums Written |
Gross Premiums Written |
Percentage of Gross Premiums Written |
Gross Premiums Written |
Percentage of Gross Premiums Written |
||||||||||||
| (in thousands, except percentages) | ||||||||||||||||||
| Individual Risk gross premiums written |
||||||||||||||||||
| Multi-peril crop |
$ | 272,559 | 46.4 | % | $ | 178,728 | 32.1 | % | $ | 129,908 | 18.9 | % | ||||||
| Commercial property |
134,601 | 23.0 | 164,438 | 29.5 | 226,205 | 32.8 | ||||||||||||
| Commercial multi-line |
119,987 | 20.4 | 162,422 | 29.2 | 229,079 | 33.2 | ||||||||||||
| Personal lines property |
60,162 | 10.2 | 51,006 | 9.2 | 104,200 | 15.1 | ||||||||||||
| Total Individual Risk gross premiums written |
$ | 587,309 | 100.0 | % | $ | 556,594 | 100.0 | % | $ | 689,392 | 100.0 | % | ||||||
Gross premiums written for our Individual Risk segment increased $30.7 million, or 5.5%, to $587.3 million in 2008, compared to $556.6 million in 2007. The increase in gross premiums written for our Individual Risk segment is primarily due to a $93.8 million increase in the multi-peril crop insurance line of business due principally to higher commodity prices and in part due to more insured acres, and partially offset by reductions in the commercial property and commercial multi-line businesses where management maintained underwriting discipline in the then increasingly softening U.S. property and casualty market.
100
Table of Contents
Our Individual Risk gross premiums written decreased by $132.8 million to $556.6 million in 2007, compared to 2006. Our Individual Risk segments commercial multi-line, commercial property and personal lines property lines of business all experienced declines in gross premiums written compared to the same period in 2006. The $61.8 million decrease in commercial property gross premiums written was due to the Company terminating one large commercial property quota share contract in the second quarter of 2007 combined with softening rates in the California earthquake commercial property market resulting in a decrease in business that met the Companys return hurdles. In addition, the personal lines property gross premiums written experienced a $53.2 million decrease principally due to the Companys decision in 2007 to reduce its exposure to this market and redeploy its capacity within the property catastrophe excess of loss reinsurance market within the Companys Reinsurance segment where the Company found pricing and terms more attractive.
Business obtained through our third party program managers was surpassed by business obtained through a wholly owned program manager in 2008 as the largest portion of our Individual Risk segment gross premiums written as detailed in the table below.
| 2008 | 2007 | 2006 | ||||||||||||||||
| Year ended December 31, |
Gross Premiums Written |
Percentage of Gross Premiums Written |
Gross Premiums Written |
Percentage of Gross Premiums Written |
Gross Premiums Written |
Percentage of Gross Premiums Written |
||||||||||||
| (in thousands, except percentages) | ||||||||||||||||||
| Individual Risk gross premiums written |
||||||||||||||||||
| Program managers wholly owned (1) |
$ | 272,559 | 46.4 | % | $ | 178,728 | 32.1 | % | $ | 129,908 | 18.9 | % | ||||||
| Program managers third party |
216,880 | 36.9 | 235,849 | 42.4 | 305,299 | 44.3 | ||||||||||||
| Quota share reinsurance |
97,444 | 16.6 | 139,952 | 25.1 | 238,066 | 34.5 | ||||||||||||
| Broker-produced business |
426 | 0.1 | 2,065 | 0.4 | 16,119 | 2.3 | ||||||||||||
| Total Individual Risk gross premiums written |
$ | 587,309 | 100.0 | % | $ | 556,594 | 100.0 | % | $ | 689,392 | 100.0 | % | ||||||
| (1) | Program managers wholly owned represents Agro National which we acquired in an asset purchase on June 2, 2008. The table above is presented as if Agro National has been a wholly-owned subsidiary since the first period presented. |
On June 2, 2008, the Company acquired substantially all the assets and assumed certain liabilities of Agro National, LLC for $80.5 million. Agro National is based in Council Bluffs, Iowa and is a managing general underwriter of multi-peril crop insurance. Agro National offers high quality risk protection products and services to the agricultural community throughout the U.S. Agro National participates in the U.S. Federal governments Multi-Peril Crop Insurance Program and has been writing business on behalf of Stonington, a wholly owned subsidiary of the Company, since 2004. The acquisition was undertaken to purchase the distribution channel for the Companys multi-peril crop insurance business which was previously conducted through a managing general agency contractual relationship with Agro National, LLC. With the acquisition of the net assets of Agro National, LLC in 2008 we intend to invest in this line of business and plan to continue to increase our gross premiums written for this business, subject to market conditions. The premium and underwriting results associated with this business can be volatile, driven principally by changes in commodity prices and weather events in the U.S. which impacts the price and yield of the insured crops and correspondingly also impacts the premium charged for the policies issued and the net claims and claim expenses incurred. Due to the growing proportion of this line of business within our Individual Risk results, we expect this potential volatility to increase.
101
Table of Contents
Ceded Premiums Written
| Year ended December 31, |
2008 | 2007 | 2006 | ||||||
| (in thousands) | |||||||||
| Ceded premiums written Individual Risk segment (1) |
$ | 105,582 | $ | 145,752 | $ | 198,875 | |||
| (1) | Includes $5.7 million, $37.4 million and $66.9 million of premium ceded to our Reinsurance segment in 2008, 2007 and 2006, respectively. |
We purchase reinsurance to reduce our exposure to large losses and to help manage our portfolio of risks. Ceded premiums written in our Individual Risk segment during 2008 decreased by $40.2 million to $105.6 million, principally due to a $31.7 million decrease in intercompany ceded premiums written from our Individual Risk segment to our Reinsurance segment, as discussed below. The decrease in ceded premiums written in 2007 compared with 2006 was principally due to the termination of one program that was fully ceded in prior years.
Individual Risk Segment Underwriting Results Our Individual Risk segment generated $9.0 million of underwriting income and recorded a net claims and claim expense ratio of 67.0%, an expense ratio of 31.1% and a combined ratio of 98.1%, compared to $51.0 million of underwriting income, a net claims and claim expense ratio of 51.0%, an expense ratio of 38.1% and a combined ratio of 89.1%, in 2007. The decrease in our Individual Risk segment underwriting income in 2008 was principally driven by an increase in net claims and claim expenses incurred of $81.4 million, principally due to $35.4 million of net incurred losses associated with hurricanes Gustav and Ike, and a higher level of attritional losses in our multi-peril crop insurance line of business. Hurricanes Gustav and Ike resulted in $40.2 million of underwriting losses, inclusive of $4.8 million of ceded reinstatement premiums earned, and added 8.4 percentage points to our Individual Risk segments 2008 combined ratio, as detailed in the table below.
| Individual Risk | ||||||||||||
| Year ended December 31, 2008 |
Gustav | Ike | Total | |||||||||
| (in thousands, except ratios) | ||||||||||||
| Net claims and claim expenses incurred |
$ | (11,260 | ) | $ | (24,247 | ) | $ | (35,507 | ) | |||
| Net reinstatement premiums earned |
| (4,791 | ) | (4,791 | ) | |||||||
| Lost profit commissions |
| | | |||||||||
| Net impact on underwriting result |
$ | (11,260 | ) | $ | (29,038 | ) | $ | (40,298 | ) | |||
| Impact on combined ratio |
2.3 | % | 6.0 | % | 8.4 | % | ||||||
In 2007 and 2006, the Individual Risk current accident year net claims and claim expense ratios were positively impacted by the absence of large losses as a result of minimal catastrophe loss activity in the U.S.
102
Table of Contents
Our Individual Risk segment purchases reinsurance from our Reinsurance segment. As detailed in the table below, our Individual Risk segment ceded $5.7 million, $37.4 million and $66.9 million of premiums to the Reinsurance segment in 2008, 2007 and 2006, respectively. In addition, our Individual Risk segment ceded losses to our Reinsurance segment of $7.1 million, negative $0.3 million and $8.6 million in 2008, 2007 and 2006, respectively. The net result of these transactions to the Individual Risk segment was an underwriting loss of $9.2 million, $42.6 million and $42.1 million in 2008, 2007 and 2006, respectively. There was a corresponding opposite effect on our Reinsurance segment underwriting results as a result of this reinsurance. We believe the terms of such cessions are on an arms length basis.
| Year ended December 31, |
2008 | 2007 | 2006 | |||||||||
| (in thousands) | ||||||||||||
| Premiums ceded to Reinsurance segment |
$ | (5,672 | ) | $ | (37,377 | ) | $ | (66,907 | ) | |||
| Ceded premiums earned |
$ | (16,338 | ) | $ | (42,230 | ) | $ | (50,681 | ) | |||
| Claims and claim expenses incurred |
7,121 | (324 | ) | 8,629 | ||||||||
| Underwriting loss |
$ | (9,217 | ) | $ | (42,554 | ) | $ | (42,052 | ) | |||
Also impacting the underwriting result in 2008, 2007 and 2006 were reductions of prior years estimated ultimate net claims reserves of $46.7 million, $38.8 million and $11.3 million, respectively. The reduction in prior years estimated ultimate net claims reserves was principally driven by the application of our formulaic reserving methodology used for the Individual Risk book of business and is primarily due to actual paid and reported loss activity being better than what we had anticipated when estimating the initial ultimate claims and claims expense ratios and the initial loss reporting patterns. In addition, during 2008 we revised our reported loss development patterns for several of our liability lines of business to reflect the Companys actual experience to date with these lines. The impact of this was a $7.8 million reduction in prior year reserves.
Our underwriting expenses consist of acquisition expenses and operational expenses. Acquisition expenses consist of costs to acquire premiums and are comprised of fees and expenses paid to: 1) third party program managers, who source primary insurance premiums for us through specialized programs; 2) primary insurers, for whom we write quota share reinsurance; and 3) broker commissions and excise taxes paid to brokers, who source insurance for us on a risk-by-risk basis. Acquisition expenses are driven by contract terms and are generally determined based on a set percentage of premiums. Acquisition expenses as a percentage of net premiums earned decreased in 2008 to 22.7%, compared to 28.9% and 29.6% in 2007 and 2006, respectively. The decrease in the acquisition expense ratio is principally a result of our multi-peril crop line of business having a relatively lower expense ratio when compared to other lines of business and increasing as a percentage of gross premiums written by our Individual Risk segment. In addition, certain components of underwriting expenses that were incurred in 2007 with respect to the multi-peril crop business are no longer reflected due to our acquisition of substantially all of the assets of Agro National, LLC, the agency that produces this business, in the second quarter of 2008. Operating expenses consist of compensation and other general and administrative expenses. Our Individual Risk business historically operated with a relatively small number of employees and, accordingly, we have outsourced much of the administration in our Individual Risk business to third party program managers and third party administrators, however we continuously monitor and analyze opportunities to internalize such services, such as with Glencoe Claims. Operating expenses in our Individual Risk segment remained relatively flat at $40.4 million in 2008 compared to $42.5 million in 2007, and $37.2 million in 2006. As noted above, we have been investing in our multi-peril crop insurance business as well as certain other lines of business and we currently expect our operating expenses to increase, both on an absolute basis and as a percentage of net premiums earned, in 2009.
103
Table of Contents
Net Investment Income
| Year ended December 31, |
2008 | 2007 | 2006 | |||||||||
| (in thousands) | ||||||||||||
| Fixed maturity investments available for sale |
$ | 201,220 | $ | 176,785 | $ | 158,516 | ||||||
| Short term investments |
48,437 | 118,483 | 92,818 | |||||||||
| Other investments |
||||||||||||
| Hedge funds and private equity investments |
(101,779 | ) | 87,985 | 50,333 | ||||||||
| Other |
(117,867 | ) | 17,469 | 15,335 | ||||||||
| Cash and cash equivalents |
7,452 | 11,026 | 8,552 | |||||||||
| Dividends on equity investment in reinsurance company |
| | 317 | |||||||||
| 37,463 | 411,748 | 325,871 | ||||||||||
| Investment expenses |
(13,232 | ) | (9,285 | ) | (7,765 | ) | ||||||
| Net investment income |
$ | 24,231 | $ | 402,463 | $ | 318,106 | ||||||
Net investment income for 2008 was $24.2 million, compared to $402.5 million during 2007, a decrease of $378.2 million, as a result of lower returns in our investment portfolio mainly driven by our other investments. Other investments incurred a net investment loss of $219.6 million in 2008 compared with $105.5 million of net investment income in 2007, a decrease of $325.1 million. Included in the net investment loss from other investments is a $101.8 million loss from hedge funds and private equity investments in 2008 compared to $88.0 million of net investment income from these funds in 2007, a decrease of $189.8 million. Also included in net investment loss from other investments in 2008 is a $117.9 million loss related primarily to senior secured bank loan funds and non-U.S. fixed income funds compared to $17.5 million of net investment income from these funds in 2007, a decrease of $135.3 million. The results from the Companys other investments described above include net unrealized losses of $259.4 million in 2008, compared to net unrealized gains of $47.3 million in 2007.
The fair value of certain of our other investments, which principally include hedge funds, private equity partnerships, senior secured bank loan funds and non-U.S. fixed income funds, is generally established on the basis of the net valuation criteria established by the managers of such investments, if applicable. These net valuations are determined based upon the valuation criteria established by the governing documents of such investments. Such valuations may differ significantly from the values that would have been used had ready markets existed for the shares, partnership interests or notes. Many of our fund investments are subject to restrictions on redemptions and sales which are determined by the governing documents and limit our ability to liquidate these investments in the short term. In addition, due to a lag in reporting, some of our fund managers, fund administrators, or both, are unable to provide final fund valuations as of our current reporting date. In these circumstances, we estimate the fair value of these funds by starting with the prior months or quarters fund valuation, adjusting these valuations for capital calls, redemptions or distributions and the impact of changes in foreign currency exchange rates, and then estimating the return for the current period. In circumstances in which we estimate the return for the current period, we use all credible information available to us. This principally includes preliminary estimates reported to us by our fund managers, obtaining the valuation of underlying portfolio investments where such underlying investments are publicly traded and therefore have a readily observable price, using information that is available to us with respect to the underlying investments, reviewing various indices for similar investments or asset classes, as well as estimating returns based on the results of similar types of investments for which we have reported results, or other valuation methods, as necessary. Actual final fund valuations may differ from our estimates, perhaps materially so, and these differences are recorded in the period they become known as a change in estimate. Our estimate of the fair value of catastrophe bonds are based on quoted market prices, or when such prices are not available, by reference to broker or underwriter bid indications.
104
Table of Contents
Net investment income from fixed maturity investments available for sale increased $24.4 million to $201.2 million in 2008 compared to $176.8 million in 2007 due to higher returns on these investments due in part to a widening of credit spreads. Net investment income from short term investments decreased $70.0 million in 2008 to $48.4 million from $118.5 million in 2007, principally due to a decrease in short term interest rates as well as a decrease in average balances for these investments as a result of our share repurchases during 2008.
Net investment income increased by $84.4 million to $402.5 million in 2007, compared to $318.1 million in 2006. The increase in net investment income in 2007 and 2006 was a result of both higher investment returns and an increasing level of average invested assets in 2007 and 2006. The increase in invested assets is due to the positive cash flow generated from our operating activities which we generated in 2007 and 2006, and which we have deployed into our invested assets. Our other investments, which include hedge funds, private equity funds and other alternative investments, generated $105.5 million of net investment income in 2007 compared to $65.7 million in 2006.
The recent reduction in the Federal Funds rate by the Board of Governors of the Federal Reserve Board and corresponding decline in interest rates as well as the overall poor economic conditions and turmoil in the financial and investment markets will likely continue to put downward pressure on our net investment income for the foreseeable future.
Net Realized (Losses) Gains on Investments
| Year ended December 31, |
2008 | 2007 | 2006 | |||||||||
| (in thousands) | ||||||||||||
| Gross realized gains |
$ | 99,634 | $ | 35,923 | $ | 21,034 | ||||||
| Gross realized losses |
(88,934 | ) | (9,117 | ) | (9,097 | ) | ||||||
| Other than temporary impairments |
(217,014 | ) | (25,513 | ) | (46,401 | ) | ||||||
| Net realized (losses) gains on investments |
$ | (206,314 | ) | $ | 1,293 | $ | (34,464 | ) | ||||
Our investment portfolio is structured to preserve capital and provide us with a high level of liquidity. A large majority of our investments are invested in the fixed income markets and, therefore, our realized holding gains and losses on investments are highly correlated to fluctuations in interest rates. Therefore, as interest rates decline, we will tend to have realized gains from the turnover of our investment portfolio, and as interest rates rise, we will tend to have realized losses from the turnover of our investment portfolio.
Net realized investment gains and losses totaled $99.6 million and $88.9 million, respectively, during 2008, compared to $35.9 million and $9.1 million, respectively, in 2007. Included in net realized (losses) gains are $217.0 million and $25.5 million of other than temporary impairment charges related to fixed maturity investments available for sale in 2008 and 2007, respectively. Other than temporary impairments in 2008 were driven by the turmoil in the financial markets and widening credit spreads. During 2007, our $25.5 million of other than temporary impairment charges was a result of a falling interest rate environment during the year which resulted in lower unrealized losses on our fixed maturity securities, prior to the recognition of other than temporary impairment losses on such securities. Credit-related other than temporary impairment charges totaled $8.3 million and $nil for 2008 and 2007, respectively. The credit-related other than temporary impairment charges in 2008, which includes impairments for which the Company believes it will not be able to recover the full principal amount if held to maturity, were principally driven by our direct holdings of fixed maturity securities issued by Lehman Brothers. The Company had essentially no fixed maturity investments available for sale in an unrealized loss position at December 31, 2008.
105
Table of Contents
Equity in Earnings (Losses) of Other Ventures
| Year ended December 31, |
2008 | 2007 | 2006 | ||||||||
| (in thousands) | |||||||||||
| Top Layer Re |
$ | 11,377 | $ | 14,949 | $ | 12,703 | |||||
| Starbound II |
3,202 | 2,472 | | ||||||||
| Tower Hill and Tower Hill Companies |
545 | 3,432 | 602 | ||||||||
| ChannelRe |
| (151,751 | ) | 19,097 | |||||||
| Other |
(1,521 | ) | 2,289 | 2,126 | |||||||
| Total equity in earnings (losses) of other ventures |
$ | 13,603 | $ | (128,609 | ) | $ | 34,528 | ||||
Equity in earnings (losses) of other ventures primarily represents our pro-rata share of the net income (loss) from our investments in Top Layer Re, Starbound II, Tower Hill, ChannelRe and Starbound for 2007 and also includes the Tower Hill Companies for 2008.
On July 1, 2008, the Company invested $50.0 million in the Tower Hill Companies representing a 25.0% equity ownership. Included in the purchase price was $40.0 million of other intangibles and $7.8 million of goodwill and in accordance with GAAP, these items are recorded as Investments in other ventures, under equity method rather than Goodwill and other intangibles on the Companys consolidated balance sheet. The Companys share of the equity in earnings of the Tower Hill Companies is recorded one quarter in arrears.
Equity in earnings (losses) of other ventures generated $13.6 million in income in 2008, compared to a loss of $128.6 million in 2007. The increase is primarily due to the absence of any additional losses related to ChannelRe, since ChannelRe is in a negative shareholders equity position, and consequently, our investment in ChannelRe continued to be carried at $nil during 2008. Until such time as ChannelRes shareholders equity is positive, we will not record any equity in earnings in our investment in ChannelRe. It is possible that with the adoption of FAS 157 by ChannelRe in 2008, that in future periods the nonperformance risk or own credit risk portion of ChannelRes mark-to-market on its financial guaranty contracts accounted for as derivatives under GAAP may increase, or that the underlying mark-to-market on ChannelRes financial guaranty contracts accounted for as derivatives under GAAP may decrease, or both, which could result in ChannelRe returning to a positive equity position, at which time we would then record our share of ChannelRes net income, subject to impairment, or our share of ChannelRes net loss. The equity pick-up for our earnings in ChannelRe and Tower Hill is recorded one quarter in arrears. Due to market conditions, the Company elected not to participate in a new fully collateralized joint venture in 2008, such as Starbound II in 2007 and Starbound in 2006.
Following is a summary of our equity in earnings (losses) of ChannelRe.
| Year ended December 31, |
2008 | 2007 | 2006 | |||||||
| (in thousands) | ||||||||||
| Equity in earnings of ChannelRe excluding unrealized mark-to-market losses |
$ | | $ | 15,420 | $ | 19,097 | ||||
| Equity in ChannelRe unrealized mark-to-market losses |
| (167,171 | ) | | ||||||
| Total equity in (losses) earnings of ChannelRe |
$ | | $ | (151,751 | ) | $ | 19,097 | |||
As discussed above, we reduced the carried value of our investment in ChannelRe to $nil in 2007 and until such time as ChannelRes shareholders equity is positive, we will not record any equity in earnings in our investment in ChannelRe. In 2007, our share of ChannelRes earnings was impacted by $167.2 million of negative mark-to-market losses. These mark-to-market losses were primarily driven by a widening of credit spreads and a lack of liquidity in 2007 which was primarily driven by issues related to the sub-prime market.
106
Table of Contents
Other Income (Loss)
| Year ended December 31, |
2008 | 2007 | 2006 | |||||||||
| (in thousands) | ||||||||||||
| Weather and energy products and trading |
$ | 25,122 | $ | (8,781 | ) | $ | (2,196 | ) | ||||
| Catastrophe-linked securities |
2,176 | 1,988 | | |||||||||
| Fee income |
15 | 8,468 | 8,072 | |||||||||
| Mark-to-market on Platinum warrant |
(538 | ) | 5,468 | (1,687 | ) | |||||||
| Weather-related and loss mitigation |
(9,072 | ) | (11,405 | ) | (4,972 | ) | ||||||
| Assumed and ceded reinsurance contracts accounted for as derivatives and deposits |
(9,739 | ) | (35,453 | ) | (6,816 | ) | ||||||
| Other |
2,288 | 1,785 | 3,682 | |||||||||
| Total other income (loss) |
$ | 10,252 | $ | (37,930 | ) | $ | (3,917 | ) | ||||
In 2008, we generated $10.3 million of other income compared to a loss of $37.9 million in 2007. The $48.2 million increase in other income was primarily due to a $33.9 million increase in our weather and energy products and trading activities and a $25.7 million decrease in other loss from our assumed and ceded reinsurance contracts accounted for at fair value or deposits, principally due to the expiration and non-renewal of several of these contracts. We have expanded our weather and energy products and trading activities in the last three years to include products such as weather derivatives and energy derivatives. The weather and energy products and trading results include net realized and unrealized gains and losses on agreements with end users and net realized and unrealized gains and losses on hedging and trading activities. The end users contracts we enter into and our trading activities are based in part on proprietary weather forecasts provided to us by our Weather Predict subsidiary. The weather products and trading activities in which we engage are both seasonal and volatile, and there is no assurance that our performance to date will be indicative of future periods. Partially offsetting these items was a decrease in fee income due to the September 30, 2007 expiration of our services agreement with Platinum and a $6.0 million decrease in the fair value on our warrant to purchase 2.5 million shares of Platinum common stock as a result of a decrease in the common share price of Platinum.
Corporate Expenses
| Year ended December 31, |
2008 | 2007 | 2006 | ||||||
| (in thousands) | |||||||||
| Other corporate expenses |
$ | 21,668 | $ | 23,173 | $ | 19,091 | |||
| Internal review and external investigation related expenses |
3,967 | 5,687 | 5,327 | ||||||
| Total corporate expenses |
$ | 25,635 | $ | 28,860 | $ | 24,418 | |||
Corporate expenses include certain executive, legal and consulting expenses, costs for research and development, and other miscellaneous costs associated with operating as a publicly traded company. Corporate expenses decreased $3.2 million in 2008, compared to 2007, primarily due to a $1.7 million decrease in internal review and external investigation related expenses and a $1.5 million decrease in other corporate expenses.
107
Table of Contents
Interest, Capital Securities and Preferred Share Dividends
| Year ended December 31, |
2008 | 2007 | 2006 | ||||||
| (in thousands) | |||||||||
| Interest DaVinciRe revolving credit facility |
$ | 8,678 | $ | 12,167 | $ | 8,549 | |||
| Interest RenaissanceRe revolving credit facility |
3,050 | | 5,165 | ||||||
| Interest $150 million 7.0% Senior Notes |
5,688 | 10,500 | 10,500 | ||||||
| Interest $100 million 5.875% Senior Notes |
5,875 | 5,875 | 5,875 | ||||||
| Interest $103.1 million subordinated obligation to Capital Trust |
| 4,818 | 7,227 | ||||||
| Other |
1,342 | 266 | 286 | ||||||
| Total interest expense |
24,633 | 33,626 | 37,602 | ||||||
| Dividends $150 million 8.10% Series A Preference Shares |
| 561 | 12,150 | ||||||
| Dividends $100 million 7.30% Series B Preference Shares |
7,300 | 7,300 | 7,300 | ||||||
| Dividends $250 million 6.08% Series C Preference Shares |
15,200 | 15,200 | 15,200 | ||||||
| Dividends $300 million 6.60% Series D Preference Shares |
19,800 | 19,800 | 825 | ||||||
| Total preferred share dividends |
42,300 | 42,861 | 35,475 | ||||||
| Total interest expense and preferred share dividends |
$ | 66,933 | $ | 76,487 | $ | 73,077 | |||
During 2008, our interest expense decreased $9.0 million to $24.6 million compared to $33.6 million in 2007 primarily as a result of the repayment at maturity of our 7.0% Senior Notes, which came due July 15, 2008, combined with the 2007 extinguishment of the subordinated obligation to Capital Trust, as detailed below, which resulted in the Company not having any further interest expense under this agreement during 2008. Offsetting these decreases was an increase in interest expense on our revolving credit facility as we borrowed $150.0 million under this facility to repay the 7.0% Senior Notes, described above. The average interest rate on this borrowing was 4.2%, therefore lower than the 7.0% coupon rate on the Senior Notes. Preferred share dividends remained relatively constant in 2008, when compared to 2007.
During 2007, our interest expense decreased primarily as a result of not having any balances outstanding under our $500.0 million revolving credit facility during the year, offset with the drawdown of $100.0 million in 2006, on the revolving credit facility of DaVinciRe. In addition, interest on these facilities is based on a variable base rate which increased in 2007, compared to 2006. The subordinated obligation to Capital Trust was extinguished during the year, resulting in a decrease of $2.4 million in interest expense. Preferred dividends increased by $7.4 million due to the issuance of $300.0 million of Series D Preference Shares in December 2006. We redeemed our Series A Preference Shares and our $103.1 million subordinated obligation to the Capital Trust on January 16, 2007 and March 1, 2007, respectively.
During 2006, our interest expense increased primarily as a result of $150.0 million outstanding under our $500.0 million revolving line credit facility for a portion of the year, combined with the drawdown of $60.0 million and $40.0 million in April 2006 and December 2006, respectively, on the revolving credit facility of DaVinciRe. In addition, interest on these facilities is based on a variable base rate which increased in 2006, compared to 2005. Preferred dividends increased by $0.8 million due to the issuance of $300.0 million of Series D Preference Shares in December 2006.
Minority Interest DaVinciRe
| Year ended December 31, |
2008 | 2007 | 2006 | |||||||||
| (in thousands) | ||||||||||||
| Minority interest DaVinciRe |
$ | (55,133 | ) | $ | (164,396 | ) | $ | (144,159 | ) | |||
In October 2001, we formed DaVinciRe and DaVinci with other equity investors. The Company owns a minority economic interest in DaVinciRe; however, because the Company controls a majority of DaVinciRes outstanding voting rights, the consolidated financial statements of DaVinciRe are included in the consolidated financial statements of the Company. Minority interest represents the portion of DaVinciRes
108
Table of Contents
earnings owned by third parties for the years ended December 31, 2008, 2007 and 2006. In 2008, 2007 and 2006, DaVinciRe generated net income which resulted in a minority interest expense to the Company. Our economic ownership interest in DaVinciRe at December 31, 2008, 2007 and 2006 was approximately 22.8%, 20.5% and 20.5%, respectively.
On January 30, 2009, the Company purchased the shares of certain third party DaVinciRe shareholders for $145.5 million, less a $21.8 million reserve holdback. The purchase price is based on GAAP book value as of December 31, 2008. As a result of these purchases, the Companys ownership interest in DaVinciRe increased to 37.6%. The Company expects its ownership in DaVinciRe to fluctuate over time.
Income Tax (Expense) Benefit
| Year ended December 31, |
2008 | 2007 | 2006 | ||||||||
| (in thousands) | |||||||||||
| Income tax (expense) benefit |
$ | (568 | ) | $ | 18,432 | $ | (935 | ) | |||
We are subject to income taxes in certain jurisdictions in which we operate; however, since the majority of our income is currently earned in Bermuda, a non-taxable jurisdiction, the tax impact to our operations has historically been minimal. In 2008, 2007 and 2006, we generated cumulative taxable income in our U.S. tax-paying subsidiaries. This taxable income was offset by the utilization of a net operating loss carryforward. During 2008 and 2007, our valuation allowance was reassessed and we now believe that it is more likely than not that we will continue to generate taxable income in our U.S. tax-paying insurance subsidiaries and therefore be able to recover all of our U.S. net deferred tax asset. As a result, our valuation allowance was reduced by $1.7 million and $25.8 million in 2008 and 2007, respectively, and there was a corresponding decrease to income tax expense and increase to our net income. This resulted in an income tax benefit in 2007. Our valuation allowance totaled $1.4 million and $3.1 million at December 31, 2008 and 2007, respectively. The remaining valuation allowance as of December 31, 2008 relates exclusively to our operations in Ireland. The income tax expense in 2006 primarily relates to alternative minimum taxes incurred by our U.S. subsidiaries. We expect our consolidated effective tax rate to increase in the future, as our global operations expand.
LIQUIDITY AND CAPITAL RESOURCES
Financial Condition
RenaissanceRe is a holding company, and we therefore rely on dividends from our subsidiaries and investment income to make principal and interest payments on our debt and to make dividend payments to our preference and common shareholders.
The payment of dividends by our U.S. and Bermuda subsidiaries is, under certain circumstances, limited under U.S. statutory regulations and Bermuda insurance law, which require our U.S. and Bermuda insurance subsidiaries to maintain certain measures of solvency and liquidity. In addition, Bermuda regulations require approval from the BMA for any reduction of capital in excess of 15% of statutory capital, as defined in the Insurance Act. At December 31, 2008, the statutory capital and surplus of our Bermuda insurance subsidiaries was $3.2 billion (2007 $3.3 billion), and the amount of capital and surplus required to be maintained was $525.5 million (2007 $578.3 million). During 2008, Renaissance Reinsurance, DaVinciRe and Glencoe Group returned capital, which included dividends declared and return of capital, net of capital contributions received of $73.6 million, $100.0 million and $63.8 million, respectively, compared with $547.8 million, $nil and a net capital contribution of $31.2 million, respectively, in 2007. We did not participate in DaVinciRes return of capital in 2008.
Our principal U.S. insurance subsidiary Stonington is also required to maintain certain measures of solvency and liquidity. Restrictions with respect to dividends are based on state statutes. In addition, there are restrictions based on risk based capital tests which is the threshold that constitutes the authorized control level. If Stoningtons statutory capital and surplus falls below the authorized control level, the Texas Department of Insurance (TDI) is authorized to take whatever regulatory actions are considered necessary
109
Table of Contents
to protect policyholders and creditors. At December 31, 2008, the consolidated statutory capital and surplus of Stonington was $128.6 million (2007 $124.8 million). Because of an accumulated deficit in earned surplus from prior operations, Stonington cannot currently pay an ordinary dividend without TDI approval.
In the aggregate, our operating subsidiaries have historically produced sufficient cash flows to meet their expected claims payments and operational expenses and to provide dividend payments to us. Our subsidiaries also maintain a concentration of investments in high quality liquid securities, which management believes will provide additional liquidity for extraordinary claims payments should the need arise. Additionally, we maintain a $500.0 million revolving credit facility to meet additional liquidity and capital requirements. At December 31, 2008, the $150.0 million borrowed under this facility, which we used to pay at maturity our 7.0% Senior Notes which came due July 15, 2008, remains outstanding. See Capital Resources section below.
Cash Flows and Liquidity
Cash flows from operating activities for 2008 were $544.0 million, which principally consisted of our net income of $29.0 million (prior to dividends on preference shares), a $55.1 million increase in the minority interest in the undistributed net income of DaVinciRe, unrealized losses included in net investment income of $259.4 million related to our other investments and realized investment losses of $206.3 million. Our 2008 cash flows from operations were primarily used to repurchase our common shares, pay our common and preferred share dividends and pay claims and claim expenses.
We have generated cash flows from operations over the three year period between 2006 and 2008 significantly in excess of our operating commitments. Because a large portion of the coverages we provide typically can produce losses of high severity and low frequency, it is not possible to accurately predict our future cash flows from operating activities. As a consequence, our cash flow from operating activities may fluctuate, perhaps significantly, between individual quarters and years. Due to the magnitude and recent occurrence of hurricanes Gustav and Ike during the third quarter of 2008 meaningful uncertainty remains regarding losses from these events and our actual ultimate net losses from these events may vary materially from preliminary estimates. As a result, our cash flows from operations will be impacted accordingly. In addition, given the severity of losses incurred in 2005 from the large catastrophes, many of which remain unpaid at December 31, 2008, it is likely that we will experience a significant amount of paid claims in 2009 which could result in us having reduced or negative cash flows from operations.
Reserves for Claims and Claim Expenses
We believe the most significant accounting judgment made by management is our estimate of claims and claim expense reserves. Claims and claim expense reserves represent estimates, including actuarial and statistical projections at a given point in time, of the ultimate settlement and administration costs for unpaid claims and claim expenses arising from the insurance and reinsurance contracts we sell. We establish our claims and claim expense reserves by taking claims reported to us by insureds and ceding companies, but which have not yet been paid (case reserves), adding the costs for additional case reserves (additional case reserves) which represent our estimates for claims previously reported to us which we believe may not be adequately reserved as of that date, and adding estimates for the anticipated cost of claims incurred but not yet reported to us (IBNR).
110
Table of Contents
The following table summarizes our claims and claim expense reserves by line of business and split between case reserves, additional case reserves and IBNR at December 31, 2008 and 2007:
| At December 31, 2008 |
Case Reserves | Additional Case Reserves |
IBNR | Total | ||||||||
| (in thousands) | ||||||||||||
| Property catastrophe reinsurance |
$ | 312,944 | $ | 297,279 | $ | 250,946 | $ | 861,169 | ||||
| Specialty reinsurance |
113,953 | 135,345 | 387,352 | 636,650 | ||||||||
| Total Reinsurance |
426,897 | 432,624 | 638,298 | 1,497,819 | ||||||||
| Individual Risk |
253,327 | 14,591 | 394,875 | 662,793 | ||||||||
| Total |
$ | 680,224 | $ | 447,215 | $ | 1,033,173 | $ | 2,160,612 | ||||
| At December 31, 2007 |
||||||||||||
| (in thousands) | ||||||||||||
| Property catastrophe reinsurance |
$ | 275,436 | $ | 287,201 | $ | 204,487 | $ | 767,124 | ||||
| Specialty reinsurance |
109,567 | 93,280 | 448,756 | 651,603 | ||||||||
| Total Reinsurance |
385,003 | 380,481 | 653,243 | 1,418,727 | ||||||||
| Individual Risk |
237,747 | 10,359 | 361,663 | 609,769 | ||||||||
| Total |
$ | 622,750 | $ | 390,840 | $ | 1,014,906 | $ | 2,028,496 | ||||
Our estimates of claims and claim expense reserves are not precise in that, among other matters, they are based on predictions of future developments and estimates of future trends and other variable factors. Some, but not all, of our reserves are further subject to the uncertainty inherent in actuarial methodologies and estimates. Because a reserve estimate is simply an insurers estimate at a point in time of its ultimate liability, and because there are numerous factors which affect reserves and claims payments but cannot be determined with certainty in advance, our ultimate payments will vary, perhaps materially, from our estimates of reserves. If we determine in a subsequent period that adjustments to our previously established reserves are appropriate, such adjustments are recorded in the period in which they are identified. During the twelve months ended December 31, 2008, 2007 and 2006, changes to prior year estimated claims reserves increased our net income by $234.8 million, $233.2 million and $136.6 million, respectively, excluding the consideration of changes in reinstatement premium, profit commissions, DaVinciRe minority interest and income tax expense.
Our reserving methodology for each line of business uses a loss reserving process that calculates a point estimate for the Companys ultimate settlement and administration costs for claims and claim expenses. We do not calculate a range of estimates. We use this point estimate, along with paid claims and case reserves, to record our best estimate of additional case reserves and IBNR in our financial statements. Under GAAP, we are not permitted to establish estimates for catastrophe claims and claim expense reserves until an event occurs that gives rise to a loss.
Reserving for our reinsurance claims involves other uncertainties, such as the dependence on information from ceding companies, which among other matters, includes the time lag inherent in reporting information from the primary insurer to us or to our ceding companies and differing reserving practices among ceding companies. The information received from ceding companies is typically in the form of bordereaux, broker notifications of loss and/or discussions with ceding companies or their brokers. This information can be received on a monthly, quarterly or transactional basis and normally includes estimates of paid claims and case reserves. We sometimes also receive an estimate or provision for IBNR. This information is often updated and adjusted from time-to-time during the loss settlement period as new data or facts in respect of initial claims, client accounts, industry or event trends may be reported or emerge in addition to changes in applicable statutory and case laws.
111
Table of Contents
We recorded $468.0 million of net claims and claim expenses incurred in 2008 as a result of losses arising from hurricanes Gustav and Ike which struck the United States in the third quarter of 2008. Our estimates of losses from hurricanes Gustav and Ike are based on factors including currently available information derived from the Companys preliminary claims information from certain clients and brokers, industry assessments of losses from the events, proprietary models, and the terms and conditions of our contracts. Given the magnitude and recent occurrence of these events, meaningful uncertainty remains regarding total covered losses for the insurance industry and, accordingly, several of the key assumptions underlying our loss estimates. In addition, actual losses from these events may increase if our reinsurers or other obligors fail to meet their obligations. Our actual losses from these events will likely vary, perhaps materially, from these current estimates due to the inherent uncertainties in reserving for such losses, including the preliminary nature of the available information, the potential inaccuracies and inadequacies in the data provided by clients and brokers, the inherent uncertainty of modeling techniques and the application of such techniques, the effects of any demand surge on claims activity and complex coverage and other legal issues.
Included in our results for 2007 are $157.5 million of net claims and claim expenses from Kyrill and the U.K. flood losses which occurred in 2007, as well as $60.0 million in estimated losses associated with exposure to sub-prime related casualty losses. Estimates of these losses are based on a review of potentially exposed contracts, information reported by and discussions with counterparties, and the Companys estimate of losses related to those contracts and is subject to change as more information is reported and becomes available. Such information is frequently reported more slowly, and with less initial accuracy, with respect to non-U.S. events such as Kyrill and the U.K. floods than with large U.S. catastrophe losses. In addition, the sub-prime related casualty net claims and claim expenses are based on underlying liability contracts which are considered long-tail business, and will therefore take many years before the actual losses are known and reported, which increases the uncertainty with respect to the estimate for ultimate losses for this event. The net claims and claim expenses from Kyrill, the U.K. floods and sub-prime related casualty losses are all attributable to the Companys Reinsurance segment.
During 2005, we incurred significant losses from hurricanes Katrina, Rita and Wilma. Our estimates of these losses are based on factors including currently available information derived from claims information from our clients and brokers, industry assessments of losses from the events, proprietary models and the terms and conditions of our contracts. In particular, due to the size and unusual complexity of certain legal and claims issues, particularly but not exclusively relating to hurricane Katrina, meaningful uncertainty remains regarding total covered losses for the insurance industry and, accordingly, our loss estimates. Our actual losses from these events will likely vary, perhaps materially, from our current estimates due to the inherent uncertainties in reserving for such losses, the potential inaccuracies and inadequacies in the data provided by clients and brokers, the inherent uncertainty of modeling techniques and the application of such techniques, and complex coverage and other legal issues.
Because of the inherent uncertainties discussed above, we have developed a reserving philosophy which attempts to incorporate prudent assumptions and estimates, and we have generally experienced favorable development on prior year reserves in the last several years. However, there is no assurance that this will occur in future periods.
Our reserving techniques, assumptions and processes differ between our Reinsurance and Individual Risk segments, as well as between our property catastrophe reinsurance and specialty reinsurance businesses within our Reinsurance segment. Refer to our Claims and Claim Expense Reserves Critical Accounting Estimates discussion in Item 7. Managements Discussion and Analysis of Financial Condition and Results of Operations for more information on the risks we insure and reinsure, the reserving techniques, assumptions and processes we follow to estimate our claims and claim expense reserves, and our current estimates versus our initial estimates of our claims reserves, for each of these units.
112
Table of Contents
Capital Resources
Our total capital resources at December 31, 2008 and 2007 were as follows:
| At December 31, |
2008 | 2007 | ||||
| (in thousands) | ||||||
| Common shareholders equity |
$ | 2,382,743 | $ | 2,827,503 | ||
| Preference shares |
650,000 | 650,000 | ||||
| Total shareholders equity |
3,032,743 | 3,477,503 | ||||
| 5.875% Senior Notes |
100,000 | 100,000 | ||||
| 7.0% Senior Notes |
| 150,000 | ||||
| Revolving credit facility borrowed |
150,000 | | ||||
| Revolving credit facility unborrowed |
350,000 | 500,000 | ||||
| DaVinciRe revolving credit facility borrowed |
200,000 | 200,000 | ||||
| DaVinciRe revolving credit facility unborrowed |
| | ||||
| RTL credit facility borrowed |
| 1,951 | ||||
| RTL credit facility unborrowed |
10,000 | 8,049 | ||||
| Total capital resources |
$ | 3,842,743 | $ | 4,437,503 | ||
During 2008, our capital resources decreased by $594.8 million, primarily due to $428.4 million of common share repurchases, the $150.0 million repayment of our 7.0% Senior Notes which came due on July 15, 2008 and $57.9 million of dividends on common shares and partially offset by our comprehensive income of $59.7 million.
Preference Shares
In December 2006, we raised $300.0 million through the issuance of 12 million Series D Preference Shares; in March 2004, we raised $250.0 million through the issuance of 10 million Series C Preference Shares; and in February 2003, we raised $100.0 million through the issuance of 4 million Series B Preference Shares. The Series D, Series C and Series B Preference Shares may be redeemed at $25 per share at our option on or after December 1, 2011, March 23, 2009 and February 4, 2008, respectively. Dividends on the Series D, Series C and Series B Preference Shares are cumulative from the date of original issuance and are payable quarterly in arrears at 6.60%, 6.08% and 7.30%, respectively, when, if, and as declared by the Board of Directors. If RenaissanceRe submits a proposal to our shareholders concerning an amalgamation or submits any proposal that, as a result of any changes to Bermuda law, requires approval of the holders of RenaissanceRe preference shares to vote as a single class, RenaissanceRe may redeem the Series D, Series C and Series B Preference Shares prior to December 11, 2011, March 23, 2009 and February 4, 2008, respectively, at $26 per share. The preference shares have no stated maturity and are not convertible into any other of our securities.
Senior Notes
In January 2003, we issued $100.0 million of 5.875% Senior Notes due February 15, 2013, with interest on the notes payable on February 15 and August 15 of each year. The notes can be redeemed by us prior to maturity subject to payment of a make-whole premium. The notes, which are senior obligations, contain various covenants, including limitations on mergers and consolidations, restrictions as to the disposition of the stock of designated subsidiaries and limitations on liens of the stock of designated subsidiaries, which the Company was in compliance with as of February 11, 2009. In July 2001, we issued $150.0 million of 7.0% Senior Notes which came due July 15, 2008. The notes were paid at maturity on July 15, 2008 using existing capital resources, as discussed above in Financial Condition.
113
Table of Contents
RenaissanceRe Revolving Credit Facility
During August 2004, we amended and restated our committed revolving credit agreement to (i) increase the facility from $400.0 million to $500.0 million, (ii) extend the term to August 6, 2009 and (iii) make certain other changes. On July 10, 2008, we borrowed $150.0 million available under this facility to pay at maturity our 7.0% Senior Notes which came due on July 15, 2008. At December 31, 2008, the $150.0 million borrowed under this facility remains outstanding. Interest rates on the facility are based on a spread above LIBOR, and averaged 4.2% during 2008. As amended, the agreement contains certain covenants, including financial covenants, which the Company was in compliance with as of February 11, 2009. The financial covenants generally provide that consolidated debt to capital shall not exceed the ratio (the Debt to Capital Ratio) of 0.35:1 and that the consolidated net worth (the Net Worth Requirements) of RenaissanceRe and Renaissance Reinsurance shall equal or exceed $1.0 billion and $500.0 million, respectively, subject to certain adjustments under certain circumstances in the case of the Debt to Capital Ratio and certain grace periods in the case of the Net Worth Requirements, all as more fully set forth in the agreement. We have the right, subject to certain conditions, to increase the size of this facility to $600.0 million. The Company may desire to enter into a revised or new facility to replace this facility which expires in August 2009, however we cannot assure you that we will be able to do so on terms that are favorable to the Company or at all.
DaVinciRe Revolving Credit Facility
During April 2006, DaVinciRe amended and restated its credit agreement to, among other things, (i) extend the termination date of the revolving credit facility established thereunder from May 25, 2010 to April 5, 2011; (ii) increase the borrowing capacity to $200.0 million; and (iii) increase the minimum net worth requirement with respect to DaVinciRe and DaVinci by $100.0 million to $350.0 million and $450.0 million, respectively. All other material terms and conditions in the credit agreement remained the same, including the requirement that DaVinciRe maintain a debt to capital ratio of 30% or below. At December 31, 2008, $200.0 million remained outstanding. Interest rates on the facility are based on a spread above LIBOR, and averaged approximately 4.3% during 2008 (2007 6.0%). The term of the credit facility may be further extended and the size of the facility may be increased to $250.0 million if certain conditions are met. DaVinciRe was in compliance with the related financial covenants as of February 11, 2009. Neither RenaissanceRe nor Renaissance Reinsurance is a guarantor of this facility and the lenders have no recourse against us or our subsidiaries other than DaVinciRe and DaVinci under the DaVinciRe facility. Pursuant to the terms of the $500.0 million revolving credit facility maintained by RenaissanceRe, a default by DaVinciRe on its obligations will not result in a default under the RenaissanceRe facility.
RTL Credit Facility
RTL maintains a brokerage facility with a leading prime broker, which has an associated margin facility. This margin facility, which we believe allows RTL to prudently manage its cash position related to its exchange traded products, is supported by a $10.0 million guarantee issued by RenaissanceRe. Interest on amounts outstanding under this facility is at overnight LIBOR plus 75 basis points. At December 31, 2008, $nil was outstanding under the facility.
In addition, at December 31, 2008, the Company provided $105.1 million of guarantees to support the weather and energy trading operations of RTL.
Letter of Credit Facility
Under the terms of certain reinsurance contracts, our insurance and reinsurance subsidiaries and joint ventures may be required to provide letters of credit to reinsureds in respect of reported claims and/or unearned premiums. Our principal letter of credit facility is a syndicated secured facility which accepts as collateral shares issued by our subsidiary RIHL and also contains certain financial covenants which we were in compliance with as of February 11, 2009. Our participating operating subsidiaries and our managed joint ventures have pledged (and must maintain as pledged) RIHL shares issued to them with a sufficient collateral value to support their respective obligations under the facility, including reimbursement obligations for outstanding letters of credit. The participating subsidiaries and joint ventures have the option to post alternative forms of collateral. In addition, for liquidity purposes, in order to be permitted to pledge
114
Table of Contents
RIHL shares as collateral, each participating subsidiary and joint venture must maintain additional unpledged RIHL shares that have a net asset value at least equal to 15% of its facility usage, and RIHL shares having an aggregate net asset value equal to at least 15% of the net asset value of all outstanding RIHL shares must remain unencumbered. In the case of a default under the facility, or in other circumstances in which the rights of our lenders to collect on their collateral may be impaired, the lenders may exercise certain remedies under the facility agreement, in accordance with and subject to its terms, including redemption of pledged shares and conversion of the collateral into cash or eligible marketable securities. The redemption of shares by the collateral agent takes priority over any pending redemption of unpledged shares by us or other holders. On April 27, 2007, the reimbursement agreement was amended and restated to, among other things: (i) extend the term of the agreement to April 27, 2010; (ii) change the total commitment thereunder from $1.725 billion to $1.4 billion; (iii) provide for the potential increase of the total commitment to up to $1.8 billion if certain conditions are met; and (iv) increase the minimum net worth requirement with respect to DaVinci by $150.0 million to $300.0 million. At February 11, 2009, we had $1,019.1 million of letters of credit with effective dates on or before December 31, 2008 outstanding under the facility and total letters of credit outstanding under all facilities of $1,024.1 million.
Our subsidiary, Stonington, has provided letters of credit in the amount of $13.1 million to two counterparties which are secured by cash and eligible marketable securities. In connection with our Top Layer Re joint venture, we have committed $37.5 million of collateral to support a letter of credit and are obligated to make a mandatory capital contribution of up to $50.0 million in the event that a loss reduces Top Layer Res capital below a specified level.
Transaction Under DaVinciRes Shareholders Agreement
The second amended and restated shareholders agreement (the shareholders agreement) provides DaVinciRe shareholders, excluding us, with certain redemption rights, which allow each shareholder to notify DaVinciRe of such shareholders desire for DaVinciRe to repurchase up to half of such shareholders aggregate number of shares held. Any share repurchases are subject to certain limitations, as described in the shareholders agreement, such as limiting the aggregate of all share repurchase requests to 25% of DaVinciRes capital in any given year and subject to ensuring all applicable regulatory requirements are met. If the total shareholder requests exceed 25% of DaVinciRes capital, the number of shares repurchased will be reduced among the requesting shareholders pro-rata, based on the amounts desired to be repurchased. Shareholders must notify DaVinciRe before March 1 of each year, if they desire to have DaVinciRe repurchase shares. The repurchase price will be based on GAAP book value as of the end of the year in which the shareholder notice is given, and the repurchase will be effective as of such date. Payment will be made by April 1 of the following year, following delivery of the audited financial statements for the year in which the repurchase was effective. The repurchase price is subject to a true-up for development on outstanding loss reserves after settlement of all claims relating to the applicable years. Certain shareholders had put in repurchase notices on or before the March 1, 2008 repurchase notice date. The repurchase notice was for shares with a GAAP book value of $145.5 million at December 31, 2008. On January 30, 2009, the Company on behalf of DaVinciRe purchased the shares for $145.5 million, less a $21.8 million reserve holdback. As a result of these purchases, our ownership interest in DaVinciRe increased to 37.6%. We expect our ownership in DaVinciRe to fluctuate over time.
Credit Ratings
Our ratings continue to be among the highest in our industry and continue to be supported by our strong financial position. Our ratings are also supported by our prudent ERM practices which are rated excellent by S&P.
On January 29, 2009, A.M. Best affirmed the financial strength rating (FSR) of A+ (Superior) of Renaissance Reinsurance and Renaissance Europe. A.M. Best also affirmed the issuer credit rating (ICR) of a- on the Companys senior notes. Concurrently, A.M. Best upgraded the FSR to A (Excellent) from A- (Excellent) for Glencoe, Lantana, Stonington and Stonington Lloyds. Additionally, the FSR of DaVinci was affirmed at A (Excellent). The outlook for all our ratings is stable.
On January 21, 2009, S&P initiated coverage of Renaissance Europe, assigning a rating of AA- for both its counterparty credit rating (CCR) and FSR. The outlook on Renaissance Europe is stable.
115
Table of Contents
On December 13, 2007, Standard & Poors raised its CCR on RenaissanceRe A from A-. At the same time, Standard & Poors raised its CCR and FSR on Renaissance Reinsurance to AA- from A+. In addition, Standard & Poors raised its CCR on DaVinci to A+ from A. The outlook on all these companies is stable.
While the ratings of Renaissance Reinsurance are among the highest in our business, adverse ratings actions could have a negative effect on our ability to fully realize current or future market opportunities. Moreover, if our ratings are reduced from their current levels by A.M. Best, Standard & Poors, Moodys or Fitch, we believe our competitive position in the insurance industry would suffer and it would be more difficult for us to market our products. A significant downgrade could result in a substantial loss of business as ceding companies and brokers that place such business move to other reinsurers with higher ratings. We cannot give any assurance regarding whether or to what extent the rating agencies may downgrade our ratings. In addition, it is increasingly common for our reinsurance contracts to contain provisions permitting our clients to cancel coverage pro-rata if our relevant operating subsidiary is downgraded below a certain rating level. Whether a client would exercise this right would depend, among other factors, on the reason for such a downgrade, the extent of the downgrade, the prevailing market conditions and the pricing and availability of replacement reinsurance coverage. Therefore, in the event of a downgrade, it is not possible to predict in advance the extent to which this cancellation right would be exercised, if at all, or what effect such cancellations would have on our financial condition or future operations, but such effect potentially could be material. To date, we are not aware that we have experienced such a cancellation.
Shareholders Equity
Shareholders equity decreased $444.8 million to $3.0 billion at December 31, 2008 from $3.5 billion at December 31, 2007. The significant components of the decrease in shareholders equity includes the repurchase of $428.4 million of our common shares during 2008 as discussed above in Capital Resources, dividends to our common shareholders of $57.9 million, our net loss attributable to common shareholders of $13.3 million, and partially offset by an increase in accumulated other comprehensive income of $30.7 million.
Investments
The table below shows our portfolio of invested assets:
| At December 31, |
2008 | 2007 | ||||||||||
| (in thousands, except percentages) | ||||||||||||
| U.S. treasuries |
$ | 467,480 | 7.8 | % | $ | 767,785 | 11.5 | % | ||||
| Agencies |
448,521 | 7.4 | 290,194 | 4.4 | ||||||||
| Non-U.S. government |
57,058 | 0.9 | 66,496 | 1.0 | ||||||||
| Corporate |
747,210 | 12.4 | 937,289 | 14.1 | ||||||||
| Mortgage-backed |
1,110,594 | 18.4 | 1,251,582 | 18.9 | ||||||||
| Asset-backed |
166,022 | 2.7 | 601,017 | 9.1 | ||||||||
| Fixed maturity investments available for sale, at fair value |
2,996,885 | 49.6 | 3,914,363 | 59.0 | ||||||||
| Short term investments, at fair value |
2,172,343 | 36.0 | 1,821,549 | 27.4 | ||||||||
| Other investments, at fair value |
773,475 | 12.8 | 807,864 | 12.2 | ||||||||
| Total managed investment portfolio |
5,942,703 | 98.4 | 6,543,776 | 98.6 | ||||||||
| Investments in other ventures, under equity method |
99,879 | 1.6 | 90,572 | 1.4 | ||||||||
| Total investments |
$ | 6,042,582 | 100 | % | $ | 6,634,348 | 100 | % | ||||
At December 31, 2008, we held investments totaling $6.0 billion, compared to $6.6 billion at December 31, 2007, with net unrealized appreciation included in accumulated other comprehensive income of $75.4 million at December 31, 2008, compared to $44.7 million at December 31, 2007. Our investment guidelines stress preservation of capital, market liquidity, and diversification of risk. Notwithstanding the foregoing, our investments are subject to market-wide risks and fluctuations, as well as to risks inherent in particular securities.
116
Table of Contents
The large majority of our investments consist of highly rated fixed income securities. We also have an allocation to other investments, including hedge funds, private equity partnerships, senior secured bank loan funds and other investments. At December 31, 2008, these other investments totaled $773.5 million, or 12.8%, of our total investments (2007 $807.9 million or 12.2%).
At December 31, 2008, our fixed maturities available for sale and short term investment portfolio had a dollar-weighted average credit quality rating of AA (2007 AA). At December 31, 2008, our average yield to maturity on our fixed maturity investments available for sale and our short term investment portfolio was 2.8% (2007 4.5%), before investment expenses. At December 31, 2008, our non-investment grade fixed maturity investments available for sale totaled $58.5 million or 2.0% of our fixed maturity investments available for sale (2007 $73.7 million or 1.9%, respectively). In addition, within our other investments category we have several funds that invest in non-investment grade fixed income securities and non-investment grade cat-linked securities. At December 31, 2008, the funds that invest in non-investment grade fixed income securities and non-investment grade cat-linked securities totaled $317.1 million (2007 $283.4 million).
We hold a significant amount of short term investments. Short term investments are managed as part of our investment portfolio and have a maturity of one year or less when purchased. Short term investments are carried at fair value. As of December 31, 2008, we had $2,172.3 million of short term investments (2007 $1,821.5 million).
Our target benchmark portfolio for our fixed maturities and short term investments currently has a 2.6 year duration. Our duration at December 31, 2008 was 1.5 years (2007 1.8 years), reflecting our view that the current level of rates affords inadequate compensation for the assumption of additional interest rate risk associated with longer duration. From time to time, we may reevaluate the duration of our portfolio in light of the duration of our liabilities and market conditions.
As with other fixed income investments, the value of our fixed maturity investments will fluctuate with changes in the interest rate environment and when changes occur in the overall investment market and in overall economic conditions. Additionally, our differing asset classes expose us to other risks which could cause a reduction in the value of our investments. Examples of some of these risks include:
| | Changes in the overall interest rate environment can expose us to prepayment risk on our mortgage-backed investments. When interest rates decline, consumers will generally make prepayments on their mortgages and, as a result, our investments in mortgage-backed securities will be repaid to us more quickly than we might have originally anticipated. When we receive these prepayments, our opportunities to reinvest these proceeds back into the investment markets will likely be at reduced interest rates. Conversely, when interest rates increase, consumers will generally make fewer prepayments on their mortgages and, as a result, our investments in mortgage-backed securities will be repaid to us less quickly than we might have originally anticipated. This will increase the duration of our portfolio, which is disadvantageous to us in a rising interest rate environment. |
| | Our investments in mortgage-backed securities are also subject to default risk. This risk is due in part to defaults on the underlying securitized mortgages, which would decrease the market value of the investment and be disadvantageous to us. |
| | Our investments in debt securities of other corporations are exposed to losses from insolvencies of these corporations, and our investment portfolio can also deteriorate based on reduced credit quality of these corporations. We are also exposed to widening credit spreads even if specific securities are not downgraded. |
| | Our investments in asset-backed securities are subject to prepayment risks, as noted above, and to the structural risks of these securities. The structural risks primarily emanate from the priority of each security in the issuers overall capital structure. We are also exposed to widening credit spreads. |
| | Within our other investments category, we have several funds that invest in non-investment grade fixed income securities as well as securities denominated in foreign currencies. These investments |
117
Table of Contents
| expose us to losses from insolvencies and other credit-related issues. We are also exposed to fluctuations in foreign exchange rates that may result in realized losses to us if our exposures are not hedged or if our hedging strategies are not effective and also to widening of credit spreads. |
The following table summarizes the fair value by contractual maturity of our fixed maturity investment portfolio available for sale at the dates indicated. Actual maturities may differ from contractual maturities because borrowers may have the right to call or prepay obligations with or without penalty.
| At December 31, |
2008 | 2007 | ||||||||||
| (in thousands, except percentages) | ||||||||||||
| Due in less than one year |
$ | 115,316 | 3.8 | % | $ | 385,497 | 9.8 | % | ||||
| Due after one through five years |
1,327,837 | 44.4 | 1,323,586 | 33.8 | ||||||||
| Due after five through ten years |
183,396 | 6.1 | 267,579 | 6.8 | ||||||||
| Due after ten years |
93,720 | 3.1 | 85,102 | 2.2 | ||||||||
| Mortgage-backed securities |
1,110,594 | 37.1 | 1,251,582 | 32.0 | ||||||||
| Asset-backed securities |
166,022 | 5.5 | 601,017 | 15.4 | ||||||||
| Total fixed maturities available for sale, at fair value |
$ | 2,996,885 | 100.0 | % | $ | 3,914,363 | 100.0 | % | ||||
The following table summarizes the composition of the fair value of our fixed maturity investments available for sale at the dates indicated by ratings as assigned by S&P, or Moodys and/or other rating agencies when S&P ratings were not available.
| At December 31, |
2008 | 2007 | ||||||||||
| (in thousands, except percentages) | ||||||||||||
| AAA |
$ | 2,524,500 | 84.2 | % | $ | 3,130,143 | 80.0 | % | ||||
| AA |
147,405 | 4.9 | 404,173 | 10.3 | ||||||||
| A |
200,318 | 6.7 | 182,780 | 4.7 | ||||||||
| BBB |
66,123 | 2.2 | 123,529 | 3.1 | ||||||||
| Non-investment grade |
58,539 | 2.0 | 73,738 | 1.9 | ||||||||
| Total fixed maturities available for sale, at fair value |
$ | 2,996,885 | 100.0 | % | $ | 3,914,363 | 100.0 | % | ||||
The Companys fixed maturity investments are classified as available for sale and are reported at fair value. The net unrealized appreciation or depreciation on these investments is included in accumulated other comprehensive income. Net investment income includes interest income together with amortization of market premiums and discounts and is net of investment management and custody fees. The amortization of premium and accretion of discount for fixed maturity investments is computed using the effective yield method. The fair values of our fixed maturity investments are based on quoted market prices, or when such prices are not available, by reference to broker or trader bid indications and/or internal pricing valuation techniques.
Realized gains or losses on the sale of fixed maturity investments are determined using the first in first out cost method and include adjustments to the cost for declines in value that are considered to be other than temporary. The Company routinely assesses whether declines in the fair value of its fixed maturity investments below cost represent impairments that are considered other than temporary. There are several factors that are considered in the assessment of impairment of a security, which include (i) the time period during which there has been a significant decline below cost, (ii) the extent of the decline below cost, (iii) the Companys intent and ability to hold the security, (iv) the potential for the security to recover in value, (v) an analysis of the financial condition of the issuer and (vi) an analysis of the collateral structure and credit support of the security, if applicable. Where the Company has determined that there is an other than temporary decline in the fair value of the security, the cost of the security is written down to its fair value and the unrealized loss at the time of the determination is charged to income.
118
Table of Contents
During 2008, the Company recorded $217.0 million (2007 $25.5 million, 2006 $46.4 million) in other than temporary impairment charges. The other than temporary impairment charges in 2008 were primarily due to widening credit spreads during 2008 as a result of the turmoil in the financial and capital markets and the other than temporary impairment charges in 2007 and 2006 were due to rising interest rates. We recognized impairment charges for principally all of our fixed maturity investments available for sale that were in an unrealized loss position at the end of each quarter for the years ending December 31, 2008, 2007 and 2006 as we do not currently have the intent to hold them until they fully recover in value. Credit-related impairment charges were $8.3 million, $nil, and $0.1 million in 2008, 2007 and 2006, respectively, and relate to impaired securities which the Company believes it will not be able to recover the full principal amount if held to maturity. The Company had essentially no fixed maturity investments which were carried at an unrealized loss as of December 31, 2008, 2007 and 2006.
119
Table of Contents
Credit Rating and Yield to Maturity
The following table summarizes the composition of the amortized cost and fair value of our fixed maturity investments available for sale, short term investments and other investments at the date indicated by ratings as assigned by S&P, or Moodys and/or other rating agencies when S&P ratings were not available and the respective yield to maturity.
| At December 31, 2008 |
Credit Rating (1) | ||||||||||||||||||||||||||||||||||||
| Amortized Cost |
Fair Value |
% of Total Managed Investment Portfolio |
Yield to Maturity |
AAA | AA | A | BBB |
Non- Investment Grade |
Not Rated | ||||||||||||||||||||||||||||
| (in thousands) | |||||||||||||||||||||||||||||||||||||
| Short term investments |
$ | 2,172,343 | $ | 2,172,343 | 36.6 | % | 0.3 | % | $ | 2,071,671 | $ | 39,397 | $ | 59,059 | $ | 1,022 | $ | 1,194 | $ | | |||||||||||||||||
| 100.0 | % | 95.4 | % | 1.8 | % | 2.7 | % | 0.0 | % | 0.1 | % | 0.0 | % | ||||||||||||||||||||||||
| Fixed maturity investments available for sale |
|||||||||||||||||||||||||||||||||||||
| U.S. treasuries and agencies |
|||||||||||||||||||||||||||||||||||||
| U.S. treasuries |
462,489 | 467,480 | 7.9 | % | 1.5 | % | 467,480 | | | | | | |||||||||||||||||||||||||
| Agency debt Fannie Mae & Freddie Mac |
370,519 | 385,229 | 6.4 | % | 1.9 | % | 385,229 | | | | | | |||||||||||||||||||||||||
| Other agencies |
61,008 | 63,292 | 1.1 | % | 1.9 | % | 63,292 | | | | | | |||||||||||||||||||||||||
| Total agency debt |
431,527 | 448,521 | 7.5 | % | 1.9 | % | 448,521 | | | | | | |||||||||||||||||||||||||
| Total U.S. treasuries and agencies |
894,016 | 916,001 | 15.4 | % | 1.7 | % | 916,001 | | | | | | |||||||||||||||||||||||||
| Non U.S. government |
53,592 | 57,058 | 1.0 | % | 5.9 | % | 27,483 | 8,520 | 226 | 11,022 | 9,807 | | |||||||||||||||||||||||||
| Corporate |
719,234 | 747,210 | 12.6 | % | 5.1 | % | 305,546 | 138,885 | 200,092 | 54,362 | 48,325 | | |||||||||||||||||||||||||
| Mortgage-backed securities |
|||||||||||||||||||||||||||||||||||||
| Residential mortgage-backed securities |
|||||||||||||||||||||||||||||||||||||
| Agency securities |
731,679 | 756,902 | 12.7 | % | 4.0 | % | 756,902 | | | | | | |||||||||||||||||||||||||
| Non-agency securities |
70,629 | 70,916 | 1.2 | % | 11.9 | % | 70,374 | | | 542 | | | |||||||||||||||||||||||||
| Non-agency securities Alt A |
27,475 | 27,756 | 0.5 | % | 15.6 | % | 27,152 | | | 197 | 407 | | |||||||||||||||||||||||||
| Non-agency securities Sub-prime |
| | 0.0 | % | 0.0 | % | | | | | | | |||||||||||||||||||||||||
| Total residential mortgage-backed securities |
829,783 | 855,574 | 14.4 | % | 5.0 | % | 854,428 | | | 739 | 407 | | |||||||||||||||||||||||||
| Commercial Mortgage Backed Securities |
254,373 | 255,020 | 4.3 | % | 10.5 | % | 255,020 | | | | | | |||||||||||||||||||||||||
| Total mortgage-backed securities |
1,084,156 | 1,110,594 | 18.7 | % | 6.3 | % | 1,109,448 | | | 739 | 407 | | |||||||||||||||||||||||||
| Asset-backed securities |
|||||||||||||||||||||||||||||||||||||
| Auto |
95,798 | 95,812 | 1.6 | % | 8.5 | % | 95,812 | | | | | | |||||||||||||||||||||||||
| Credit cards |
12,053 | 12,056 | 0.2 | % | 6.5 | % | 12,056 | | | | | | |||||||||||||||||||||||||
| Other Stranded cost |
7,638 | 7,639 | 0.1 | % | 5.3 | % | 7,639 | | | | | | |||||||||||||||||||||||||
| Other |
50,504 | 50,515 | 0.8 | % | 8.2 | % | 50,515 | | | | | | |||||||||||||||||||||||||
| Total asset-backed securities |
165,993 | 166,022 | 2.7 | % | 8.1 | % | 166,022 | | | | | | |||||||||||||||||||||||||
| Total securitized assets |
1,250,149 | 1,276,616 | 21.4 | % | 6.2 | % | 1,275,470 | | | 739 | 407 | | |||||||||||||||||||||||||
| Total fixed maturity investments available for sale |
2,916,991 | 2,996,885 | 50.4 | % | 4.7 | % | 2,524,500 | 147,405 | 200,318 | 66,123 | 58,539 | | |||||||||||||||||||||||||
| 100.0 | % | 84.2 | % | 4.9 | % | 6.7 | % | 2.2 | % | 2.0 | % | 0.0 | % | ||||||||||||||||||||||||
| Other investments |
|||||||||||||||||||||||||||||||||||||
| Private equity partnerships |
258,901 | 4.3 | % | | | | | | 258,901 | ||||||||||||||||||||||||||||
| Senior secured bank loan funds |
215,870 | 3.6 | % | | | | | 215,870 | | ||||||||||||||||||||||||||||
| Hedge funds |
105,838 | 1.8 | % | | | | | | 105,838 | ||||||||||||||||||||||||||||
| Catastrophe bonds |
93,085 | 1.6 | % | | 23,430 | | | 68,356 | 1,299 | ||||||||||||||||||||||||||||
| Non-U.S. fixed income funds |
81,719 | 1.4 | % | | | | 59,343 | 22,376 | | ||||||||||||||||||||||||||||
| Miscellaneous other investments |
18,062 | 0.3 | % | | | | 8,880 | | 9,182 | ||||||||||||||||||||||||||||
| Total other investments |
773,475 | 13.0 | % | | 23,430 | | 68,223 | 306,602 | 375,220 | ||||||||||||||||||||||||||||
| Total managed investment portfolio |
$ | 5,942,703 | 100.0 | % | $ | 4,596,171 | $ | 210,232 | $ | 259,377 | $ | 135,368 | $ | 366,335 | $ | 375,220 | |||||||||||||||||||||
| 100.0 | % | 77.3 | % | 3.5 | % | 4.4 | % | 2.3 | % | 6.2 | % | 6.3 | % | ||||||||||||||||||||||||
| (1) | The credit ratings included in this table are those assigned by Standard & Poors Corporation. The Company has grouped short term investments with an A-1+ and A-1 short-term issue credit rating as AAA, short term investments with A-2 short-term issue credit rating as AA and short term investments with an A-3 short-term issue credit rating as A. |
120
Table of Contents
The following table summarizes the composition of the fair value of our corporate fixed maturity investments available for sale at the date indicated by ratings as assigned by S&P, or Moodys and/or other rating agencies when S&P ratings were not available.
| At December 31, 2008 |
||||||||||||||||||
| Sector |
Total | AAA | AA | A | BBB | Non-Investment Grade |
||||||||||||
| (in thousands) | ||||||||||||||||||
| Financials |
$ | 546,493 | $ | 301,366 | $ | 117,367 | $ | 107,720 | $ | 9,775 | $ | 10,265 | ||||||
| Industrial, utilities and energy |
68,675 | 2,644 | 3,546 | 31,316 | 16,897 | 14,272 | ||||||||||||
| Consumer |
67,566 | 1,536 | 17,972 | 25,247 | 9,290 | 13,521 | ||||||||||||
| Communications and technology |
56,943 | | | 32,586 | 16,330 | 8,027 | ||||||||||||
| Basic materials |
7,533 | | | 3,223 | 2,070 | 2,240 | ||||||||||||
| Total corporate fixed maturity investments available for sale |
$ | 747,210 | $ | 305,546 | $ | 138,885 | $ | 200,092 | $ | 54,362 | $ | 48,325 | ||||||
The following table summarizes the composition of the fair value of the fixed maturity investments available for sale and short term investments of our top ten corporate issuers at the date indicated.
| At December 31, 2008 |
|||||||||
| Issuer |
Total | Short term investments |
Fixed maturity investments available for sale |
||||||
| (in thousands) | |||||||||
| General Electric Company |
$ | 134,576 | $ | | $ | 134,576 | |||
| JPMorgan Chase & Co. |
66,200 | 35,952 | 30,248 | ||||||
| Sovereign Bancorp Inc. |
51,491 | | 51,491 | ||||||
| Wells Fargo & Company |
44,965 | | 44,965 | ||||||
| U.S. Bancorp |
28,829 | 7,998 | 20,831 | ||||||
| New York Community Bancorp, Inc. |
25,770 | | 25,770 | ||||||
| PNC Financial Service |
21,292 | 12,897 | 8,395 | ||||||
| Regions Financial Corporation |
20,331 | | 20,331 | ||||||
| SunTrust Banks Inc. |
19,016 | | 19,016 | ||||||
| Bank of America Corporation |
18,059 | | 18,059 | ||||||
| Total |
$ | 430,529 | $ | 56,847 | $ | 373,682 | |||
Other Investments
The table below shows our portfolio of other investments:
| At December 31, |
2008 | 2007 | ||||
| (in thousands) | ||||||
| Private equity partnerships |
$ | 258,901 | $ | 301,446 | ||
| Senior secured bank loan funds |
215,870 | 158,203 | ||||
| Hedge funds |
105,838 | 126,417 | ||||
| Catastrophe bonds |
93,085 | 95,535 | ||||
| Non-U.S. fixed income funds |
81,719 | 126,252 | ||||
| Miscellaneous other investments |
18,062 | 11 | ||||
| Total other investments |
$ | 773,475 | $ | 807,864 | ||
121
Table of Contents
The fair value of certain of our fund investments, which principally include hedge funds, private equity partnerships, senior secured bank loan funds and non-U.S. fixed income funds, is generally established on the basis of the net valuation criteria established by the managers of such investments, if applicable. These net valuations are determined based upon the valuation criteria established by the governing documents of such investments. Such valuations may differ significantly from the values that would have been used had ready markets existed for the shares, partnership interests or notes. Many of our fund investments are subject to restrictions on redemptions and sales which are determined by the governing documents and limit our ability to liquidate these investments in the short term. In addition, due to a lag in reporting, some of our fund managers, fund administrators, or both, are unable to provide final fund valuations as of our current reporting date. In these circumstances, we estimate the fair value of these funds by starting with the prior months or quarters fund valuation, adjusting these valuations for capital calls, redemptions or distributions and the impact of changes in foreign currency exchange rates, and then estimating the return for the current period. In circumstances in which we estimate the return for the current period, we use all credible information available to us. This principally includes preliminary estimates reported to us by our fund managers, obtaining the valuation of underlying portfolio investments where such underlying investments are publicly traded and therefore have a readily observable price, using information that is available to us with respect to the underlying investments, reviewing various indices for similar investments or asset classes, as well as estimating returns based on the results of similar types of investments for which we have reported results, or other valuation methods, as necessary. Actual final fund valuations may differ from our estimates and these differences are recorded in the period they become known as a change in estimate. Our estimate of the fair value of catastrophe bonds are based on quoted market prices, or when such prices are not available, by reference to broker or underwriter bid indications. Interest income, income distributions and realized and unrealized gains and losses on other investments are included in net investment income and totaled negative $219.6 million (2007 positive $105.5 million, 2006 positive $65.7 million) of which $259.4 million was related to net unrealized losses (2007 net unrealized gains of $47.3 million, 2006 net unrealized gains of $30.1 million).
We have committed capital to private equity partnerships of $586.7 million, of which $348.7 million has been contributed at December 31, 2008. In the future, we may enter into additional commitments in respect of private equity partnerships or individual portfolio company investment opportunities.
Investments in Other Ventures, under Equity Method
The table below shows our investments in other ventures, under equity method:
| 2008 | 2007 | |||||||||||||||
| Year ended December 31, |
Investment | Ownership % | Carrying Value |
Investment | Ownership % | Carrying Value |
||||||||||
| (in thousands, except percentages) | ||||||||||||||||
| ChannelRe |
$ | 119,697 | 32.7 | $ | | $ | 119,697 | 32.7 | $ | | ||||||
| Tower Hill Companies |
50,000 | 25.0 | 47,699 | | | | ||||||||||
| Top Layer Re |
13,125 | 50.0 | 25,367 | 13,125 | 50.0 | 28,982 | ||||||||||
| Tower Hill |
10,000 | 28.6 | 15,227 | 10,000 | 28.6 | 14,382 | ||||||||||
| Aladdin |
| | | 25,500 | 14.6 | 25,500 | ||||||||||
| Starbound II |
| | | 19,237 | 17.1 | 21,708 | ||||||||||
| Other |
12,040 | n/a | 11,586 | | | | ||||||||||
| Total investments in other ventures, under equity method |
$ | 204,862 | $ | 99,879 | $ | 187,559 | $ | 90,572 | ||||||||
On July 1, 2008, the Company invested $50.0 million in the Tower Hill Companies representing a 25.0% equity ownership. Included in the purchase price was $40.0 million of other intangibles and $7.8 million of goodwill, which, in accordance with generally accepted accounting principles, are recorded as Investments
122
Table of Contents
in other ventures, under equity method rather than Goodwill and other intangibles on the Companys consolidated balance sheet. The Companys share of the equity in earnings of the Tower Hill Companies is recorded one quarter in arrears.
Investments in other ventures, under equity method includes the Companys investment in ChannelRe of $nil (2007 $nil). During 2007, ChannelRe, suffered a significant net loss which reduced ChannelRes GAAP shareholders equity below $nil. The net loss was driven by unrealized mark-to-market losses related to financial guaranty contracts accounted for as derivatives under GAAP. As a result, the Company reduced its carried value in ChannelRe to $nil which negatively impacted our net income by $167.2 million in 2007. As a result of reducing the Companys carried value in ChannelRe to $nil, combined with the fact that the Company has no further contractual obligations to provide capital or other support to ChannelRe, the Company believes it currently has no further negative economic exposure to ChannelRe. Since ChannelRe remained in a negative shareholders equity position during 2008, the Companys investment in ChannelRe continues to be carried at $nil. It is possible that with the adoption of FAS 157 by ChannelRe in 2008, that in future periods the nonperformance risk or own credit risk portion of ChannelRes mark-to-market on its financial guaranty contracts accounted for as derivatives under GAAP may increase, or that the underlying mark-to-market on ChannelRes financial guaranty contracts accounted for as derivatives under GAAP may decrease, or both, which could result in ChannelRe returning to a positive equity position, at which time the Company would then record its share of ChannelRes net income, subject to impairment, or the Companys share of ChannelRes net loss.
During the fourth quarter of 2007, the Company invested $25.5 million in the preferred equity of Aladdin, representing a 14.6% ownership interest. Due to adverse market conditions, Aladdin elected to not write any business and subsequently announced during the fourth quarter of 2008, that it would wind-up its operations and return the residual capital to shareholders. The Company expects to receive the majority of its original investment, less administrative expenses incurred. At December 31, 2008, the Company had recorded a receivable of $24.4 million in other assets for the expected liquidation value of Aladdin. During January 2009, the Company received an initial payout of $24.2 million with the final distribution expected to be received during 2009.
Investments in other ventures, under equity method also includes an investment in Top Layer Re of $25.4 million (2007 $29.0 million) and in Tower Hill Holdings Inc. (Tower Hill) of $15.2 million (2007 $14.4 million). We originally invested $13.1 million and $10.0 million in Top Layer Re and Tower Hill, respectively, representing a 50.0% and 28.6% ownership, respectively.
In May 2007, the Company invested $10.0 million in Starbound II, which represents a 9.8% equity ownership interest in Starbound II and in December 2007 the Company invested an additional $9.2 million in Starbound II which increased the Companys investment and ownership percentage to $19.2 million and 17.1%, respectively. Effective July 31, 2008, Starbound II repurchased the outstanding shares of its investors at book value; as a result, the Company now owns 100% of Starbound II and consequently, Starbound II became a consolidated entity effective August 1, 2008.
The equity in earnings (losses) of ChannelRe, Tower Hill and Tower Hill Companies are reported one quarter in arrears, except that our 2007 results reflect the estimated fourth quarter charge from ChannelRe as it relates to unrealized mark-to-market losses in ChannelRes portfolio of financial guaranty contracts accounted for as derivatives under GAAP.
RIHL
RIHL, a wholly owned subsidiary of the Company, holds investment grade fixed income securities and short term investments and was formed to enhance administrative efficiency and take advantage of the increased benefits and reduced costs ordinarily associated with the management of large investment portfolios of different subsidiaries in the same group. In addition, the administrative efficiency afforded by the use of RIHL facilitates the establishment of our collateralized letter of credit facility on advantageous terms that we believe would otherwise not be available. Through RIHL, certain of our operating subsidiaries invest in a diversified portfolio of highly liquid debt securities which are recorded at fair value. RIHL has been assigned
123
Table of Contents
a rating of AAAf/S2 by S&P and 100% of the securities held through RIHL have been assigned a rating of AA or higher by nationally recognized rating agencies. We may redeem our interests in RIHL at the current net asset value no more frequently than monthly. Third party service providers perform custodial functions in respect of RIHL, including valuation of the investment assets held through RIHL. Currently, external investment managers manage the assets held through RIHL, pursuant to written investment guidelines.
Under the terms of certain reinsurance contracts, certain of our subsidiaries and joint ventures are required to provide letters of credit to reinsureds in respect of reported claims and/or unearned premiums. We maintain a facility which, as of December 31, 2008, makes available to our operating subsidiaries and joint ventures letters of credit having an aggregate face amount not to exceed $1.4 billion. To support the facility, our participating operating subsidiaries and joint ventures have pledged RIHL shares and other securities owned by them as collateral. At February 11, 2009, we had $1,019.1 million of letters of credit with effective dates on or before December 31, 2008 outstanding under our $1.4 billion letter of credit facility and $1,024.1 million of total letters of credit outstanding under all facilities.
Effects of Inflation
The potential exists, after a catastrophe loss, for the development of inflationary pressures in a local economy. The anticipated effects on us are considered in our catastrophe loss models. The effects of inflation are also considered in pricing and in estimating reserves for unpaid claims and claim expenses. The actual effects of this post-event inflation on our results cannot be accurately known until claims are ultimately settled.
Off-Balance Sheet and Special Purpose Entity Arrangements
At December 31, 2008, we have not entered into any off-balance sheet arrangements, as defined by Item 303(a)(4) of Regulation S-K.
New Accounting Pronouncements
Fair Value Measurements
In September 2006, the FASB issued FAS 157. FAS 157 clarifies the definition of fair value, establishes a framework for measuring fair value and expands disclosures about fair value measurements. FAS 157 clarifies that fair value is a market-based measurement, not an entity-specific measurement, and sets out a fair value hierarchy with the highest priority being quoted prices in active markets and the lowest priority to unobservable data. Further, FAS 157 requires tabular disclosures of the fair value measurements by level within the fair value hierarchy. FAS 157 became effective for us on January 1, 2008. The adoption of FAS 157 did not have a material impact on the Companys statements of operations and financial condition when adopted.
In order to address the application of FAS 157 in a market that is not active, the FASB issued FASB Staff Position 157-3 (FSP 157-3) in October 2008. FSP 157-3 clarifies the application of FAS 157 in a market that is not active and provides examples to illustrate key considerations to determine the fair value of a financial asset when the market for that financial asset is not active. FSP 157-3 applies to financial assets within the scope of accounting pronouncements that require or permit fair value measurements in accordance with FAS 157 and became effective upon issuance, including prior periods for which financial statements have not been issued. The application of FSP 157-3 did not have a material impact on the Companys statements of operations and financial condition.
The Fair Value Option for Financial Assets and Financial Liabilities
In February 2007, the FASB issued FASB Statement No. 159, The Fair Value Option for Financial Assets and Financial Liabilities (FAS 159). FAS 159 permits an entity to choose, at specified election dates, to measure eligible financial instruments and certain other items at fair value that are not currently required to be measured at fair value. An entity shall report unrealized gains and losses on items for which the fair value option has been elected in earnings at each subsequent reporting date. Upfront costs and fees related to items for which the fair value option is elected shall be recognized in earnings as incurred and not
124
Table of Contents
deferred. FAS 159 also establishes presentation and disclosure requirements designed to facilitate comparisons between entities that choose different measurement attributes for similar types of assets and liabilities. FAS 159 became effective for us on January 1, 2008 and we elected the fair value option for certain financial assets and financial liabilities. An entity shall report the effect of the first remeasurement to fair value as a cumulative-effect adjustment to the opening balance of retained earnings. The adoption of FAS 159 did not have a material impact on the Companys statements of operations and financial condition when adopted.
Business Combinations and Accounting and Reporting of Noncontrolling Interest in Consolidated Financial Statements
On December 4, 2007, the FASB issued Statement No. 141(R), Business Combinations (FAS 141(R)) and Statement No. 160, Accounting and Reporting of Noncontrolling Interest in Consolidated Financial Statements, an amendment of ARB No. 51 (FAS 160). These new standards will significantly change the accounting for and reporting of business combination transactions and noncontrolling (minority) interests in consolidated financial statements. FAS 141(R) expands the scope of acquisition accounting to all transactions and circumstances under which control of a business is obtained. Under FAS 160, noncontrolling interests are classified as a component of consolidated shareholders equity and minority interest accounting is eliminated such that earnings attributable to noncontrolling interests are reported as part of consolidated earnings and not as a separate component of income or expense. FAS 141(R) and FAS 160 are required to be adopted simultaneously and are effective for the first annual reporting period beginning on or after December 15, 2008. Earlier adoption is prohibited. We are currently evaluating the potential impacts of the adoption of FAS 141(R) and FAS 160 on the Companys statements of operations and financial condition when adopted.
Disclosures about Derivative Instruments and Hedging Activities
In March 2008, the FASB issued Statement No. 161, Disclosures about Derivative Instruments and Hedging Activities an amendment of FASB Statement No. 133 (FAS 161). FAS 161 requires entities to provide enhanced disclosures about (a) how and why an entity uses derivative instruments, (b) how derivative instruments and related hedged items are accounted for under FASB Statement No. 133, Accounting for Derivative Instruments and Hedging Activities and its related interpretations and (c) how derivative instruments and related hedged items affect an entitys financial position, results of operations and cash flows. FAS 161 requires qualitative disclosures about objectives and strategies for using derivatives, quantitative disclosures about fair value amounts of gains and losses on derivative instruments and credit-risk related contingent features in derivative instruments. FAS 161 is to be applied prospectively and is effective for financial statements issued for fiscal years and interim periods beginning after November 15, 2008, with early application encouraged. In years after initial adoption, FAS 161 requires comparative disclosures only for periods subsequent to initial adoption. FAS 161 is a disclosure standard and as such is not expected to impact the Companys consolidated statements of operations and financial condition when adopted.
Determining Whether Instruments Granted in Share-Based Payment Transactions Are Participating Securities
In June 2008, the FASB issued Emerging Issues Task Force 03-6-1, Determining Whether Instruments Granted in Share-Based Payment Transactions Are Participating Securities (EITF 03-6-1). EITF 03-6-1 addresses whether instruments granted in share-based payment transactions are participating securities prior to vesting and, therefore, need to be included in the earnings allocation in computing earnings per share under Statement No. 128, Earnings per Share. EITF 03-6-1 provides guidance on the calculation of earnings per share for share-based payment awards with rights to dividends or dividend equivalents. EITF 03-6-1 is effective for financial statements issued for fiscal years beginning after December 15, 2008, and interim periods within those years. The adoption of EITF 03-6-1 is not expected to have a material effect on the Companys consolidated statements of operations and financial condition when adopted.
125
Table of Contents
Contractual Obligations
| At December 31, 2008 |
Total |
Less than 1 year |
1-3 years | 3-5 years |
More than 5 years |
||||||||||
| (in thousands) | |||||||||||||||
| Long term debt obligations (1) |
|||||||||||||||
| 5.875% Senior Notes |
$ | 124,240 | $ | 5,875 | $ | 11,750 | $ | 106,615 | $ | | |||||
| RenaissanceRe revolving credit facility (2) |
157,650 | 157,650 | | | | ||||||||||
| DaVinciRe revolving credit facility (2) |
213,973 | 10,000 | 203,973 | | | ||||||||||
| Private equity and investment fund commitments (3) |
239,122 | 239,122 | | | | ||||||||||
| Operating lease obligations |
44,723 | 6,782 | 12,605 | 11,042 | 14,294 | ||||||||||
| Capital lease obligations |
50,289 | 2,893 | 5,112 | 4,834 | 37,450 | ||||||||||
| Other secured liabilities |
77,420 | 77,420 | | | | ||||||||||
| Obligations under credit derivative contracts |
215 | 43 | 86 | 86 | | ||||||||||
| Reverse repurchase obligation |
50,128 | 50,128 | | | | ||||||||||
| Payable for investments purchased |
378,111 | 378,111 | | | | ||||||||||
| Reserve for claims and claim expenses (4) |
2,160,612 | 745,348 | 611,235 | 351,701 | 452,328 | ||||||||||
| Total contractual obligations |
$ | 3,496,483 | $ | 1,673,372 | $ | 844,761 | $ | 474,278 | $ | 504,072 | |||||
| (1) | Includes contractual interest and dividend payments. |
| (2) | The interest on this facility is based on a spread above LIBOR. We have reflected the interest due in 2009 through 2011 based upon the current interest rate on the facility. |
| (3) | The private equity commitments and bank loan fund do not have a defined contractual commitment date and we have therefore included them in the less than one year category. |
| (4) | We caution the reader that the information provided above related to estimated future payment dates of our reserves for claims and claim expenses is not prepared or utilized for internal purposes and that we currently do not estimate the future payment dates of claims and claim expenses. Because of the nature of the coverages that we provide, the amount and timing of the cash flows associated with our policy liabilities will fluctuate, perhaps significantly, and therefore are highly uncertain. We have based our estimates of future claim payments upon benchmark industry payment patterns, drawing upon available relevant sources of loss and allocated loss adjustment expense development data. These benchmarks are revised periodically as new trends emerge. We believe that it is likely that this benchmark data will not be predictive of our future claim payments and that material fluctuations can occur due to the nature of the losses which we insure and the coverages which we provide. |
In certain circumstances, many of our contractual obligations may be accelerated to dates other than those reflected in the table, due to defaults under the agreements governing those obligations (including pursuant to cross-default provisions in such agreements) or in connection with certain changes in control of the Company, if applicable. In addition, in connection with any such default under the agreement governing these obligations, in certain circumstances, these obligations may bear an increased interest rate or be subject to penalties as a result of such a default.
Current Outlook
General Economic Conditions
The United States and other markets around the world have been experiencing deteriorating economic conditions, including substantial and continuing financial market disruptions. If this trend in economic conditions continues or deteriorates further through 2009, we believe it would adversely affect the business environment in our principal markets, and accordingly could adversely affect demand for the products sold by us or our clients. In addition, during an economic downturn, our consolidated credit risk, reflecting our
126
Table of Contents
counterparty dealings with agents, brokers, customers, retrocessionaires, capital providers, parties associated with our investment portfolio, and others, would likely be increased. Moreover, our markets may experience increased inflationary conditions which would cause loss costs to increase.
While the Company continuously monitors the financial markets for opportunities to raise capital or refinance existing obligations on attractive terms, the Company does not currently believe that it requires additional capital in the near term due to its strong current financial position. However, due to the ever present potential for significant volatility in excess capital due primarily to our exposure to potentially significant catastrophic events and if the current financial market disruption should continue, it could prove difficult to raise capital, when needed, on attractive terms or at all. For example, as noted under Liquidity and Capital Resources, the Companys $500.0 million revolving credit facility expires in August 2009 and while the Company may desire to amend this facility or enter into a new facility, we are unable to assure you that we will be able to do so on terms favorable to the Company or at all.
Current conditions in the investment markets, the current interest rate environment and general economic conditions could continue to adversely affect our net investment income on our fixed income investments and our other invested assets. In addition to impacting our reported net income, potential future losses on our investment portfolio, including potential future mark-to-market results, would adversely impact our equity capital. Net investment income is an important contributor to the Companys results of operations, and we currently expect the investment environment to remain challenging for the foreseeable future. We expect the current volatile financial markets and challenging economic conditions to persist for some time and we are unable to predict with certainty when conditions might improve, or the pace or scale of any such improvement.
Market Conditions and Competition
The 2008 hurricane season proved to be an active year meteorologically, with the occurrence of two significant hurricanes, Gustav and Ike, as well as a number of smaller storms such as Dolly, Fay and Hanna, making landfall in the United States. In addition, the dislocations in the investment markets have eroded the capital and surplus of many market participants. We believe these factors have contributed to changes in market conditions by increasing demand for insurance and reinsurance protection, particularly with respect to the U.S. property catastrophe business, and other risk mitigation products, at a time when the supply of new capacity is constrained. We currently expect this increased demand to continue through 2009, and to potentially give rise to increased opportunity for new business, although we also expect competition for this business to remain robust. We are unable to predict how long this situation may persist, although we expect it would be relatively temporary. While the pricing environment has improved somewhat, particularly in property catastrophe lines, as a result of these and other factors, our markets may also experience increased loss costs, decreased pricing flexibility and potentially reduced consumer purchasing power, which could result in somewhat reduced underwriting profitability for the industry overall. We believe that our strong relationships, and track record of superior claims paying and other client service, has and will continue to enable us to compete robustly for the business we find attractive.
The market for our catastrophe reinsurance products is generally dynamic and volatile. The market dynamics noted above, increased or decreased catastrophe loss activity, and changes in the amount of capital in the industry can result in significant changes to the pricing, policy terms and demand for our catastrophe reinsurance contracts over a relatively short period of time. In addition, changes in state-sponsored catastrophe funds such as the FHCF, or the implementation of new government-subsidized or sponsored programs, can dramatically alter market conditions. We believe that the overall trend of increased frequency and severity of catastrophic Gulf and Atlantic Coast storms experienced in recent years may continue for the foreseeable future. Increased understanding of the potential increase in frequency and severity of storms may contribute to increased demand for protection in respect of coastal risks which could impact pricing and terms and conditions in coastal areas over time.
With respect to our Individual Risk segment, prior to recent developments in the financial markets and in our industry, we had expected to experience increasing competition for attractive new programs, and for the retention of our current programs. At this time, we believe it is possible that the increased pricing pressures we had been experiencing across many of the lines of individual risk business we write have begun to moderate as a result of the factors noted above, as well as the prospects for increased fragmentation
127
Table of Contents
amongst certain competitors and other market participants. Market conditions are fluid and evolving and we cannot assure you that pricing conditions in these markets will improve or that we will succeed in growing our business if they do. While we are seeing attractive new opportunities in our multi-peril crop insurance line of business, which now accounts for almost half of our gross premiums written in our Individual Risk segment, premiums in this line of business are inherently volatile as they are driven in part by commodity prices, which are subject to significant short and long term price changes. We plan to continue our disciplined underwriting approach with respect to both the products which we underwrite and the programs as to which we form partnerships. While we continuously and actively consider new or expanded relationships and seek to respond quickly to potential growth opportunities, our in-depth due diligence process means that growth opportunities within this segment take time. We believe that we have established ourselves as an effective and creative, though disciplined, partner, and as a result we are presented with many of the more attractive opportunities to analyze and compete for.
In addition, we continue to expand the capabilities of our ventures unit to explore potential strategic investments and other opportunities. In evaluating such new ventures, we seek an attractive return on equity, the ability to develop or capitalize on a competitive advantage, and opportunities that will not detract from our core operations. We currently expect the ongoing dislocation in the capital and credit markets may present additional, potentially attractive investment and operational opportunities, particularly given our strong reputation, financial resources, and track record of effectively structuring investments and joint ventures.
Legislative and Regulatory Update
In January 2007, the State of Florida enacted legislation which increased the access of primary Florida insurers to the FHCF. Through the FHCF, the State of Florida currently provides below market rate reinsurance of up to $28.0 billion per season, an increase from the previous cap of $16.0 billion, with the State able to further increase the limits up to an additional $4.0 billion per season. Further, the legislation expanded the ability of Citizens Property Insurance Corporation (Citizens), a state-sponsored entity, to compete with private insurance companies, such as ours. In 2008, the Florida legislature considered but did not pass a bill that would reduce the coverage currently provided by the FHCF. In addition, the Florida legislature did pass legislation (the Florida Bill) that, among other things, continued the freeze of Citizens rates until at least July 1, 2009 and capped increases for three years thereafter, revised aspects of the size and allocation of assessments and allowed Citizens to continue to insure homes worth over $1.0 million. In October 2008, the Advisory Council to the FHCF received a report analyzing the significant challenges the FHCF would face, in part in light of the ongoing global financial market dislocation, if required to fund a significant amount of its total potential financial obligations. A failure of the FHCF to honor its obligations would adversely impact the Florida market, and would pose meaningful challenges to the insurers who have purchased coverage from the FHCF, including many of our clients. In light of these issues, Florida stakeholders and policymakers are considering a number of reform initiatives, including a possible reduction in the current limits offered by the FHCF or possible increases in the premiums charged by the FHCF to Citizens and to private insurers. At this time, we cannot estimate the likelihood that any reforms will be enacted into law, or the impact on existing participants in the Florida market, including our clients and investees, on us directly, or on the private Florida insurance market generally, if they are not.
In 2007, the U.S. House of Representatives passed legislation, H.R. 3121, the Flood Insurance Reform and Modernization Act, which would renew, expand and alter the National Flood Insurance Program (NFIP). The NFIP, which is operated by the Federal Emergency Management Agency (FEMA), provides subsidized flood insurance in identified flood plain zones. H.R. 3121 includes a provision that would expand the NFIP to cover damage to or loss of real or related personal property located in the U.S. arising from any windstorm (any hurricane, tornado, cyclone, typhoon, or other wind event). This amendment, as approved by the House, would provide coverage up to $0.5 million for a single-family dwelling, $0.5 million for a dwelling unit within a multiple-dwelling structure, approximately $0.2 million for the contents of a dwelling unit, $1.0 million for non-residential properties, and approximately $0.8 million for the contents of a non-residential property.
128
Table of Contents
Also in 2007, the U.S. House of Representatives approved another proposed bill, H.R. 3355, the Homeowners Defense Act of 2007 comprised of two titles, one that would create a National Catastrophe Risk Consortium and one that would require the U.S. Treasury Department to establish a national homeowners insurance stabilization program. The National Catastrophe Risk Consortium program would allow multiple participating states to pool their respective catastrophic risk insurance or reinsurance wind pools or other residual markets amongst each other. The stabilization program would allow the Treasury Department to make below-cost loans to participating states or their reinsurance pools and/or residual markets.
In 2008, Congress conducted hearings relating to the tax treatment of offshore insurance and is reported to be considering legislation that would adversely affect reinsurance between affiliates and offshore insurance and reinsurance more generally. On September 18, 2008, U.S. Rep. Richard Neal introduced one such proposal, H.R. 6969 (the Neal Bill), a bill which provides that foreign insurers and reinsurers would be capped in deducting reinsurance premiums ceded from U.S. units to offshore affiliates. The bill, which has been referred to the House Ways and Means Committee, would limit deductions for related party reinsurance cessions to the average percentage of premium ceded to unrelated reinsurers (determined in reference to individual business lines). In the fourth quarter of 2008, the Senate Finance Committee released a staff discussion draft, which was substantively similar to the Neal Bill.
To date, none of the above legislation has been approved by the Senate, although their respective sponsors have announced plans to reintroduce these bills in 2009. We can provide no assurance that this legislation or similar legislation will not be adopted. We believe that passage of such legislation would adversely affect us, perhaps materially.
ITEM 7A. QUANTITATIVE AND QUALITATIVE DISCLOSURES ABOUT MARKET RISK
We are principally exposed to five types of market risk: interest rate risk; foreign currency risk; equity price risk; credit risk; and energy and weather-related risk. The Companys investment guidelines permit, subject to approval, investments in derivative instruments such as futures, options, forward contracts and swap agreements, which may be used to assume risks or for hedging purposes.
Interest Rate Risk
Our investment portfolio includes fixed maturity investments available for sale and short term investments, whose fair values will fluctuate with changes in interest rates. We attempt to maintain adequate liquidity in our fixed maturity investments portfolio to fund operations, pay reinsurance and insurance liabilities and claims and provide funding for unexpected events. We seek to manage our interest rate risk in part by monitoring the duration and structure of our investment portfolio.
The aggregate hypothetical loss generated from an immediate adverse parallel shift in the treasury yield curve of 100 basis points would cause a decrease in market value of 1.5%, which equated to a decrease in market value of approximately $77.5 million on a portfolio valued at $5.2 billion at December 31, 2008. The foregoing reflects the use of an immediate time horizon, since this presents the worst-case scenario. Credit spreads are assumed to remain constant in these hypothetical examples.
We use interest rate futures within our portfolio of fixed maturity investments available for sale to manage our exposure to interest rate risk, which can include increasing or decreasing our exposure to this risk. At December 31, 2008, we had $1.6 billion of notional long positions and $134.0 million of notional short positions of Eurodollar, U.S. Treasury and non-U.S. dollar futures contracts. We account for these futures contracts at fair value and record them in our consolidated balance sheet as other assets or other liabilities depending on the rights or obligations. The fair value of these derivatives as recognized in other assets and liabilities in our consolidated balance sheet at December 31, 2008, was $0.1 million (2007 $0.3 million) and $0.1 million (2007 $0.3 million), respectively. During 2008, we recorded gains of $12.4 million (2007 losses of $1.9 million) in our consolidated statement of operations related to these derivatives. The fair value of these derivatives is determined using exchange traded closing prices. The aggregate hypothetical loss generated from an immediate adverse parallel shift in the treasury yield curve of 100 basis points would cause a decrease in market value of our net position in these derivatives of approximately $4.1 million at December 31, 2008. The foregoing reflects the use of an immediate time horizon, since this presents the worst-case scenario. Credit spreads are assumed to remain constant in these hypothetical examples.
129
Table of Contents
Foreign Currency Risk
Our functional currency is the U.S. dollar. We write a portion of our business in currencies other than U.S. dollars and may, from time to time, experience foreign exchange gains and losses and incur underwriting losses in currencies other than U.S. dollars, which will in turn affect our consolidated financial statements. All changes in exchange rates, with the exception of non-U.S. dollar denominated investments classified as available for sale, are recognized currently in our statements of operations.
Our foreign currency policy with regard to our underwriting operations is generally to hold foreign currency assets, including cash, investments and receivables that approximate the foreign currency liabilities, including claims and claim expense reserves and reinsurance balances payable. From time to time, the Company will use foreign currency forward and option contracts to minimize the effect of fluctuating foreign currencies on the value of non-U.S. dollar denominated assets and liabilities associated with our underwriting operations. At December 31, 2008, the Company had notional exposure of $133.0 million (2007 $222.5 million) related to foreign currency forward and option contracts purchased. Our foreign currency and option contracts are recorded at fair value, which is determined principally by obtaining quotes from independent dealers and counterparties. During 2008, we incurred a loss of $21.4 million (2007 gain of $3.6 million), on our foreign currency forward and option contracts related to our underwriting operations.
For our investment operations, we are exposed to currency fluctuations through our investments in non-U.S. dollar fixed maturity investments, short term investments and other investments. At December 31, 2008, our combined investment in these non-U.S. dollar investments was $141.1 million (2007 $183.0 million). To economically hedge our exposure to currency fluctuations from these investments, we have entered into foreign currency forward contracts with net notional exposure of $103.6 million (2007 $123.4 million). In the future, we may choose to increase our exposure to non-U.S. dollar investments. Unrealized foreign exchange gains or losses arising from non-U.S. dollar investments classified as available for sale are recorded in accumulated other comprehensive income. Realized foreign exchange gains or losses from the sale of our non-U.S. dollar available for sale investments, realized and unrealized foreign exchange gains or losses from the sale of our non-U.S. dollar other investments, and foreign exchange gains (losses) associated with our hedging of these non-U.S. dollar investments are recorded in net foreign exchange gains (losses) in our statements of operations. During 2008, we recorded a gain of $5.8 million (2007 loss of $15.1 million) on our foreign currency forward contracts related to hedging our non-U.S. dollar investments. This was offset by a loss of $4.9 million (2007 gain of $20.9 million) on our non-U.S. dollar denominated investments. In addition, we recorded a loss of $3.3 million in accumulated other comprehensive income (2007 $0.4 million) related to the change in unrealized foreign exchange gains (losses) on non-U.S. dollar investments which are classified as available for sale.
Equity Price Risk
We are exposed to equity price risk due to our investment in a warrant to purchase common shares of Platinum, which we carry on our balance sheet at fair value, as well as to our investments in hedge funds, private equity funds and other investments as described below. The risk to the Platinum warrant is the potential for loss in fair value resulting from adverse changes in the price of Platinums common stock. The aggregate fair value of this investment in Platinum was $29.9 million at December 31, 2008. A hypothetical 10 percent decline in the price of Platinum stock, holding all other factors constant, would have resulted in a $6.9 million decline in the fair value of the warrant (assuming no other changes to the inputs to the Black-Scholes option valuation model that we use). The decline in the fair value of the warrant would be recorded in other loss.
We are also indirectly exposed to equity market risk through our investments in: 1) some hedge funds that have net long equity positions; 2) private equity partnerships whose exit strategies often depend on the equity markets; such investments totaled $364.7 million at December 31, 2008 (2007 $427.9 million); and 3) our investments in other ventures, under equity method, which totaled $99.9 million at December 31, 2008 (2007 $90.6 million). A hypothetical 10 percent decline in the prices of these hedge funds, private equity partnerships and investments in other ventures, under equity method, holding all other factors constant, would have resulted in a $46.5 million decline in the fair value of these investments at December 31, 2008.
130
Table of Contents
Credit Risk
Our exposure to credit risk is primarily due to our fixed maturity investments available for sale, short term investments, premiums receivable and ceded reinsurance balances. At December 31, 2008 and 2007, our invested asset portfolio had a dollar weighted average rating of AA. From time to time, we purchase credit derivatives to hedge our exposures in the insurance industry and to assist in managing the credit risk associated with ceded reinsurance. At December 31, 2008, the maximum payments we were obligated to make under credit default swaps was $0.2 million (2007 $1.0 million). The fair value of these credit derivatives, as recognized in other liabilities in our balance sheet at December 31, 2008, was $0.9 million (2007 $0.1 million). During 2008, we recorded gains of $1.1 million (2007 $0.5 million) in our consolidated statement of operations. We account for credit derivatives at fair value and record them on our consolidated balance sheet as other assets or other liabilities depending on the rights or obligations. The fair value of the credit derivatives are determined using industry valuation models. The fair value of these credit derivatives can change based on a variety of factors including changes in credit spreads, default rates and recovery rates, the correlation of credit risk between the referenced credit and the counterparty, and market rate inputs such as interest rates.
We are exposed to credit risk through our equity investment in ChannelRe, a privately held financial guaranty reinsurance company. Our investment in ChannelRe is subject to potentially significant variability, resulting from mark-to-market changes, due to changes in credit market conditions. While the Company has no further negative economic exposure to ChannelRe, it is possible that the mark-to-market will fluctuate, perhaps increasing or decreasing over time, and it is possible that as the underlying securities near maturity, if there are no defaults on the underlying securities for which ChannelRe is obligated, the mark-to-market adjustment could reverse, perhaps materially.
Energy and Weather-Related Derivative Risk
We purchase and sell certain derivative financial products primarily to address weather risks and engage in hedging and trading activities related to these risks. The trading markets for the instruments in which we participate are generally linked to weather, other natural phenomena, or products or indices linked in part to such phenomena, such as heating and cooling degree days, precipitation, energy production and prices, and commodity prices. The fair value of these contracts is obtained through the use of quoted market prices, or in the absence of such quoted prices, industry or internal valuation models. These contracts are recorded on our balance sheet at December 31, 2008, in other assets and other liabilities and totaled $41.7 million and $38.8 million, respectively (2007 $15.9 million and $21.1 million, respectively). During 2008, the Company generated income related to these derivatives of $33.7 million (2007 incurred losses of $1.1 million) which are included in other income (loss) and represents net settlements and changes in the fair value of these contracts.
In addition, we have entered into a credit derivatives agreement with respect to cat-linked securities whereby we have sold cat-linked securities with a par amount of $77.4 million at December 31, 2008 (2007 $88.9 million) to a bank, while retaining the underlying risk. The agreement allows us to repurchase these securities at par and obligates us to repurchase the securities under certain circumstances including catastrophe triggering events and events of default. As a result of this transaction, we are receiving the spread over LIBOR for each of the cat-link securities subject to the credit derivatives agreement, less a financing fee. The credit derivatives agreement is accounted for at fair value with changes in fair value recognized in other loss. We recognized $2.2 million (2007 $2.0 million) of other income in our consolidated statements of operations in 2008 from this transaction. A 10% change decrease in the value of securities underlying the credit derivatives agreement would negatively impact our results by $7.7 million.
ITEM 8. FINANCIAL STATEMENTS AND SUPPLEMENTARY DATA
Reference is made to Item 15(a) of this Report for the Consolidated Financial Statements of RenaissanceRe and the Notes thereto, as well as the Schedules to the Consolidated Financial Statements.
ITEM 9. CHANGES IN AND DISAGREEMENTS WITH ACCOUNTANTS ON ACCOUNTING AND FINANCIAL DISCLOSURE
None.
131
Table of Contents
ITEM 9A. CONTROLS AND PROCEDURES
Disclosure Controls and Internal Controls: We have designed various disclosure controls and procedures (as defined in Rules 13a-15(e) and Rule 15d-15(e) under the Exchange Act), to help ensure that information required to be disclosed in our periodic Exchange Act reports, such as this report, is recorded, processed, summarized and reported on a timely and accurate basis. Our disclosure controls and procedures are also designed with the objective of ensuring that such information is accumulated and communicated to our senior management, including our Chief Executive Officer and Chief Financial Officer, as appropriate to allow timely decisions regarding required disclosure. Our internal control over financial reporting is a process designed to provide reasonable assurance regarding the reliability of financial reporting and the preparation of financial statements for external purposes in accordance with generally accepted accounting principles and includes those policies and procedures that: (1) pertain to the maintenance of records that in reasonable detail accurately and fairly reflect the transactions and dispositions of the assets of the issuer; (2) provide reasonable assurance that transactions are recorded as necessary to permit preparation of financial statements in accordance with generally accepted accounting principles, and that receipts and expenditures of the issuer are being made only in accordance with authorizations of management and directors of the issuer; and (3) provide reasonable assurance regarding prevention or timely detection of unauthorized acquisition, use or disposition of the issuers assets that could have a material effect on financial statements.
Limitations on the effectiveness of controls: Our Board of Directors and management, including our Chief Executive Officer and Chief Financial Officer, do not expect that our disclosure controls and procedures or internal control over financial reporting will prevent all errors and all fraud. Controls, no matter how well conceived and operated, can provide only reasonable, not absolute, assurance that the objectives of the controls are met. Further, we believe that the design of prudent controls must reflect appropriate resource constraints, such that the benefits of controls must be considered relative to their costs. Because of the inherent limitations in all controls, there can be no absolute assurance that all control issues and instances of fraud, if any, applicable to us have been or will be detected. These inherent limitations include the realities that judgments in decision-making can be faulty, and that breakdowns can occur because of simple errors or mistakes. Additionally, controls can be circumvented by the individual acts of some individuals, by collusion of more than one person, or by management override of the control. The design of any system of controls also is based in part upon certain assumptions about the likelihood of future events, and there can be no assurance that any design will succeed in achieving its stated goals under all potential future conditions; over time, controls may become inadequate because of changes in conditions, or the degree of compliance with the policies or procedures may deteriorate. Because of the inherent limitations in a cost-effective control system, misstatements due to error or fraud may occur and not be detected.
Evaluation: An evaluation was performed under the supervision and with the participation of the Companys management, including our Chief Executive Officer and Chief Financial Officer, of the effectiveness of the design and operation of the Companys disclosure controls and procedures as required by Rules 13a-15(b) and 15d-15(b) of the Exchange Act. Based upon that evaluation, the Companys management, including our Chief Executive Officer and Chief Financial Officer, concluded that, at December 31, 2008, the Companys disclosure controls and procedures were effective at the reasonable assurance level in ensuring that information required to be disclosed in Company reports filed under the Exchange Act is (i) recorded, processed, summarized and reported within the time periods specified in the SEC rules and forms and (ii) accumulated and communicated to management, including the Companys Chief Executive Officer and Chief Financial Officer, as appropriate to allow timely decisions regarding required disclosure. There has been no change in the Companys internal control over financial reporting during the quarter ended December 31, 2008 that has materially affected, or is reasonably likely to materially affect, the Companys internal control over financial reporting.
None.
132
Table of Contents
ITEM 10. DIRECTORS, EXECUTIVE OFFICERS AND CORPORATE GOVERNANCE
This item is omitted because a definitive proxy statement that involves the election of directors will be filed with the Securities and Exchange Commission not later than 120 days after the close of the fiscal year pursuant to Regulation 14A, which proxy statement is incorporated by reference.
RenaissanceRe has adopted a Code of Ethics that applies to its directors and executive officers. The Code of Ethics is available free of charge on our website http://www.renre.com. We intend to disclose any amendments to our Code of Ethics by posting such information on our website, as well as disclosing any waivers of our code applicable to our principal executive officer, principal financial officer, principal accounting officer or controller and other executive officers who perform similar functions through such means or by filing a Form 8-K.
ITEM 11. EXECUTIVE COMPENSATION
This item is omitted because a definitive proxy statement that involves the election of directors will be filed with the Securities and Exchange Commission not later than 120 days after the close of the fiscal year pursuant to Regulation 14A, which proxy statement is incorporated by reference.
ITEM 12. SECURITY OWNERSHIP OF CERTAIN BENEFICIAL OWNERS AND MANAGEMENT AND RELATED SHAREHOLDER MATTERS
This item is omitted because a definitive proxy statement that involves the election of directors will be filed with the Securities and Exchange Commission not later than 120 days after the close of the fiscal year pursuant to Regulation 14A, which proxy statement is incorporated by reference.
ITEM 13. CERTAIN RELATIONSHIPS AND RELATED TRANSACTIONS, AND DIRECTOR INDEPENDENCE
This item is omitted because a definitive proxy statement that involves the election of directors will be filed with the Securities and Exchange Commission not later than 120 days after the close of the fiscal year pursuant to Regulation 14A, which proxy statement is incorporated by reference.
ITEM 14. PRINCIPAL ACCOUNTANT FEES AND SERVICES
This item is omitted because a definitive proxy statement that involves the election of directors will be filed with the Securities and Exchange Commission not later than 120 days after the close of the fiscal year pursuant to Regulation 14A, which proxy statement is incorporated by reference.
133
Table of Contents
ITEM 15. EXHIBITS AND FINANCIAL STATEMENT SCHEDULES
| (a) | Financial Statements, Financial Statement Schedules and Exhibits. | |
| 1. | Financial Statements | |
| The Consolidated Financial Statements of RenaissanceRe Holdings Ltd. and related Notes thereto are listed in the accompanying Index to Consolidated Financial Statements and are filed as part of this Form 10-K. | ||
| 2. | Financial Statement Schedules | |
|
The Schedules to the Consolidated Financial Statements of RenaissanceRe Holdings Ltd. are listed in the accompanying Index to Schedules to Consolidated Financial Statements and are filed as a
part of this Form 10-K.
|
||
| 3. | Exhibits | |
| 3.1 | Memorandum of Association. (1) | |
| 3.2 | Amended and Restated Bye-Laws. (2) | |
| 3.3 | Memorandum of Increase in Share Capital of RenaissanceRe Holdings Ltd. (3) | |
| 3.4 | Specimen Common Share certificate. (1) | |
| 10.1 | Form of Director Retention Agreement, dated as of November 8, 2002, entered into by each of the non-employee directors of RenaissanceRe Holdings Ltd. (4) | |
| 10.2 | Amended and Restated Employment Agreement, dated as of February 22, 2006, between RenaissanceRe Holdings Ltd. and Neill A. Currie. (5) | |
| 10.3 | Amendment No. 1, dated as of March 1, 2007, to the Employment Agreement, dated as of February 22, 2006 by and between RenaissanceRe Holdings Ltd. and Neill A. Currie. (6) | |
| 10.4 | Amendment No. 2, dated as of November 19, 2008, between RenaissanceRe Holdings Ltd. and Neill A. Currie. (7) | |
| 10.5 | Employment Agreement, dated as of July 19, 2006, between RenaissanceRe Holdings Ltd. and Fred R. Donner. (8) | |
| 10.6 | Amended and Restated Employment Agreement, dated as of July 19, 2006, between RenaissanceRe Holdings Ltd. and William I. Riker. (8) | |
| 10.7 | Transition Services Agreement dated as of July 18, 2007 between RenaissanceRe Holdings Ltd. and William I. Riker. (9) | |
| 10.8 | Amended and Restated Employment Agreement, dated as of July 19, 2006, between RenaissanceRe Holdings Ltd. and John D. Nichols, Jr. (8) | |
| 10.9 | Sublease Agreement, dated as of July 19, 2006, between Renaissance Reinsurance Ltd. and John D. Nichols, Jr. (8) | |
| 10.10 | Form of Employment Agreement for Executive Officers. (8) | |
| 10.11 | Form of Amendment to Employment Agreement for Executive Officers. (10) | |
| 10.12 | Form of Amendment to Employment Agreement for Executive Officers. (7) | |
| 10.13 | Sixth Amended and Restated Employment Agreement, dated as of May 19, 2004, between RenaissanceRe Holdings Ltd. and James N. Stanard. (11) | |
| 10.14 | Second Amended and Restated Credit Agreement, dated as of August 6, 2004, among RenaissanceRe Holdings Ltd., the Lenders named therein, Deutsche Bank AG New York Branch, as LC Issuer and Co-Documentation Agent, HSBC Bank U.S., National Association, as Co-Documentation Agent, Citibank, N.A. and Wachovia Bank, National Association, as Co-Syndication Agents, Bank of America, N.A., as Administrative Agent and Bank of America Securities LLC, as Sole Lead Arranger and Sole Book Manager. (12) | |
134
Table of Contents
| 10.15 | First Amendment Agreement, dated as of August 11, 2005, among RenaissanceRe Holdings Ltd., the Lenders named therein, Deutsche Bank AG New York Branch, as LC Issuer and Bank of America, National Association, as Administrative Agent for the Lenders. (13) | |
| 10.16 | Second Amendment Agreement to Second Amended and Restated Credit Agreement, dated as of May 19, 2006, among RenaissanceRe Holdings Ltd., the lenders named therein, Deutsche Bank AG New York Branch, as LC Issuer and Bank of America, National Association, as Administrative Agent for the Lenders. (14) | |
| 10.17 | Third Amendment, dated as of June 18, 2007, to Second Amended and Restated Credit Agreement, dated as of August 6, 2004, among RenaissanceRe Holdings Ltd., the lenders named therein, Deutsche Bank AG New York Branch, as LC Issuer and Bank of America, National Association as Administrative Agent for the Lenders. (15) | |
| 10.18 | Fourth Amendment, dated as of September 6, 2007, to Second Amended and Restated Credit Agreement, dated as of August 6, 2004, among RenaissanceRe Holdings Ltd., the lenders named therein, Deutsche Bank AG New York Branch, as LC Issuer and Bank of America, National Association as Administrative Agent for the Lenders. (16) | |
| 10.19 | Third Amended and Restated Credit Agreement, dated as of April 5, 2006, by and among DaVinciRe Holdings Ltd., the banks, financial institutions and other institutional lenders listed thereto (the Lenders), Citigroup Global Markets Inc., as sole lead arranger, book manager and syndication agent, and Citibank, N.A. as administrative agent for the Lenders. (17) | |
| 10.20 | RenaissanceRe Holdings Ltd. Second Amended and Restated 1993 Stock Incentive Plan. (18) | |
| 10.21 | RenaissanceRe Holdings Ltd. 2001 Stock Incentive Plan. (19) | |
| 10.22 | Amendment No. 1 to the RenaissanceRe Holdings Ltd. 2001 Stock Incentive Plan. (20) | |
| 10.23 | Amendment No. 2 to the RenaissanceRe Holdings Ltd. 2001 Stock Incentive Plan. (20) | |
| 10.24 | Form of Option Grant Notice and Agreement pursuant to which option grants are made under the RenaissanceRe Holdings Ltd. 2001 Stock Incentive Plan. (12) | |
| 10.25 | Form of Restricted Stock Grant Notice and Agreement pursuant to which Restricted Stock grants are made under the RenaissanceRe Holdings Ltd. 2001 Stock Incentive Plan. (12) | |
| 10.26 | RenaissanceRe Holdings Ltd. 2004 Stock Option Incentive Plan. (21) | |
| 10.27 | Amendment No. 1 to the RenaissanceRe Holdings Ltd. 2004 Stock Option Incentive Plan. (22) | |
| 10.28 | Form of Option Agreement pursuant to which option grants are made under the RenaissanceRe Holdings 2004 Stock Option Incentive Plan to executive officers. (21) | |
| 10.29 | Amended and Restated RenaissanceRe Holdings Ltd. Non-Employee Director Stock Plan. (23) | |
| 10.30 | Amendment No. 1 to the RenaissanceRe Holdings Ltd. Non-Employee Director Stock Plan. (24) | |
| 10.31 | Amendment No. 2 to the RenaissanceRe Holdings Ltd. Non-Employee Director Stock Plan. (25) | |
| 10.32 | Amendment No. 3 to the RenaissanceRe Holdings Ltd. Non-Employee Director Stock Plan. | |
| 10.33 | Form of Restricted Stock Grant Agreement for Directors. (5) | |
| 10.34 | Form of Option Grant Agreement for Directors. (5) | |
| 10.35 | Master Standby Letter of Credit Reimbursement Agreement, dated as of November 2, 2001, between Renaissance Reinsurance Ltd. and Fleet National Bank. Glencoe Insurance Ltd. and Timicuan Reinsurance Ltd. have each become a party to this agreement pursuant to an accession agreement, and DaVinci Reinsurance Ltd. has entered in a substantially similar agreement with Fleet National Bank. (26) | |
| 10.36 | Certificate of Designation, Preferences and Rights of 7.30% Series B Preference Shares. (27) | |
135
Table of Contents
| 10.37 | Certificate of Designation, Preferences and Rights of 6.08% Series C Preference Shares. (28) | |
| 10.38 | Certificate of Designation, Preferences and Rights of 6.60% Series D Preference Shares. (29) | |
| 10.39 | Senior Indenture, dated as of July 1, 2001, between RenaissanceRe Holdings Ltd., as Issuer, and Bankers Trust Company, as Trustee. (30) | |
| 10.40 | Second Supplemental Indenture, by and between RenaissanceRe Holdings Ltd. and Deutsche Bank Trust Company Americas (f/k/a Bankers Trust Company), dated as of January 31, 2003. (31) | |
| 10.41 | Second Amended and Restated Reimbursement Agreement, dated as of April 27, 2007, by and among Renaissance Reinsurance Ltd., Renaissance Reinsurance of Europe, Glencoe Insurance Ltd., DaVinci Reinsurance Ltd., RenaissanceRe Holdings Ltd., Wachovia Bank, National Association, as Issuing Bank, Administrative Agent, and Collateral Agent for the Lenders, certain Co-Syndication Agents, ING Bank N.V., as Documentation Agent, and certain Lenders party thereto. (32) | |
| 21.1 | List of Subsidiaries of the Registrant. | |
| 23.1 | Consent of Ernst & Young Ltd. | |
| 31.1 | Certification of Neill A. Currie, Chief Executive Officer of RenaissanceRe Holdings Ltd., pursuant to Rule 13a-14(a) or Rule 15d-14(a) of the Securities Exchange Act of 1934, as amended. | |
| 31.2 | Certification of Fred R. Donner, Chief Financial Officer of RenaissanceRe Holdings Ltd., pursuant to Rule 13a-14(a) or Rule 15d-14(a) of the Securities Exchange Act of 1934, as amended. | |
| 32.1 | Certification of Neill A. Currie, Chief Executive Officer of RenaissanceRe Holdings Ltd., pursuant to 18 U.S.C. Section 1350, as adopted pursuant to Section 906 of the Sarbanes-Oxley Act of 2002. | |
| 32.2 | Certification of Fred R. Donner, Chief Financial Officer of RenaissanceRe Holdings Ltd., pursuant to 18 U.S.C. Section 1350, as adopted pursuant to Section 906 of the Sarbanes-Oxley Act of 2002. | |
| (1) | Incorporated by reference to the Registration Statement on Form S-1 of RenaissanceRe Holdings Ltd. (Registration No. 33-70008) which was declared effective by the SEC on July 26, 1995. |
| (2) | Incorporated by reference to RenaissanceRe Holdings Ltd.s Quarterly Report on Form 10-Q for the period ended June 30, 2002, filed with the SEC on August 14, 2002. |
| (3) | Incorporated by reference to RenaissanceRe Holdings Ltd.s Quarterly Report on Form 10-Q for the period ended March 31, 1998, filed with the SEC on May 14, 1998 (SEC File Number 000-26512) |
| (4) | Incorporated by reference to RenaissanceRe Holdings Ltd.s Annual Report on Form 10-K for the year ended December 31, 2002, filed with the SEC on March 31, 2003 (SEC File Number 001-14428) |
| (5) | Incorporated by reference to RenaissanceRe Holdings Ltd.s Current Report on Form 8-K, filed with the SEC on February 27, 2006 |
| (6) | Incorporated by reference to RenaissanceRe Holdings Ltd.s Quarterly Report on Form 10-Q for the period ended March 31, 2007, filed with the SEC on May 2, 2007. |
| (7) | Incorporated by reference to RenaissanceRe Holdings Ltd.s Current Report on Form 8-K, filed with the SEC on November 25, 2008. |
| (8) | Incorporated by reference to RenaissanceRe Holdings Ltd.s Current Report on Form 8-K, filed with the SEC on July 21, 2006, relating to certain events which occurred on July 19, 2006. Other than with respect to the Percent and Lump Sum Percent (as defined and disclosed in the Form 8-K) and matters such as names and titles, the employment agreements for Messrs. ODonnell and Ashley are identical to the form filed as Exhibit 10.9. |
| (9) | Incorporated by reference to RenaissanceRe Holdings Ltd.s Current Report on Form 8-K, filed with the SEC on July 20, 2007. |
136
Table of Contents
| (10) | Incorporated by reference to RenaissanceRe Holdings Ltd.s Quarterly Report on Form 10-Q for the period ended March 31, 2008, filed with the SEC on May 2, 2008. |
| (11) | Incorporated by reference to RenaissanceRe Holdings Ltd.s Quarterly Report on Form 10-Q for the period ended June 30, 2004, filed with the SEC on August 9, 2004 |
| (12) | Incorporated by reference to RenaissanceRe Holdings Ltd.s Quarterly Report on Form 10-Q for the period ended September 30, 2004, filed with the SEC on November 9, 2004. |
| (13) | Incorporated by reference to RenaissanceRe Holdings Ltd.s Annual Report on Form 10-K for the year ended December 31, 2005, filed with the SEC on March 3, 2006 (SEC File Number 001-14428). |
| (14) | Incorporated by reference to RenaissanceRe Holdings Ltd.s Quarterly Report on Form 10-Q for the period ended June 30, 2006, filed with the SEC on August 2, 2006 (SEC File Number 001-14428). |
| (15) | Incorporated by reference to RenaissanceRe Holdings Ltd.s Current Report on Form 8-K, filed with the SEC on June 29, 2007. |
| (16) | Incorporated by reference to RenaissanceRe Holdings Ltd.s Quarterly Report on Form 10-Q for the period ended September 30, 2007, filed with the SEC on October 31, 2007 (SEC File Number 001-14428). |
| (17) | Incorporated by reference to RenaissanceRe Holdings Ltd.s Current Report on Form 8-K, filed with the SEC on April 11, 2006, relating to certain events which occurred on April 5, 2006. |
| (18) | Incorporated by reference to Exhibit 99.3 to the Registration Statement on Form S-8 (Registration No. 333-90758) dated June 19, 2002. |
| (19) | Incorporated by reference to Exhibit 99.2 to the Registration Statement on Form S-8 (Registration No. 333-90758) dated June 19, 2002. |
| (20) | Incorporated by reference to RenaissanceRe Holdings Ltd.s Quarterly Report on Form 10-Q for the period ended March 31, 2007, filed with the SEC on May 2, 2007. |
| (21) | Incorporated by reference to RenaissanceRe Holdings Ltd.s Current Report on Form 8-K, filed with the SEC on September 2, 2004. |
| (22) | Incorporated by reference to RenaissanceRe Holdings Ltd.s Annual Report on Form 10-K for the year ended December 31, 2004, filed with the SEC on March 31, 2005 (SEC File Number 001-14428). |
| (23) | Incorporated by reference to Exhibit 99.1 to the Registration Statement on Form S-8 (Registration No. 333-90758) dated June 19, 2002. |
| (24) | Incorporated by reference to RenaissanceRe Holdings Ltd.s Quarterly Report on Form 10-Q for the period ended March 31, 2007, filed with the SEC on May 2, 2007. |
| (25) | Incorporated by reference to RenaissanceRe Holdings Ltd.s Quarterly Report on Form 10-Q for the period ended September 30, 2008, filed with the SEC on October 30, 2008. |
| (26) | Incorporated by reference to RenaissanceRe Holdings Ltd.s Annual Report on Form 10-K for the year ended December 31, 2001 filed with the SEC on April 1, 2002. |
| (27) | Incorporated by reference to RenaissanceRe Holdings Ltd.s Current Report on Form 8-K, filed with the SEC on February 4, 2003, relating to certain events which occurred on January 30, 2003. |
| (28) | Incorporated by reference to RenaissanceRe Holdings Ltd.s Current Report on Form 8-K, filed with the SEC on March 18, 2004. |
| (29) | Incorporated by reference to RenaissanceRe Holdings Ltd.s Form 8-A, filed with the SEC on December 14, 2006. |
| (30) | Incorporated by reference to RenaissanceRe Holdings Ltd.s Current Report on Form 8-K, filed with the SEC on July 17, 2001, relating to certain events which occurred on July 12, 2001. |
| (31) | Incorporated by reference to RenaissanceRe Holdings Ltd.s Current Report on Form 8-K, filed with the SEC on January 31, 2003, relating to certain events which occurred on January 28, 2003. |
| (32) | Incorporated by reference to RenaissanceRe Holdings Ltd.s Current Report on Form 8-K, filed with the SEC on May 3, 2007. |
137
Table of Contents
Pursuant to the requirements of Section 13 or 15(d) of the Securities Exchange Act of 1934, the Registrant has duly caused this report to be signed on its behalf by the undersigned, thereunto duly authorized, in Hamilton, Bermuda on February 19, 2009.
RENAISSANCERE HOLDINGS LTD.
| /s/ Neill A. Currie |
| Neill A. Currie |
| President, Chief Executive Officer, |
| Director |
| Signature |
Title |
Date |
||
| /s/ Neill A. Currie Neill A. Currie |
President, Chief Executive Officer, Director | February 19, 2009 | ||
| /s/ Fred R. Donner Fred R. Donner |
Executive Vice President, Chief Financial Officer | February 19, 2009 | ||
| /s/ Mark A. Wilcox Mark A. Wilcox |
Senior Vice President, Corporate Controller and Chief Accounting Officer | February 19, 2009 | ||
| /s/ W. James MacGinnitie W. James MacGinnitie |
Chairman of the Board of Directors | February 19, 2009 | ||
| /s/ Thomas A. Cooper Thomas A. Cooper |
Director | February 19, 2009 | ||
| /s/ David C. Bushnell David C. Bushnell |
Director | February 19, 2009 | ||
| /s/ James L. Gibbons James L. Gibbons |
Director | February 19, 2009 | ||
| /s/ Jean D. Hamilton Jean D. Hamilton |
Director | February 19, 2009 | ||
| /s/ William F. Hecht William F. Hecht |
Director | February 19, 2009 | ||
| /s/ Henry Klehm, III Henry Klehm, III |
Director | February 19, 2009 | ||
| /s/ Ralph B. Levy Ralph B. Levy |
Director | February 19, 2009 | ||
| /s/ Anthony M. Santomero Anthony M. Santomero |
Director | February 19, 2009 | ||
| /s/ Nicholas L. Trivisonno Nicholas L. Trivisonno |
Director | February 19, 2009 | ||
138
Table of Contents
INDEX TO CONSOLIDATED FINANCIAL STATEMENTS
F-1
Table of Contents
MANAGEMENTS REPORT ON INTERNAL CONTROL OVER FINANCIAL REPORTING
Management at RenaissanceRe Holdings Ltd. (the Company) is responsible for establishing and maintaining effective internal control over financial reporting as defined in Rules 13a-15(f) and 15d-15(f) under the Securities Exchange Act of 1934, as amended. The Companys internal control over financial reporting was designed to provide reasonable assurance regarding the reliability of financial reporting and the preparation of financial statements for external purposes in accordance with U.S. generally accepted accounting principles and to reflect managements judgments and estimates concerning effects of events and transactions that are accounted for or disclosed. There are inherent limitations to the effectiveness of any controls. Controls, no matter how well conceived and operated, can provide only reasonable assurance that its objectives are met. No evaluation of controls can provide absolute assurance that all control issues and instances of fraud, if any, within the Company have been detected.
Management, with the participation of the Chief Executive Officer and Chief Financial Officer, assessed its internal control over financial reporting as of December 31, 2008. In making this assessment, management used the criteria set forth by the Committee of Sponsoring Organizations of the Treadway Commission (COSO) in Internal Control-Integrated Framework. Based on this assessment, management believes that the Company maintained effective internal control over financial reporting as of December 31, 2008.
The Companys effectiveness of internal control over financial reporting as of December 31, 2008, has been audited by Ernst & Young Ltd., the Independent Registered Public Accountants who also audited the Companys consolidated financial statements. Ernst & Young Ltd.s attestation report on the effectiveness of the Companys internal control over financial reporting appears on page F-4.
F-2
Table of Contents
REPORT OF INDEPENDENT REGISTERED PUBLIC ACCOUNTING FIRM
TO THE BOARD OF DIRECTORS AND SHAREHOLDERS OF RENAISSANCERE HOLDINGS LTD.
We have audited the accompanying consolidated balance sheets of RenaissanceRe Holdings Ltd. and Subsidiaries as of December 31, 2008 and 2007, and the related consolidated statements of operations, changes in shareholders equity, and cash flows for each of the three years in the period ended December 31, 2008. These financial statements are the responsibility of the Companys management. Our responsibility is to express an opinion on these financial statements based on our audits.
We conducted our audits in accordance with the standards of the Public Company Accounting Oversight Board (United States). Those standards require that we plan and perform the audit to obtain reasonable assurance about whether the financial statements are free of material misstatement. An audit includes examining, on a test basis, evidence supporting the amounts and disclosures in the financial statements. An audit also includes assessing the accounting principles used and significant estimates made by management, as well as evaluating the overall financial statement presentation. We believe that our audits provide a reasonable basis for our opinion.
In our opinion, the financial statements referred to above present fairly, in all material respects, the consolidated financial position of RenaissanceRe Holdings Ltd. and Subsidiaries at December 31, 2008 and 2007, and the consolidated results of their operations and their cash flows for each of the three years in the period ended December 31, 2008, in conformity with U.S. generally accepted accounting principles.
We also have audited, in accordance with the standards of the Public Company Accounting Oversight Board (United States), RenaissanceRe Holdings Ltd.s internal control over financial reporting as of December 31, 2008, based on criteria established in Internal Control-Integrated Framework issued by the Committee of Sponsoring Organizations of the Treadway Commission and our report dated February 19, 2009 expressed an unqualified opinion thereon.
/s/ Ernst & Young Ltd.
Hamilton, Bermuda
February 19, 2009
F-3
Table of Contents
REPORT OF INDEPENDENT REGISTERED PUBLIC ACCOUNTING FIRM
TO THE BOARD OF DIRECTORS AND SHAREHOLDERS OF RENAISSANCERE HOLDINGS LTD.
We have audited RenaissanceRe Holdings Ltd.s internal control over financial reporting as of December 31, 2008, based on criteria established in Internal Control Integrated Framework issued by the Committee of Sponsoring Organizations of the Treadway Commission (the COSO criteria). RenaissanceRe Holdings Ltd.s management is responsible for maintaining effective internal control over financial reporting, and for its assessment of the effectiveness of internal control over financial reporting included in the accompanying Managements Report on Internal Control over Financial Reporting. Our responsibility is to express an opinion on the Companys internal control over financial reporting based on our audit.
We conducted our audit in accordance with the standards of the Public Company Accounting Oversight Board (United States). Those standards require that we plan and perform the audit to obtain reasonable assurance about whether effective internal control over financial reporting was maintained in all material respects. Our audit included obtaining an understanding of internal control over financial reporting, assessing the risk that a material weakness exists, testing and evaluating the design and operating effectiveness of internal control based on the assessed risk, and performing such other procedures as we considered necessary in the circumstances. We believe that our audit provides a reasonable basis for our opinion.
A companys internal control over financial reporting is a process designed to provide reasonable assurance regarding the reliability of financial reporting and the preparation of financial statements for external purposes in accordance with generally accepted accounting principles. A companys internal control over financial reporting includes those policies and procedures that (1) pertain to the maintenance of records that, in reasonable detail, accurately and fairly reflect the transactions and dispositions of the assets of the company; (2) provide reasonable assurance that transactions are recorded as necessary to permit preparation of financial statements in accordance with generally accepted accounting principles, and that receipts and expenditures of the company are being made only in accordance with authorizations of management and directors of the company; and (3) provide reasonable assurance regarding prevention or timely detection of unauthorized acquisition, use, or disposition of the companys assets that could have a material effect on the financial statements.
Because of its inherent limitations, internal control over financial reporting may not prevent or detect misstatements. Also, projections of any evaluation of effectiveness to future periods are subject to the risk that controls may become inadequate because of changes in conditions, or that the degree of compliance with the policies or procedures may deteriorate.
In our opinion, RenaissanceRe Holdings Ltd. maintained, in all material respects, effective internal control over financial reporting as of December 31, 2008, based on the COSO criteria.
We also have audited, in accordance with the standards of the Public Company Accounting Oversight Board (United States), the consolidated balance sheets of RenaissanceRe Holdings Ltd. as of December 31, 2008 and 2007, and the related consolidated statements of operations, changes in shareholders equity, and cash flows for each of the three years in the period ended December 31, 2008 and our report dated February 19, 2009 expressed an unqualified opinion thereon.
/s/ Ernst & Young Ltd.
Hamilton, Bermuda
February 19, 2009
F-4
Table of Contents
RenaissanceRe Holdings Ltd. and Subsidiaries
Consolidated Balance Sheets
At December 31, 2008 and 2007
(in thousands of United States Dollars, except per share amounts)
| December 31, 2008 | December 31, 2007 | |||||
| Assets |
||||||
| Fixed maturity investments available for sale, at fair value |
$2,996,885 | $3,914,363 | ||||
| (Amortized cost $2,916,991 and $3,863,902 at December 31, 2008 and 2007, respectively) (Note 5) |
||||||
| Short term investments, at fair value (Note 5) |
2,172,343 | 1,821,549 | ||||
| Other investments, at fair value (Note 5) |
773,475 | 807,864 | ||||
| Investments in other ventures, under equity method (Note 5) |
99,879 | 90,572 | ||||
| Total investments |
6,042,582 | 6,634,348 | ||||
| Cash and cash equivalents |
274,692 | 330,226 | ||||
| Premiums receivable |
565,630 | 475,075 | ||||
| Ceded reinsurance balances (Note 7) |
88,019 | 107,916 | ||||
| Losses recoverable (Note 7) |
299,534 | 183,275 | ||||
| Accrued investment income |
26,614 | 39,084 | ||||
| Deferred acquisition costs |
81,904 | 104,212 | ||||
| Receivable for investments sold |
236,485 | 144,037 | ||||
| Other secured assets (Note 8) |
76,424 | 90,488 | ||||
| Other assets |
217,986 | 171,457 | ||||
| Goodwill and other intangibles (Note 4) |
74,181 | 6,237 | ||||
| Total assets |
$ 7,984,051 | $ 8,286,355 | ||||
| Liabilities, Minority Interest and Shareholders Equity |
||||||
| Liabilities |
||||||
| Reserve for claims and claim expenses (Note 9) |
$2,160,612 | $2,028,496 | ||||
| Reserve for unearned premiums |
510,235 | 563,336 | ||||
| Debt (Note 10) |
450,000 | 451,951 | ||||
| Reinsurance balances payable |
315,401 | 275,430 | ||||
| Payable for investments purchased |
378,111 | 422,974 | ||||
| Other secured liabilities (Note 8) |
77,420 | 88,920 | ||||
| Other liabilities |
290,998 | 162,294 | ||||
| Total liabilities |
4,182,777 | 3,993,401 | ||||
| Commitments and Contingencies |
||||||
| Minority Interest DaVinciRe (Note 12) |
768,531 | 815,451 | ||||
| Shareholders Equity (Note 13) |
||||||
| Preference Shares: $1.00 par value 26,000,000 shares issued and outstanding at December 31, 2008 (2007 26,000,000 shares) |
650,000 | 650,000 | ||||
| Common shares: $1.00 par value 61,503,333 shares issued and outstanding at December 31, 2008 (2007 68,920,319 shares) |
61,503 | 68,920 | ||||
| Additional paid-in capital |
| 107,867 | ||||
| Accumulated other comprehensive income |
75,387 | 44,719 | ||||
| Retained earnings |
2,245,853 | 2,605,997 | ||||
| Total shareholders equity |
3,032,743 | 3,477,503 | ||||
| Total liabilities, minority interest and shareholders equity |
$7,984,051 | $8,286,355 | ||||
See accompanying notes to the consolidated financial statements
F-5
Table of Contents
RenaissanceRe Holdings Ltd. and Subsidiaries
Consolidated Statements of Operations
For the years ended December 31, 2008, 2007 and 2006
(in thousands of United States Dollars, except per share amounts)
| 2008 | 2007 | 2006 | ||||||||||
| Revenues |
||||||||||||
| Gross premiums written |
$ | 1,736,028 | $ | 1,809,637 | $ | 1,943,647 | ||||||
| Net premiums written (Note 7) |
$ | 1,353,620 | $ | 1,435,335 | $ | 1,529,620 | ||||||
| Decrease (increase) in unearned premiums |
33,204 | (10,966 | ) | 157 | ||||||||
| Net premiums earned (Note 7) |
1,386,824 | 1,424,369 | 1,529,777 | |||||||||
| Net investment income (Note 5) |
24,231 | 402,463 | 318,106 | |||||||||
| Net foreign exchange gains (losses) |
2,600 | 3,968 | (3,293 | ) | ||||||||
| Equity in earnings (losses) of other ventures (Note 5) |
13,603 | (128,609 | ) | 34,528 | ||||||||
| Other income (loss) |
10,252 | (37,930 | ) | (3,917 | ) | |||||||
| Net realized (losses) gains on investments (Note 5) |
(206,314 | ) | 1,293 | (34,464 | ) | |||||||
| Total revenues |
1,231,196 | 1,665,554 | 1,840,737 | |||||||||
| Expenses |
||||||||||||
| Net claims and claim expenses incurred (Note 9) |
760,489 | 479,274 | 446,230 | |||||||||
| Acquisition expenses |
213,553 | 254,930 | 280,697 | |||||||||
| Operational expenses |
122,165 | 110,464 | 109,586 | |||||||||
| Corporate expenses |
25,635 | 28,860 | 24,418 | |||||||||
| Interest expense (Note 10) |
24,633 | 33,626 | 37,602 | |||||||||
| Total expenses |
1,146,475 | 907,154 | 898,533 | |||||||||
| Income before minority interests and taxes |
84,721 | 758,400 | 942,204 | |||||||||
| Minority interest DaVinciRe (Note 12) |
(55,133 | ) | (164,396 | ) | (144,159 | ) | ||||||
| Income before taxes |
29,588 | 594,004 | 798,045 | |||||||||
| Income tax (expense) benefit (Note 17) |
(568 | ) | 18,432 | (935 | ) | |||||||
| Net income |
29,020 | 612,436 | 797,110 | |||||||||
| Dividends on preference shares (Note 13) |
(42,300 | ) | (42,861 | ) | (35,475 | ) | ||||||
| Net (loss) income (attributable) available to common shareholders |
$ | (13,280 | ) | $ | 569,575 | $ | 761,635 | |||||
| Net (loss) income (attributable) available to common shareholders per common share basic (Note 14) |
$ | (0.21 | ) | $ | 8.08 | $ | 10.72 | |||||
| Net (loss) income (attributable) available to common shareholders per common share diluted (Note 14) (1) |
$ | (0.21 | ) | $ | 7.93 | $ | 10.57 | |||||
| Dividends per common share (Note 16) |
$ | 0.92 | $ | 0.88 | $ | 0.84 | ||||||
| (1) | In accordance with FAS 128, earnings per share calculations use average common shares outstanding basic, when in a net loss position. |
See accompanying notes to the consolidated financial statements
F-6
Table of Contents
RenaissanceRe Holdings Ltd. and Subsidiaries
Consolidated Statements of Changes in Shareholders Equity
For the years ended December 31, 2008, 2007 and 2006
(in thousands of United States Dollars)
| 2008 | 2007 | 2006 | ||||||||||
| Preference shares |
||||||||||||
| Balance January 1 |
$ | 650,000 | $ | 800,000 | $ | 500,000 | ||||||
| Repurchase of shares |
| (150,000 | ) | | ||||||||
| Issuance of shares |
| | 300,000 | |||||||||
| Balance December 31 |
650,000 | 650,000 | 800,000 | |||||||||
| Common shares |
||||||||||||
| Balance January 1 |
68,920 | 72,140 | 71,523 | |||||||||
| Repurchase of shares |
(8,064 | ) | (3,588 | ) | | |||||||
| Exercise of options and issuance of restricted stock awards (Note 20) |
647 | 368 | 617 | |||||||||
| Balance December 31 |
61,503 | 68,920 | 72,140 | |||||||||
| Additional paid-in capital |
||||||||||||
| Balance January 1 |
107,867 | 284,123 | 279,762 | |||||||||
| Repurchase of shares |
(131,328 | ) | (196,583 | ) | | |||||||
| Exercise of options and issuance of restricted stock awards (Note 20) |
23,461 | 20,327 | 13,811 | |||||||||
| Offering expenses |
| | (9,450 | ) | ||||||||
| Balance December 31 |
| 107,867 | 284,123 | |||||||||
| Accumulated other comprehensive income |
||||||||||||
| Balance January 1 |
44,719 | 25,217 | 4,760 | |||||||||
| Net unrealized gains on securities, net of adjustment (see disclosure below) |
30,668 | 19,502 | 20,457 | |||||||||
| Balance December 31 |
75,387 | 44,719 | 25,217 | |||||||||
| Retained earnings |
||||||||||||
| Balance January 1 |
2,605,997 | 2,099,017 | 1,397,795 | |||||||||
| Net income |
29,020 | 612,436 | 797,110 | |||||||||
| Repurchase of shares |
(289,014 | ) | | | ||||||||
| Dividends on common shares |
(57,850 | ) | (62,595 | ) | (60,413 | ) | ||||||
| Dividends on preference shares |
(42,300 | ) | (42,861 | ) | (35,475 | ) | ||||||
| Balance December 31 |
2,245,853 | 2,605,997 | 2,099,017 | |||||||||
| Total Shareholders Equity |
$ | 3,032,743 | $ | 3,477,503 | $ | 3,280,497 | ||||||
| Comprehensive income |
||||||||||||
| Net income |
$ | 29,020 | $ | 612,436 | $ | 797,110 | ||||||
| Other comprehensive income |
30,668 | 19,502 | 20,457 | |||||||||
| Comprehensive income |
$ | 59,688 | $ | 631,938 | $ | 817,567 | ||||||
| Disclosure regarding net unrealized gains |
||||||||||||
| Net unrealized holding (losses) gains arising during the year |
$ | (175,646 | ) | $ | 20,795 | $ | (14,007 | ) | ||||
| Net realized losses (gains) included in net income |
206,314 | (1,293 | ) | 34,464 | ||||||||
| Net unrealized gains on securities |
$ | 30,668 | $ | 19,502 | $ | 20,457 | ||||||
See accompanying notes to the consolidated financial statements
F-7
Table of Contents
RenaissanceRe Holdings Ltd. and Subsidiaries
Consolidated Statements of Cash Flows
For the years ended December 31, 2008, 2007 and 2006
(in thousands of United States Dollars)
| 2008 | 2007 | 2006 | ||||||||||
| Cash flows provided by operating activities |
||||||||||||
| Net income |
$ | 29,020 | $ | 612,436 | $ | 797,110 | ||||||
| Adjustments to reconcile net income to net cash provided by operating activities |
||||||||||||
| Amortization and depreciation |
(8,871 | ) | (19,774 | ) | (12,279 | ) | ||||||
| Equity in undistributed losses (earnings) of other ventures |
2,638 | 142,120 | (22,061 | ) | ||||||||
| Net unrealized losses (gains) included in net investment income |
259,398 | (47,310 | ) | (32,900 | ) | |||||||
| Net unrealized (gains) losses included in other income |
(4,537 | ) | (7,315 | ) | 986 | |||||||
| Net realized investment losses (gains) |
206,314 | (1,293 | ) | 34,464 | ||||||||
| Minority interest in undistributed net income of Da VinciRe |
55,133 | 164,396 | 144,159 | |||||||||
| Change in: |
||||||||||||
| Premiums receivable |
(90,555 | ) | (55,925 | ) | (56,045 | ) | ||||||
| Ceded reinsurance balances |
19,897 | 26,055 | (76,837 | ) | ||||||||
| Deferred acquisition costs |
22,308 | 2,706 | 1,033 | |||||||||
| Reserve for claims and claim expenses, net |
15,857 | 48,920 | (145,060 | ) | ||||||||
| Reserve for unearned premiums |
(53,101 | ) | (15,088 | ) | 76,680 | |||||||
| Reinsurance balances payable |
39,971 | (119,653 | ) | 102,776 | ||||||||
| Other |
50,566 | 62,890 | 1,290 | |||||||||
| Net cash provided by operating activities |
544,038 | 793,165 | 813,316 | |||||||||
| Cash flows used in investing activities |
||||||||||||
| Proceeds from sales and maturities of investments available for sale |
11,403,443 | 4,301,189 | 5,215,820 | |||||||||
| Purchases of investments available for sale |
(10,776,997 | ) | (4,806,219 | ) | (5,402,302 | ) | ||||||
| Net (purchases) sales of short term investments |
(350,794 | ) | 589,422 | (757,353 | ) | |||||||
| Net (purchases) sales of other investments |
(218,263 | ) | (252,179 | ) | 15,326 | |||||||
| Net purchases of investments in other ventures |
(37,372 | ) | (1,702 | ) | (28,800 | ) | ||||||
| Net proceeds from other assets |
6,500 | | | |||||||||
| Net purchases of subsidiaries |
(77,631 | ) | | | ||||||||
| Net cash used in investing activities |
(51,114 | ) | (169,489 | ) | (957,309 | ) | ||||||
| Cash flows (used in) provided by financing activities |
||||||||||||
| Dividends paid common shares |
(57,850 | ) | (62,595 | ) | (60,413 | ) | ||||||
| Dividends paid preference shares |
(42,300 | ) | (42,861 | ) | (34,650 | ) | ||||||
| RenaissanceRe common share repurchases |
(428,406 | ) | (200,171 | ) | | |||||||
| Issuance of preference shares, net of expenses |
| | 291,127 | |||||||||
| Redemption of 7.0% Senior Notes |
(150,000 | ) | | | ||||||||
| Redemption of Series A preference shares |
| (150,000 | ) | | ||||||||
| Redemption of capital securities |
| (103,093 | ) | | ||||||||
| Net drawdown (repayment) of debt |
148,049 | 1,951 | (50,000 | ) | ||||||||
| Reverse repurchase agreement |
50,000 | | | |||||||||
| Secured asset financing |
(11,500 | ) | 88,920 | | ||||||||
| Net increase in minority interests |
| | 38,327 | |||||||||
| DaVinci share repurchase |
(100,000 | ) | | | ||||||||
| Third party DaVinciRe share repurchase |
43,549 | (40,000 | ) | | ||||||||
| Net cash (used in) provided by financing activities |
(548,458 | ) | (507,849 | ) | 184,391 | |||||||
| Net (decrease) increase in cash and cash equivalents |
(55,534 | ) | 115,827 | 40,398 | ||||||||
| Cash and cash equivalents, beginning of year |
330,226 | 214,399 | 174,001 | |||||||||
| Cash and cash equivalents, end of year |
$ | 274,692 | $ | 330,226 | $ | 214,399 | ||||||
See accompanying notes to the consolidated financial statements
F-8
Table of Contents
NOTES TO THE CONSOLIDATED FINANCIAL STATEMENTS
December 31, 2008 (amounts in tables expressed in thousands of United States dollars, except per share amounts)
NOTE 1. ORGANIZATION
RenaissanceRe Holdings Ltd. (RenaissanceRe, or the Company), was formed under the laws of Bermuda on June 7, 1993. Through its subsidiaries, the Company provides reinsurance and insurance to a broad range of customers.
| | Renaissance Reinsurance Ltd. (Renaissance Reinsurance), the Companys principal reinsurance subsidiary, provides property catastrophe and specialty reinsurance coverages to insurers and reinsurers on a worldwide basis. |
| | The Company also manages property catastrophe and specialty reinsurance business written on behalf of joint ventures, which principally include Top Layer Reinsurance Ltd. (Top Layer Re), recorded under the equity method of accounting, and DaVinci Reinsurance Ltd. (DaVinci). Because the Company owns a minority equity interest in, but controls a majority of the outstanding voting power of DaVincis parent, DaVinciRe Holdings Ltd. (DaVinciRe), the results of DaVinci and DaVinciRe are consolidated in the Companys financial statements. Minority interest represents the interests of external parties with respect to the net income and shareholders equity of DaVinciRe. Renaissance Underwriting Managers Ltd. (RUM), a wholly owned subsidiary, acts as exclusive underwriting manager for these joint ventures in return for fee-based income and profit participation. |
| | The Companys Individual Risk operations include direct insurance and quota share reinsurance written through the operating subsidiaries of Glencoe Group Holdings Ltd. (Glencoe Group). These operating subsidiaries principally include Stonington Insurance Company (Stonington), which writes business in the United States on an admitted basis, and Glencoe Insurance Ltd. (Glencoe) and Lantana Insurance Ltd. (Lantana), which write business in the United States on an excess and surplus lines basis, and also provide reinsurance coverage, principally through quota share contracts, which are analyzed on an individual risk basis. The Individual Risk operations also includes the results of Agro National Inc. (Agro National), a managing general underwriter of multi-peril crop insurance, which the Company acquired substantially all of the assets of on June 2, 2008. |
NOTE 2. SIGNIFICANT ACCOUNTING POLICIES
BASIS OF PRESENTATION
The consolidated financial statements have been prepared in accordance with accounting principles generally accepted in the United States (GAAP) and include the accounts of RenaissanceRe and its wholly owned and majority-owned subsidiaries and DaVinciRe, which are collectively referred to herein as the Company. All significant intercompany transactions and balances have been eliminated on consolidation. Certain prior year comparatives have been reclassified to conform to the current year presentation.
USE OF ESTIMATES IN FINANCIAL STATEMENTS
The preparation of financial statements in conformity with GAAP requires management to make estimates and assumptions that affect the reported and disclosed amounts of assets and liabilities and disclosure of contingent assets and liabilities at the date of the financial statements and the reported amounts of revenues and expenses during the reporting period. Actual results could differ materially from those estimates. The major estimates reflected in the Companys consolidated financial statements include, but are not limited to, the reserve for claims and claim expenses, losses recoverable, including allowances for losses recoverable deemed uncollectible, estimates of written and earned premiums, fair value, including the fair value of investments, financial instruments and derivatives, impairment charges and the Companys net deferred tax asset.
F-9
Table of Contents
PREMIUMS AND RELATED EXPENSES
Premiums are recognized as income, net of any applicable reinsurance or retrocessional coverage purchased, over the terms of the related contracts and policies. Premiums written are based on contract and policy terms and include estimates based on information received from both insureds and ceding companies. Subsequent differences arising on such estimates are recorded in the period in which they are determined. Reserve for unearned premiums represents the portion of premiums written that relate to the unexpired terms of contracts and policies in force. Such reserves are computed by pro-rata methods based on statistical data or reports received from ceding companies. Reinstatement premiums are estimated after the occurrence of a significant loss and are recorded in accordance with the contract terms based upon paid losses and case reserves. Reinstatement premiums are earned when written.
Acquisition costs, consisting principally of commissions, brokerage and premium tax expenses incurred at the time a contract or policy is issued, are deferred and amortized over the period in which the related premiums are earned. Deferred policy acquisition costs are limited to their estimated realizable value based on the related unearned premiums. Anticipated claims and claim expenses, based on historical and current experience, and anticipated investment income related to those premiums are considered in determining the recoverability of deferred acquisition costs.
CLAIMS AND CLAIM EXPENSES
The reserve for claims and claim expenses includes estimates for unpaid claims and claim expenses on reported losses as well as an estimate of losses incurred but not reported. The reserve is based on individual claims, case reserves and other reserve estimates reported by insureds and ceding companies as well as management estimates of ultimate losses. Inherent in the estimates of ultimate losses are expected trends in claim severity and frequency and other factors which could vary significantly as claims are settled. Also, during the past few years, the Company has increased its specialty reinsurance and Individual Risk premiums, but does not have the benefit of a significant amount of its own historical experience in these lines of business. Accordingly, the setting and reserving for incurred losses in these lines of business could be subject to greater variability.
Ultimate losses may vary materially from the amounts provided in the consolidated financial statements. These estimates are reviewed regularly and, as experience develops and new information becomes known, the reserves are adjusted as necessary. Such adjustments, if any, are reflected in the consolidated statements of operations in the period in which they become known and are accounted for as changes in estimates.
REINSURANCE
Amounts recoverable from reinsurers are estimated in a manner consistent with the claim liability associated with the reinsured policies. For multi-year retrospectively rated contracts, the Company accrues amounts (either assets or liabilities) that are due to or from assuming companies based on estimated contract experience. If the Company determines that adjustments to earlier estimates are appropriate, such adjustments are recorded in the period in which they are determined. Losses recoverable on dual trigger reinsurance contracts require the Company to estimate its ultimate losses applicable to these contracts as well as estimate the ultimate amount of insured industry losses that will be reported by the applicable statistical reporting agency, as per the contract terms. Amounts recoverable from reinsurers are recorded net of a valuation allowance for estimated uncollectible recoveries.
Assumed and ceded reinsurance contracts that lack a significant transfer of risk are treated as deposits.
INVESTMENTS, CASH AND CASH EQUIVALENTS
Investments in fixed maturities are classified as available for sale and are reported at fair value. Investment transactions are recorded on the trade date with balances pending settlement reflected in the balance sheet as a receivable for investments sold or a payable for investments purchased. Net investment income includes interest and dividend income together with amortization of market premiums and discounts and is net of investment management and custody fees. The amortization of premium and accretion of discount
F-10
Table of Contents
for fixed maturity securities is computed using the effective yield method. For mortgage-backed securities and other holdings for which there is prepayment risk, prepayment assumptions are evaluated quarterly and revised as necessary. Any adjustments required due to the change in effective yields and maturities are recognized on a prospective basis through yield adjustments. Fair values of investments are based on quoted market prices, or when such prices are not available, by reference to broker or underwriter bid indications and/or internal pricing valuation techniques. The net unrealized appreciation or depreciation on these investments is included in accumulated other comprehensive income.
Realized gains or losses on the sale of investments are determined on the basis of the first in first out cost method and include adjustments to the cost basis of investments for declines in value that are considered to be other than temporary. The Company routinely assesses whether declines in the fair value of its available for sale investments represent impairments that are other than temporary. There are several factors that are considered in the assessment of a security, which include (i) the time period during which there has been a significant decline below cost, (ii) the extent of the decline below cost, (iii) the Companys intent and ability to hold the security, (iv) the potential for the security to recover in value, (v) an analysis of the financial condition of the issuer and (vi) an analysis of the collateral structure and credit support of the security, if applicable. Where the Company has determined that there is an other than temporary decline in the fair value of the security, the cost of the security is written down to its fair value and the unrealized loss at the time of determination is charged to income.
Short term investments, which are managed as part of the Companys investment portfolio and have a maturity of one year or less when purchased, are carried at fair value. Cash equivalents include money market instruments with a maturity of ninety days or less when purchased.
Other investments are carried at fair value with interest and dividend income, income distributions and realized and unrealized gains and losses included in net investment income. The fair value of other investments is generally established on the basis of the net valuation criteria established by the managers of the investments. These net valuations are determined based upon the valuation criteria established by the governing documents of such investments. Many of the Companys other investments are subject to restrictions on redemptions or sales which are determined by the governing documents and limit the Companys ability to liquidate these investments in the short term. In addition, due to a lag in reporting, some of the Companys fund managers, fund administrators, or both, are unable to provide final fund valuations as of the Companys current reporting date. In these circumstances, the Company estimates the fair value of these funds by starting with the prior months or quarters fund valuation, adjusting these valuations for capital calls, redemptions or distributions and the impact of changes in foreign currency exchange rates, and then estimating the return for the current period. In circumstances in which the Company estimates the return for the current period, it uses all credible information available. This principally includes preliminary estimates reported by its fund managers, obtaining the valuation of underlying portfolio investments where such underlying investments are publicly traded and therefore have a readily observable price, using information that is available to the Company with respect to the underlying investments, reviewing various indices for similar investments or asset classes, as well as estimating returns based on the results of similar types of investments for which the Company has reported results, or other valuation methods, as necessary. Actual final fund valuations may differ, perhaps materially so, from the Companys estimates and these differences are recorded in the period they become known as a change in estimate. The Companys estimate of the fair value of catastrophe bonds are based on quoted market prices, or when such prices are not available, by reference to broker or underwriter bid indications.
Investments in which the Company has significant influence over the operating and financial policies of the investee are classified as investments in other ventures, under equity method, and are accounted for under the equity method of accounting. Under this method, the Company records its proportionate share of income or loss from such investments in its results for the period. Any decline in value of investments in other ventures, under equity method considered by management to be other than temporary is charged to income in the period in which it is determined.
F-11
Table of Contents
DERIVATIVES
The Company enters into derivative instruments such as futures, options, swaps, forward contracts and other derivative contracts in order to manage its foreign currency exposure, obtain exposure to a particular financial market, for yield enhancement, or for trading and speculation. The Company accounts for its derivatives in accordance with FASB Statement No. 133, Accounting for Derivative Instruments and Hedging Activities (FAS 133), which requires all derivatives to be recorded at fair value on the Companys balance sheet as either assets or liabilities, depending on their rights or obligations, with changes in fair value reflected in current earnings. The Company does not currently apply hedge accounting. The fair value of the Companys derivatives are estimated by reference to quoted prices or broker quotes, where available, or in the absence of quoted prices or broker quotes, the use of industry or internal valuation models.
FAIR VALUE
The Company accounts for certain of its assets and liabilities at fair value in accordance with FASB Statement No. 157, Fair Value Measurements (FAS 157). FAS 157 clarifies the definition of fair value, establishes a framework for measuring fair value and expands disclosures about fair value measurements. FAS 157 clarifies that fair value is a market-based measurement, not an entity-specific measurement, and sets out a fair value hierarchy with the highest priority being quoted prices in active markets and the lowest priority to unobservable data. Fair value is the price that would be received upon the sale of an asset or paid to transfer a liability in an orderly transaction between open market participants at the measurement date. The Company recognizes the change in unrealized gains and losses arising from changes in fair value in its statements of operation, with the exception of changes in unrealized gains and losses on its fixed maturity investments available for sale, which are recognized as a component of accumulated other comprehensive income in shareholders equity. Further, FAS 157 requires tabular disclosures of the fair value measurements by level within the fair value hierarchy.
BUSINESS COMBINATIONS, GOODWILL AND OTHER INTANGIBLE ASSETS
The Company accounts for business combinations in accordance with FASB Statement No. 141, Business Combinations (FAS 141), and goodwill and other intangible assets that arise from business combinations in accordance with FASB Statement No. 142, Goodwill and Other Intangible Assets (FAS 142). A purchase price that is in excess of the fair value of the net assets acquired arising from a business combination is recorded as goodwill, and is not amortized. Other intangible assets with a finite life are amortized over the estimated useful life of the asset. Other intangible assets with an indefinite useful life are not amortized.
Goodwill and other intangible assets are tested for impairment on an annual basis or more frequently if events or changes in circumstances indicate that the carrying amount may not be recoverable. For purposes of annual impairment evaluation, goodwill is assigned to the applicable reporting unit of the acquired entities giving rise to the goodwill. Goodwill and other intangible assets recorded in connection with investments accounted for under the equity method, are recorded as Investments in other ventures, under equity method on the Companys consolidated balance sheets.
The Company has established September 30 as the date for performing its annual impairment tests. If goodwill or other intangible assets are impaired, they are written down to their estimated fair values with a corresponding expense reflected in the Companys consolidated statements of operations.
EARNINGS PER SHARE
Basic earnings per share are based on weighted average common shares and exclude any dilutive effects of options and restricted stock. Diluted earnings per share assume the exercise of all dilutive stock options and restricted stock grants.
FOREIGN EXCHANGE
The Companys functional currency is the United States dollar. Revenues and expenses denominated in foreign currencies are translated at the prevailing exchange rate at the transaction date. Monetary assets
F-12
Table of Contents
and liabilities denominated in foreign currencies are translated at exchange rates in effect at the balance sheet date, which may result in the recognition of exchange gains or losses which are included in the determination of net income.
TAXATION
Income taxes have been provided in accordance with the provisions of FASB Statement No. 109, Accounting for Income Taxes, on those operations which are subject to income taxes. Deferred tax assets and liabilities result from temporary differences between the amounts recorded in the consolidated financial statements and the tax basis of the Companys assets and liabilities. Such temporary differences are primarily due to the tax basis discount on unpaid losses and loss expenses, unearned premium reserves, net operating loss carryforwards, intangible assets, accrued expenses, deferred policy acquisition costs and certain investments. The effect on deferred tax assets and liabilities of a change in tax rates is recognized in income in the period that includes the enactment date. A valuation allowance against deferred tax assets is recorded if it is more likely than not that all, or some portion, of the benefits related to deferred tax assets will not be realized.
Uncertain tax positions are accounted for in accordance with FASB Interpretation No. 48, Accounting for Uncertainty in Income Taxes (FIN 48). Uncertain tax positions must meet a more-likely-than-not recognition threshold to be recognized.
VARIABLE INTEREST ENTITIES
The Company accounts for variable interest entities (VIE) in accordance with FASB Interpretation No. 46, Consolidation of Variable Interest Entities an Interpretation of ARB No. 51, as revised (FIN 46(R)), which requires the consolidation of all VIEs by the investor that will absorb a majority of the VIEs expected losses or residual returns. Refer to Note 11. Variable Interest Entities, for more information.
STOCK INCENTIVE COMPENSATION PLANS
Effective January 1, 2006, the Company adopted FASB Statement No. 123 (revised 2004), Share-Based Payment (FAS 123(R)), using the modified prospective transition method. Under the modified prospective transition method, compensation cost recognized for the twelve months ending December 31, 2007 and 2006 includes: (a) compensation cost for all share-based payments granted prior to, but not yet vested, as of January 1, 2006 based on the grant date fair value estimated in accordance with the original provisions of FASB Statement No. 123, Accounting for Stock-Based Compensation (FAS 123) and (b) compensation cost for all share-based payments granted subsequent to January 1, 2006, based on the grant date fair value estimated in accordance with the provisions of FAS 123(R). The adoption of FAS 123(R) did not have a material impact on the Company.
Prior to adopting FAS 123(R), the Company accounted for stock-based compensation under the fair value recognition provisions of FAS 123 with effect from January 1, 2003 for all stock-based employee compensation granted, modified or settled after January 1, 2003 under the prospective method described in FASB Statement No. 148, Accounting for Stock-Based Compensation Transition and Disclosure (FAS 148). Prior to January 1, 2003, the Company accounted for stock-based employee compensation under the recognition and measurement provisions of APB Opinion Number 25, Accounting for Stock Issued to Employees, and related interpretations.
RECENTLY ISSUED ACCOUNTING PRONOUNCEMENTS
Fair Value Measurements
In September 2006, the FASB issued FASB Statement No. 157, Fair Value Measurements (FAS 157). FAS 157 clarifies the definition of fair value, establishes a framework for measuring fair value and expands disclosures about fair value measurements. FAS 157 clarifies that fair value is a market-based measurement, not an entity-specific measurement, and sets out a fair value hierarchy with the highest priority being quoted prices in active markets and the lowest priority to unobservable data. Further, FAS 157
F-13
Table of Contents
requires tabular disclosures of the fair value measurements by level within the fair value hierarchy. FAS 157 became effective for the Company on January 1, 2008 and the adoption of FAS 157 did not have a material impact on the Companys statements of operations and financial condition when adopted.
In order to address the application of FAS 157 in a market that is not active, the FASB issued FASB Staff Position 157-3 (FSP 157-3) in October 2008. FSP 157-3 clarifies the application of FAS 157 in a market that is not active and provides examples to illustrate key considerations in determining the fair value of a financial asset when the market for that financial asset is not active. FSP 157-3 applies to financial assets within the scope of accounting pronouncements that require or permit fair value measurements in accordance with FAS 157 and became effective upon issuance, including prior periods for which financial statements have not been issued. The application of FSP 157-3 did not have a material impact on the Companys statements of operations and financial condition.
The Fair Value Option for Financial Assets and Financial Liabilities
In February 2007, the FASB issued FASB Statement No. 159, The Fair Value Option for Financial Assets and Financial Liabilities (FAS 159). FAS 159 permits an entity to choose, at specified election dates, to measure eligible financial instruments and certain other items at fair value that are not currently required to be measured at fair value. An entity shall report unrealized gains and losses on items for which the fair value option has been elected in earnings at each subsequent reporting date. Upfront costs and fees related to items for which the fair value option is elected shall be recognized in earnings as incurred and not deferred. FAS 159 also establishes presentation and disclosure requirements designed to facilitate comparisons between entities that choose different measurement attributes for similar types of assets and liabilities. FAS 159 became effective for the Company on January 1, 2008 and the Company elected the fair value option for certain financial assets and financial liabilities. An entity shall report the effect of the first remeasurement to fair value as a cumulative-effect adjustment to the opening balance of retained earnings. The adoption of FAS 159 did not have a material impact on the Companys statements of operations and financial condition when adopted.
Business Combinations and Accounting and Reporting of Noncontrolling Interest in Consolidated Financial Statements
On December 4, 2007, the FASB issued Statement No. 141(R), Business Combinations (FAS 141(R)) and Statement No. 160, Accounting and Reporting of Noncontrolling Interest in Consolidated Financial Statements, an amendment of ARB No. 51 (FAS 160). These new standards will significantly change the accounting for and reporting of business combination transactions and noncontrolling (minority) interests in consolidated financial statements. FAS 141(R) expands the scope of acquisition accounting to all transactions and circumstances under which control of a business is obtained. Under FAS 160, noncontrolling interests are classified as a component of consolidated shareholders equity and minority interest accounting is eliminated such that earnings attributable to noncontrolling interests are reported as part of consolidated earnings and not as a separate component of income or expense. FAS 141(R) and FAS 160 are required to be adopted simultaneously and are effective for the first annual reporting period beginning on or after December 15, 2008. Earlier adoption is prohibited. The Company is currently evaluating the potential impacts of the adoption of FAS 141(R) and FAS 160 on the Companys statements of operations and financial condition when adopted.
Disclosures about Derivative Instruments and Hedging Activities
In March 2008, the FASB issued Statement No. 161, Disclosures about Derivative Instruments and Hedging Activities an amendment of FASB Statement No. 133 (FAS 161). FAS 161 requires entities to provide enhanced disclosures about (a) how and why an entity uses derivative instruments, (b) how derivative instruments and related hedged items are accounted for under FASB Statement No. 133, Accounting for Derivative Instruments and Hedging Activities and its related interpretations and (c) how derivative instruments and related hedged items affect an entitys financial position, results of operations and cash flows. FAS 161 requires qualitative disclosures about objectives and strategies for using derivatives, quantitative disclosures about fair value amounts of gains and losses on derivative instruments and credit-risk related contingent features in derivative instruments. FAS 161 is to be applied prospectively and is effective for financial statements issued for fiscal years and interim periods beginning after
F-14
Table of Contents
November 15, 2008, with early application encouraged. In years after initial adoption, FAS 161 requires comparative disclosures only for periods subsequent to initial adoption. FAS 161 is a disclosure standard and as such is not expected to impact the Companys consolidated statements of operations and financial condition when adopted.
Determining Whether Instruments Granted in Share-Based Payment Transactions Are Participating Securities
In June 2008, the FASB issued Emerging Issues Task Force 03-6-1, Determining Whether Instruments Granted in Share-Based Payment Transactions Are Participating Securities (EITF 03-6-1). EITF 03-6-1 addresses whether instruments granted in share-based payment transactions are participating securities prior to vesting and, therefore, need to be included in the earnings allocation in computing earnings per share under Statement No. 128, Earnings per Share. EITF 03-6-1 provides guidance on the calculation of earnings per share for share-based payment awards with rights to dividends or dividend equivalents. EITF 03-6-1 is effective for financial statements issued for fiscal years beginning after December 15, 2008, and interim periods within those years. The adoption of EITF 03-6-1 is not expected to have a material effect on the Companys consolidated statements of operations and financial condition when adopted.
NOTE 3. BUSINESS COMBINATIONS
On June 2, 2008, the Company acquired substantially all the assets and assumed certain liabilities of Agro National, LLC. Agro National is based in Council Bluffs, Iowa and is a managing general underwriter of multi-peril crop insurance. Agro National offers high quality risk protection products and services to the agricultural community throughout the U.S. Agro National participates in the U.S. Federal governments Multi-Peril Crop Insurance Program and has been writing business on behalf of Stonington, a wholly owned subsidiary of the Company, since 2004. The base purchase price paid by the Company was $80.5 million, plus additional amounts as determined in accordance with the terms of the asset purchase agreement. In connection with the purchase, the Company recorded $46.3 million of intangible assets and $20.4 million of goodwill in the second quarter of 2008. The acquisition was undertaken to purchase the distribution channel for the Companys multi-peril crop insurance business which was previously conducted through a managing general agency contractual relationship with Agro National, LLC. Other factors that added to the value of Agro National, LLC included its agent relationships, systems and technology, brand name and workforce. These factors resulted in a purchase price greater than the fair value of the net assets acquired and the recognition of goodwill and intangible assets. The acquisition of the net assets was accounted for using the purchase method in accordance with FAS 141.
The fair value of the assets and liabilities acquired and allocation of purchase price is summarized as follows:
| Total purchase price |
$ | 80,500 | ||||
| Assets acquired |
||||||
| Cash and cash equivalents |
$ | 4,867 | ||||
| Accounts and notes receivable |
31,241 | |||||
| Property and equipment |
378 | |||||
| Software |
12,600 | |||||
| Other assets |
14 | |||||
| Tangible assets acquired |
49,100 | |||||
| Intangible asset Agent relationships |
39,900 | |||||
| Intangible asset Trade name |
3,500 | |||||
| Intangible asset Covenants not-to-compete |
2,900 | |||||
| Intangible assets acquired |
46,300 | |||||
| Liabilities acquired |
||||||
| Accounts payable and accrued liabilities |
35,345 | |||||
| Liabilities acquired |
35,345 | |||||
| Excess purchase price Goodwill |
$ | 20,445 | ||||
F-15
Table of Contents
Agent relationships represent the value of the existing non-contractual relationships Agro National, LLC had with its insurance agents. Agent relationships have a finite estimated useful life of approximately 20 years and are being amortized in proportion to their expected cash flows. The trade name represents the value of the Agro National, LLC brand and is estimated to have a useful life of 25 years. The trade name is being amortized straight line over 25 years. Covenants not-to-compete represent non-compete agreements with key employees of Agro National, LLC. These agreements are being amortized straight line over their contractual life which has a weighted average life of approximately four years. Goodwill is estimated to have an indefinite life. The goodwill and intangible assets are recorded entirely in the Companys Individual Risk segment. During 2008, the Company recorded $4.2 million of intangible asset amortization related to these intangibles.
The estimated remaining amortization expense for the intangible assets is as follows:
| 2009 |
$ | 4,476 | |
| 2010 |
4,349 | ||
| 2011 |
4,205 | ||
| 2012 |
3,623 | ||
| 2013 and thereafter |
25,496 | ||
| Total |
$ | 42,149 | |
Operating results of Agro National have been included in the consolidated financial statements from June 2, 2008, the date of acquisition. FAS 141 requires the following selected unaudited pro-forma information be provided to present a summary of the combined results of the Company and Agro National assuming the transaction had been effective January 1, 2007 and 2008, respectively. The unaudited pro-forma data is for informational purposes only and does not necessarily represent results that would have occurred if the transaction had taken place on the basis assumed above.
| Year ended December 31, |
2008 | 2007 | |||||
| (unaudited) | (unaudited) | ||||||
| Gross premiums written |
$ | 1,736,028 | $ | 1,809,637 | |||
| Net premiums earned |
$ | 1,386,824 | $ | 1,424,369 | |||
| Total revenue |
$ | 1,231,196 | $ | 1,665,554 | |||
| Total expenses |
$ | 1,137,584 | $ | 899,640 | |||
| Net (loss) income (attributable) available to common shareholders |
$ | (4,389 | ) | $ | 577,089 | ||
| Net (loss) income (attributable) available to common shareholders per common share basic |
$ | (0.07 | ) | $ | 8.18 | ||
| Net (loss) income (attributable) available to common shareholders per common share diluted (1) |
$ | (0.07 | ) | $ | 8.03 | ||
| (1) | In accordance with FAS 128, earnings per share calculations use average common shares outstanding basic, when in a net loss position. |
The pro-forma net (loss) income (attributable) available to common shareholders per common share diluted for the year ended December 31, 2008 and 2007 of $(0.07) and $8.03, respectively, compares to actual results of $(0.21) and $7.93 for the year ended December 31, 2008 and 2007, respectively.
Effective April 1, 2008, the Company purchased substantially all the assets of Claims Management Services, Inc. (CMS). CMS was subsequently renamed Glencoe Group Claims Management Inc. (Glencoe Claims). Glencoe Claims is based in Roswell, Georgia and is a privately held company specializing in claims administration, adjusting and consulting services for insurance companies, managing general agents, self-insured clients, fronted programs and clients with substantial retentions or deductibles. Glencoe Claims has a proprietary network of licensed adjusters and offers services on a national basis. The Company uses Glencoe Claims for claims services solely for its own business and Glencoe Claims is not currently providing claims services to third parties. The base purchase price paid by the Company was $3.8 million, plus additional amounts as determined in accordance with the terms of the asset purchase agreement. In connection with the purchase, the Company acquired net assets with a fair value of $0.5 million and recorded $3.3 million of goodwill. Goodwill is estimated to have an indefinite life and is recorded entirely in the Companys Individual Risk segment.
F-16
Table of Contents
NOTE 4. GOODWILL AND OTHER INTANGIBLE ASSETS
The following table shows an analysis of goodwill and other intangibles assets for the years ended December 31, 2008 and 2007:
| Goodwill and other intangibles | |||||||||||
| Goodwill |
Other intangible assets |
Total | |||||||||
| Balance as of December 31, 2006 |
$ | 1,452 | $ | 2,603 | $ | 4,055 | |||||
| Acquired during the year |
846 | 3,129 | 3,975 | ||||||||
| Amortization |
| (1,793 | ) | (1,793 | ) | ||||||
| Impairment losses |
| | | ||||||||
| Balance as of December 31, 2007 |
2,298 | 3,939 | 6,237 | ||||||||
| Acquired during the year |
$ | 23,710 | $ | 50,910 | $ | 74,620 | |||||
| Amortization |
| (6,676 | ) | (6,676 | ) | ||||||
| Impairment losses |
| | | ||||||||
| Balance as of December 31, 2008 |
$ | 26,008 | $ | 48,173 | $ | 74,181 | |||||
The majority of the increase in goodwill and other intangible assets in 2008, relates to the asset acquisitions of Agro National, LLC and CMS as described in Note 3. Business Combinations. In addition, the Company acquired other intangible assets of $4.6 million relating to a small acquisition and the purchase of patents.
The following table shows an analysis of goodwill and other intangibles assets included in investments in other ventures, under equity method for the years ended December 31, 2008 and 2007:
| Goodwill and other intangible assets included in investments in other ventures, under equity method |
|||||||||||
| Goodwill |
Other intangible assets |
Total | |||||||||
| Balance as of December 31, 2006 |
$ | | $ | | $ | | |||||
| Acquired during the year |
| | | ||||||||
| Amortization |
| | | ||||||||
| Impairment losses |
| | | ||||||||
| Balance as of December 31, 2007 |
| | | ||||||||
| Acquired during the year |
$ | 8,477 | $ | 44,323 | $ | 52,800 | |||||
| Amortization |
| (2,980 | ) | (2,980 | ) | ||||||
| Impairment losses |
| | | ||||||||
| Balance as of December 31, 2008 |
$ | 8,477 | $ | 41,343 | $ | 49,820 | |||||
The useful life of intangible assets with finite lives ranges from 1 to 25 years, with a weighted-average amortization period of 16 years. Expected amortization of the intangible assets, including intangible assets recorded in investments in other ventures, under equity method is shown below:
| 2009 |
$ | 12,447 | |
| 2010 |
10,425 | ||
| 2011 |
9,772 | ||
| 2012 |
8,681 | ||
| 2013 and thereafter |
48,191 | ||
| Total |
$ | 89,516 | |
F-17
Table of Contents
NOTE 5. INVESTMENTS
Fixed Maturity Investments Available For Sale
The amortized cost, fair value and related unrealized gains and losses on fixed maturity investments are as follows:
| At December 31, 2008 |
Amortized cost | Gross unrealized gains |
Gross unrealized losses |
Fair value | ||||||||
| U.S. treasuries |
$ | 462,489 | $ | 4,991 | $ | | $ | 467,480 | ||||
| Agencies |
431,527 | 16,994 | | 448,521 | ||||||||
| Non-U.S. government |
53,592 | 3,466 | | 57,058 | ||||||||
| Corporate |
719,234 | 27,976 | | 747,210 | ||||||||
| Mortgage-backed |
1,084,156 | 26,438 | | 1,110,594 | ||||||||
| Asset-backed |
165,993 | 29 | | 166,022 | ||||||||
| $ | 2,916,991 | $ | 79,894 | $ | | $ | 2,996,885 | |||||
| At December 31, 2007 |
Amortized cost | Gross unrealized gains |
Gross unrealized losses |
Fair value | ||||||||
| U.S. treasuries |
$ | 760,624 | $ | 7,161 | $ | | $ | 767,785 | ||||
| Agencies |
285,954 | 4,240 | | 290,194 | ||||||||
| Non-U.S. government |
63,342 | 3,154 | | 66,496 | ||||||||
| Corporate |
919,243 | 18,046 | | 937,289 | ||||||||
| Mortgage-backed |
1,240,316 | 11,266 | | 1,251,582 | ||||||||
| Asset-backed |
594,423 | 6,594 | | 601,017 | ||||||||
| $ | 3,863,902 | $ | 50,461 | $ | | $ | 3,914,363 | |||||
During the year ended December 31, 2008, the Company recorded $217.0 million (2007 $25.5 million, 2006 $46.4 million) in other than temporary impairment charges including impairment charges for which the Company believes it will not be able to recover the full principal amount if the impaired security is held to maturity, of $8.3 million (2007 $nil, 2006 $0.1 million). As of December 31, 2008 and 2007, the Company had essentially no fixed maturity investments available for sale in an unrealized loss position.
Contractual maturities of fixed maturity securities are shown below. Expected maturities will differ from contractual maturities because borrowers may have the right to call or prepay obligations with or without call or prepayment penalties. This table does not reflect short term investments.
| At December 31, 2008 |
Amortized cost | Fair value | ||||
| Due in less than one year |
$ | 113,014 | $ | 115,316 | ||
| Due after one through five years |
1,298,769 | 1,327,837 | ||||
| Due after five through ten years |
169,722 | 183,396 | ||||
| Due after ten years |
85,337 | 93,720 | ||||
| Mortgage-backed |
1,084,156 | 1,110,594 | ||||
| Asset-backed |
165,993 | 166,022 | ||||
| Total |
$ | 2,916,991 | $ | 2,996,885 | ||
F-18
Table of Contents
Net Investment Income
The components of net investment income are as follows:
| Year ended December 31, |
2008 | 2007 | 2006 | |||||||||
| Fixed maturity investments available for sale |
$ | 201,220 | $ | 176,785 | $ | 158,516 | ||||||
| Short term investments |
48,437 | 118,483 | 92,818 | |||||||||
| Other investments |
||||||||||||
| Hedge funds and private equity investments |
(101,779 | ) | 87,985 | 50,333 | ||||||||
| Other |
(117,867 | ) | 17,469 | 15,335 | ||||||||
| Cash and cash equivalents |
7,452 | 11,026 | 8,552 | |||||||||
| Dividends on equity investment in reinsurance company |
| | 317 | |||||||||
| 37,463 | 411,748 | 325,871 | ||||||||||
| Investment expenses |
(13,232 | ) | (9,285 | ) | (7,765 | ) | ||||||
| Net investment income |
$ | 24,231 | $ | 402,463 | $ | 318,106 | ||||||
The analysis of realized (losses) gains and the change in unrealized gains on investments is as follows:
| Year ended December 31, |
2008 | 2007 | 2006 | |||||||||
| Gross realized gains |
$ | 99,634 | $ | 35,923 | $ | 21,034 | ||||||
| Gross realized losses |
(88,934 | ) | (9,117 | ) | (9,097 | ) | ||||||
| Other than temporary impairments |
(217,014 | ) | (25,513 | ) | (46,401 | ) | ||||||
| Net realized (losses) gains on investments |
(206,314 | ) | 1,293 | (34,464 | ) | |||||||
| Change in unrealized gains |
29,433 | 19,502 | 20,457 | |||||||||
| Total realized and change in unrealized (losses) gains on investments |
$ | (176,881 | ) | $ | 20,795 | $ | (14,007 | ) | ||||
At December 31, 2008, $147.4 million of cash and investments at fair value were on deposit with, or in trust accounts for the benefit of various counterparties, including $53.2 million associated with a $50.0 million reverse repurchase agreement.
Under the terms of certain reinsurance contracts, certain of the Companys subsidiaries and joint ventures may be required to provide letters of credit to reinsureds in respect of reported claims and/or unearned premiums. To support the Companys letters of credit, participating operating subsidiaries and joint ventures have pledged shares of Renaissance Investment Holdings Ltd. (RIHL) and other securities owned by them as collateral. At December 31, 2008, the Company had pledged RIHL shares and other securities in the amount of $1,148.1 million to support its letters of credit.
Other Investments
The table below shows the Companys portfolio of other investments:
| At December 31, |
2008 | 2007 | ||||
| Private equity partnerships |
$ | 258,901 | $ | 301,446 | ||
| Senior secured bank loan funds |
215,870 | 158,203 | ||||
| Hedge funds |
105,838 | 126,417 | ||||
| Catastrophe bonds |
93,085 | 95,535 | ||||
| Non-U.S. fixed income funds |
81,719 | 126,252 | ||||
| Miscellaneous other investments |
18,062 | 11 | ||||
| Total other investments |
$ | 773,475 | $ | 807,864 | ||
Interest income, income distributions and realized and unrealized gains and losses on other investments are included in net investment loss and totaled $219.6 million (2007 income of $105.5 million, 2006 income of $65.7 million) of which $259.4 million was related to net unrealized losses (2007 net unrealized gains of $47.3 million, 2006 net unrealized gains of $30.1 million).
F-19
Table of Contents
As of December 31, 2008, the Company has committed capital to private equity partnerships of $586.7 million, of which $348.7 million has been contributed.
Investments in Other Ventures, under Equity Method
The table below shows the Companys portfolio of investments in other ventures, under equity method:
| Year ended December 31, |
2008 | 2007 | ||||||||||||||
| Investment | Ownership % |
Carrying Value |
Investment | Ownership % |
Carrying Value |
|||||||||||
| ChannelRe |
$ | 119,697 | 32.7 | $ | | $ | 119,697 | 32.7 | $ | | ||||||
| Tower Hill Companies |
50,000 | 25.0 | 47,699 | | | | ||||||||||
| Top Layer Re |
13,125 | 50.0 | 25,367 | 13,125 | 50.0 | 28,982 | ||||||||||
| Tower Hill |
10,000 | 28.6 | 15,227 | 10,000 | 28.6 | 14,382 | ||||||||||
| Aladdin |
| | | 25,500 | 14.6 | 25,500 | ||||||||||
| Starbound II |
| | | 19,237 | 17.1 | 21,708 | ||||||||||
| Other |
12,040 | n/a | 11,586 | | | | ||||||||||
| Total investments in other ventures, under equity method |
$ | 204,862 | $ | 99,879 | $ | 187,559 | $ | 90,572 | ||||||||
In addition to the Companys $10.0 million investment in Tower Hill Holdings Inc. (Tower Hill) during 2005, representing a 28.6% equity interest, on July 1, 2008, the Company invested $50.0 million, representing a 25.0% equity interest, in Tower Hill Insurance Group, LLC (THIG), Tower Hill Claims Services, LLC (THCS) and Tower Hill Claims Management, LLC (THCM) (collectively the Tower Hill Companies). THIG is a managing general agency specializing in insurance coverage for site built and manufactured homes. The Companys investment was greater than the fair value of the net assets acquired and therefore resulted in the recognition of goodwill and intangible assets. In connection with the investment, the Company recorded $40.0 million of intangible assets and $7.8 million of goodwill on the July 1, 2008 effective date. The investment in the Tower Hill Companies was accounted for using the equity method in accordance with Accounting Principles Board Opinion 18, The Equity Method of Accounting for Investments in Common Stock (APB 18) and as such, the goodwill and intangible assets are recorded under Investments in other ventures, under equity method in the Companys consolidated balance sheet at December 31, 2008.
Investments in other ventures, under equity method includes the Companys investment in ChannelRe of $nil (2007 $nil). During the fourth quarter of 2007, ChannelRe estimated unrealized mark-to-market losses in its portfolio of financial guaranty contracts accounted for as derivatives under GAAP, were in excess of its shareholders equity. As a result of these mark-to-market losses, the Company reduced its carried value of ChannelRe to $nil at December 31, 2007 and until such time as ChannelRes shareholders equity is positive, the Company will not record any equity in earnings in its investment in ChannelRe. As a result, the carried value of ChannelRe at December 31, 2008 continues to be $nil. It is possible that with the adoption of FAS 157, that in future periods the nonperformance risk or own credit risk portion of ChannelRes mark-to-market on its financial guaranty contracts accounted for as derivatives under GAAP may increase, or that the underlying mark-to-market on ChannelRes financial guaranty contracts accounted for as derivatives under GAAP may decrease, or both, which could result in ChannelRe returning to a positive equity position, at which time the Company would then record its share of ChannelRes net income, subject to impairment, or its share of ChannelRes net loss.
During the fourth quarter of 2007, the Company invested $25.5 million in the preferred equity of Aladdin, representing a 14.6% ownership interest. Aladdin was established to provide credit protection on fixed income securities in return for a premium. Due to adverse market conditions, Aladdin elected to not write any business and subsequently announced during the fourth quarter of 2008, that it would wind-up its operations and return the residual capital to shareholders. The Company expects to receive the majority of its original investment, less administrative expenses incurred. At December 31, 2008, the Company had recorded a receivable of $24.4 million in other assets for the expected liquidation value of Aladdin. During January 2009, the Company received an initial payout of $24.2 million with the final distribution expected to be received during the second quarter of 2009.
F-20
Table of Contents
Investments in other ventures, under equity method also includes an original investment of $13.1 million in Top Layer Re, representing a 50.0% ownership.
In May 2007, the Company invested $10.0 million in Starbound II, which represents a 9.8% equity ownership interest in Starbound II and in December 2007 the Company invested an additional $9.2 million in Starbound II which increased the Companys investment and ownership percentage to $19.2 million and 17.1%, respectively. Effective July 31, 2008, Starbound II repurchased the outstanding shares of its investors at book value; as a result, the Company now owns 100% of Starbound II and consequently, Starbound II became a consolidated entity effective August 1, 2008.
The table below shows the Companys equity in earnings (losses) of other ventures, under equity method:
| Year ended December 31, |
2008 | 2007 | 2006 | ||||||||
| Top Layer Re |
$ | 11,377 | $ | 14,949 | $ | 12,703 | |||||
| Starbound II |
3,202 | 2,472 | | ||||||||
| Tower Hill and Tower Hill Companies |
545 | 3,432 | 602 | ||||||||
| Channel Re |
| (151,751 | ) | 19,097 | |||||||
| Other |
(1,521 | ) | 2,289 | 2,126 | |||||||
| Total equity in earnings (losses) of other ventures |
$ | 13,603 | $ | (128,609 | ) | $ | 34,528 | ||||
The equity in earnings (losses) of ChannelRe, Tower Hill and Tower Hill Companies are reported one quarter in arrears, except that the Companys 2007 results reflect the estimated fourth quarter charge from ChannelRe as it relates to unrealized mark-to-market losses in ChannelRes portfolio of financial guaranty contracts accounted for as derivatives under GAAP.
Undistributed losses in the Companys investments in other ventures were $102.1 million at December 31, 2008 (2007 $97.0 million).
Refer to Note 25. Summarized Financial Information of ChannelRe Holdings Ltd., for more information on ChannelRe.
NOTE 6. FAIR VALUE MEASUREMENTS
The use of fair value to measure certain assets and liabilities with resulting unrealized gains or losses, is pervasive within the Companys financial statements, and is a critical accounting policy and estimate for the Company. Fair value is the price that would be received upon the sale of an asset or paid to transfer a liability in an orderly transaction between open market participants at the measurement date. The Company recognizes the change in unrealized gains and losses arising from changes in fair value in its statements of operation, with the exception of changes in unrealized gains and losses on its fixed maturity investments available for sale, which are recognized as a component of accumulated other comprehensive income in shareholders equity.
FAS 157 establishes a fair value hierarchy that prioritizes the inputs to the respective valuation techniques used to measure fair value. The hierarchy gives the highest priority to unadjusted quoted prices in active markets for identical assets or liabilities (Level 1) and the lowest priority to unobservable inputs (Level 3). The three levels of the fair value hierarchy under FAS 157 are described below:
| | Fair values determined by Level 1 inputs utilize unadjusted quoted prices obtained from active markets for identical assets or liabilities that the Company has access to. The fair value is determined by multiplying the quoted price by the quantity held by the Company; |
| | Fair values determined by Level 2 inputs utilize inputs other than quoted prices included in Level 1 that are observable for the asset or liability, either directly or indirectly. Level 2 inputs include quoted prices for similar assets and liabilities in active markets, and inputs other than quoted prices that are observable for the asset or liability, such as interest rates and yield curves that are observable at commonly quoted intervals, broker quotes and certain pricing indices; and |
| | Level 3 inputs are based on unobservable inputs for the asset or liability, and include situations where there is little, if any, market activity for the asset or liability. In these cases, significant |
F-21
Table of Contents
| management assumptions can be used to establish managements best estimate of the assumptions used by other market participants in determining the fair value of the asset or liability. |
In certain cases, the inputs used to measure fair value may fall into different levels of the fair value hierarchy. In such cases, the level in the fair value hierarchy within which the fair value measurement in its entirety falls has been determined based on the lowest level input that is significant to the fair value measurement of the asset or liability. The Companys assessment of the significance of a particular input to the fair value measurement in its entirety requires judgment, and the Company considers factors specific to the asset or liability.
There have been no material changes in the Companys valuation techniques since the adoption of FAS 157 effective January 1, 2008.
Below is a summary of the assets and liabilities that are measured at fair value on a recurring basis:
| At December 31, 2008 |
Total | Quoted Prices in Active Markets for Identical Assets (Level 1) |
Significant Other Observable Inputs (Level 2) |
Significant Unobservable Inputs (Level 3) |
||||||||||
| Assets |
||||||||||||||
| Fixed maturity investments available for sale |
$ | 2,996,885 | $ | 467,480 | $ | 2,529,405 | $ | | ||||||
| Short term investments |
2,172,343 | | 2,172,343 | | ||||||||||
| Other investments |
773,475 | | 391,395 | 382,080 | ||||||||||
| Other secured assets |
76,424 | | 76,424 | | ||||||||||
| Other assets and liabilities (1) |
(8,714 | ) | 31,167 | 2,631 | (42,512 | ) | ||||||||
| $ | 6,010,413 | $ | 498,647 | $ | 5,172,198 | $ | 339,568 | |||||||
| (1) | Other assets of $34.3 million, $29.9 million and $10.3 million are included in Level 1, Level 2 and Level 3, respectively. Other liabilities of $3.1 million, $27.3 million and $52.8 million are included in Level 1, Level 2 and Level 3, respectively. |
Fixed maturity investments available for sale included in Level 1 consist of the Companys investments in U.S. treasuries. Included in Level 2 are U.S. agencies, non-U.S. government, corporate, mortgage-backed and asset-backed fixed maturity investments available for sale.
The Companys fixed maturity investments available for sale portfolio is priced using broker quotations and pricing services, such as index providers and pricing vendors. The pricing vendors provide pricing for a high volume of liquid securities that are actively traded. For securities that do not trade on an exchange, the pricing services utilize market data and other observable inputs in matrix pricing models to determine prices. Prices are generally verified using third party data. Prices obtained from broker quotations are considered non-binding, however they are based on observable inputs and by observing secondary trading of similar securities obtained from active, non-distressed markets. The Company considers these Level 2 inputs as they are corroborated with other externally obtained information.
Short term investments are considered Level 2 and fair values are generally determined using amortized cost which approximates fair value and, in certain cases, in a manner similar to the Companys fixed maturity investments available for sale noted above.
Other investments included in Level 2 are the Companys investments in hedge funds, catastrophe bonds, a non-U.S. dollar fixed income fund and a highly liquid bank loan fund. Included in Level 3 are the Companys private equity partnership investments and a senior secured bank loan fund. The majority of the Companys other investments included in Level 2 use net asset valuations provided by the investment manager, third party administrator, recent financial information or available market data to estimate fair value. In certain cases, managements judgment may also be required to estimate fair value. The fair value of private equity partnership investments is based on net asset values obtained from the investment
F-22
Table of Contents
manager or general partner of the respective entity. The type of underlying investments held by the investee which form the basis of the net asset valuation include assets such as private business ventures, for which the Company does not have access to, and as a result, is unable to corroborate the fair value measurement and therefore requires significant management judgment to determine the underlying value of the private equity partnership and accordingly the fair value of the Companys investment in each private equity partnership is considered Level 3. The Company also considers factors such as recent financial information, the value of capital transactions with the partnership and managements judgment regarding whether any adjustments should be made to the net asset value. The Company regularly reviews the performance of its private equity partnerships directly with the fund managers. The Companys investment in senior secured bank loan funds is valued using net asset valuations received from the investment manager. The investment manager relies on estimated valuations obtained from the individual bank loan funds. As these inputs are primarily based on significant judgment on the part of the investment manager, especially during the recent economic climate of limited trading activity and observable market inputs, the Company considers the fair value of its investment in senior secured bank loan funds to be determined using Level 3 inputs.
Below is a reconciliation of the beginning and ending balances of assets and liabilities measured at fair value on a recurring basis using Level 3 inputs. Interest and dividend income are included in net investment income and are excluded from the reconciliation.
| Fair Value Measurements Using Significant Unobservable Inputs (Level 3) |
||||||||||||
| Other investments (1) |
Other assets and (liabilities) (2) |
Total | ||||||||||
| Balance January 1 |
$ | 375,281 | $ | (9,950 | ) | $ | 365,331 | |||||
| Total unrealized (losses) gains |
||||||||||||
| Included in net investment income |
(132,901 | ) | 668 | (132,233 | ) | |||||||
| Included in other income |
(163 | ) | (9,703 | ) | (9,866 | ) | ||||||
| Total realized gains (losses) |
||||||||||||
| Included in net investment income |
4,844 | | 4,844 | |||||||||
| Included in other income |
| (13,545 | ) | (13,545 | ) | |||||||
| Total foreign exchange losses |
(1,603 | ) | (107 | ) | (1,710 | ) | ||||||
| Net purchases, issuances, and settlements |
136,622 | (9,875 | ) | 126,747 | ||||||||
| Net transfers in and/or out of Level 3 |
| | | |||||||||
| Balance December 31 |
$ | 382,080 | $ | (42,512 | ) | $ | 339,568 | |||||
| (1) | Other investments primarily include investments in private equity partnerships and a senior secured bank loan fund. |
| (2) | Balance at December 31, 2008 includes $10.3 million of other assets and $52.8 million of other liabilities. |
The Fair Value Option for Financial Assets and Financial Liabilities
Upon adoption of FAS 159, the Company elected the fair value option for certain assets and liabilities. These assets and liabilities were previously accounted for under applicable GAAP that resulted in a carrying value that approximated fair value, and as such, there were no material changes to the reported value of these assets and liabilities upon adoption. The Company has elected to use the guidance under FAS 159 for these assets and liabilities as FAS 159 represents the most current applicable GAAP. Below is a summary of the balances the Company has elected to account for under FAS 159:
|
December 31, 2008 |
January 1, 2008 |
|||||||
| Other investments |
$ | 773,475 | $ | 807,864 | ||||
| Other secured assets |
76,424 | 90,488 | ||||||
| Other assets and (liabilities) (1) |
$ | (11,209 | ) | $ | (6,402 | ) | ||
| (1) | Balance at December 31, 2008 includes $2.8 million of other assets and $14.0 million of other liabilities. Balance at January 1, 2008 includes $4.6 million of other assets and $11.0 million of other liabilities. |
F-23
Table of Contents
Included in net investment income for the year ended December 31, 2008 is $259.4 million of net unrealized losses related to the changes in fair value of other investments. Net unrealized gains (losses) related to the changes in the fair value of other secured assets and other assets and liabilities recorded in other income was $(2.5) million and $(0.1) million, respectively, for the year ended December 31, 2008.
Reinsurance Contracts Accounted for at Fair Value
The Company assumes and cedes reinsurance contracts that are accounted for at fair value. The fair value of these contracts is obtained through the use of internal valuation models. These contracts are recorded on the Companys balance sheet in other assets and other liabilities and totaled $2.8 million and $nil, respectively (2007 $4.6 million and $0.6 million, respectively). During 2008, the Company recorded losses of $9.3 million (2007 $36.8 million, 2006 $6.0 million) which are included in other loss and represents net settlements and changes in the fair value of these contracts.
NOTE 7. CEDED REINSURANCE
The Company has used reinsurance to manage its risk portfolio. The Company currently has in place contracts that provide for recovery from reinsurers of a portion of certain claims and claim expenses in excess of various retentions. Other than loss recoveries, certain of the Companys ceded reinsurance contracts also provide for recoveries of additional premiums, reinstatement premiums and lost no claims bonuses, which are incurred when losses are ceded to reinsurance contracts. The Company remains liable to the extent that any reinsurance company fails to meet its obligations.
The effect of reinsurance and retrocessional activity on premiums written and earned and on net claims and claim expenses incurred for the years ended December 31, 2008, 2007 and 2006 was as follows:
| Year ended December 31, |
2008 | 2007 | 2006 | |||||||||
| Premiums written |
||||||||||||
| Direct |
$ | 489,866 | $ | 416,642 | $ | 451,325 | ||||||
| Assumed |
1,246,162 | 1,392,995 | 1,492,322 | |||||||||
| Ceded |
(382,408 | ) | (374,302 | ) | (414,027 | ) | ||||||
| Net |
$ | 1,353,620 | $ | 1,435,335 | $ | 1,529,620 | ||||||
| Premiums earned |
||||||||||||
| Direct |
$ | 487,223 | $ | 453,729 | $ | 464,858 | ||||||
| Assumed |
1,301,906 | 1,370,997 | 1,402,109 | |||||||||
| Ceded |
(402,305 | ) | (400,357 | ) | (337,190 | ) | ||||||
| Net |
$ | 1,386,824 | $ | 1,424,369 | $ | 1,529,777 | ||||||
| Claims and claim expenses |
||||||||||||
| Gross claims and claim expenses incurred |
$ | 928,263 | $ | 563,758 | $ | 504,110 | ||||||
| Claims and claim expenses recovered |
(167,774 | ) | (84,484 | ) | (57,880 | ) | ||||||
| Net claims and claim expenses incurred |
$ | 760,489 | $ | 479,274 | $ | 446,230 | ||||||
The reinsurers with the three largest balances accounted for 26.6%, 18.2% and 8.1%, respectively, of the Companys losses recoverable balance at December 31, 2008 (2007 19.5%, 17.7% and 10.0%, respectively). At December 31, 2008, the Company had an $8.7 million valuation allowance against losses recoverable (2007 $8.9 million). The three largest company-specific components of the valuation allowance represented 40.5%, 23.0% and 9.6%, respectively, of the Companys total valuation allowance at December 31, 2008 (2007 39.4%, 22.5% and 10.5%).
F-24
Table of Contents
NOTE 8. OTHER SECURED ASSETS AND OTHER SECURED LIABILITIES
Other secured assets and other secured liabilities represent contractual rights and obligations under a purchase agreement, contingent purchase agreement and credit derivatives agreement (collectively, the Agreements) with a major bank to sell certain securities within the Companys catastrophe-linked securities portfolio (Cat-Linked Securities). Under the terms of the Agreements, the Company sold its ownership interest in Cat-Linked Securities with a par amount of $77.4 million to the bank for $77.4 million. The Agreements allow the Company to repurchase these securities at par and obligate the Company to repurchase the securities under certain circumstances including catastrophe triggering events and events of default. As a result of this transaction, the Company is receiving the spread over LIBOR on the $77.4 million of Cat-Linked Securities, less a financing fee.
The Company accounted for the sale of the Cat-Linked Securities under the Agreements as a secured borrowing with a pledge of collateral under the provisions of FASB Statement No. 140, Accounting for Transfers and Servicing of Financial Assets and Extinguishments of Liabilities (FAS 140), and accordingly recognized no gain or loss upon the transaction date. The credit derivatives agreement is accounted for at fair value with changes in fair value recognized in other income. As a result of the Agreements, the Company reclassified its previously recorded Cat-Linked Securities, recognized an asset which totaled $76.4 million at December 31, 2008, representing the fair value of the pledged collateral and credit derivatives agreement, and recognized a $77.4 million liability, representing its obligation to repurchase the Cat-Linked Securities at par. The Company recognized $2.2 million (2007 $2.0 million) of other income in its consolidated statements of operations in 2008 from this transaction, representing the spread over LIBOR less the financing fee on the Cat-Linked Securities for the year ended December 31, 2008, inclusive of the change in the fair value of the credit derivatives agreement.
Under the terms of the Agreements, the Company may sell other catastrophe-linked securities.
NOTE 9. RESERVE FOR CLAIMS AND CLAIM EXPENSES
The Company uses statistical and actuarial methods to estimate ultimate expected claims and claim expenses. The period of time from the reporting of a loss to the Company and the settlement of the Companys liability may be many years. During this period, additional facts and trends will be revealed. As these factors become apparent, case reserves will be adjusted, sometimes requiring an increase or decrease in the overall reserves of the Company, and at other times requiring a reallocation of incurred but not reported (IBNR) reserves to specific case reserves or additional case reserves. These estimates are reviewed regularly, and such adjustments, if any, are reflected in the results of operations in the period in which they become known and are accounted for as changes in estimates. Adjustments to the Companys claims and claim expense reserves can impact current year net income by increasing net income if the estimates of prior year claims and claim expense reserves prove to be overstated or by decreasing net income if the estimates of prior year claims and claim expense reserves prove to be insufficient.
The Companys estimates of claims and claim expenses are also based in part upon the estimation of claims resulting from natural and man-made disasters such as hurricanes, earthquakes, tsunamis, winter storms, terrorist attacks and other catastrophic events. Estimation by the Company of claims resulting from catastrophic events is inherently difficult because of the potential severity of property catastrophe claims. Additionally, the Company has recently increased its Individual Risk and specialty reinsurance premiums but does not have the benefit of a significant amount of its own historical experience in these lines. Therefore, the Company uses both proprietary and commercially available models, as well as historical reinsurance industry claims experience, for purposes of evaluating future trends and providing an estimate of ultimate claims costs.
F-25
Table of Contents
Activity in the liability for unpaid claims and claim expenses is summarized as follows:
| Year ended December 31, |
2008 | 2007 | 2006 | |||||||||
| Net reserves as of January 1 |
$ | 1,845,221 | $ | 1,796,301 | $ | 1,941,361 | ||||||
| Net incurred related to: |
||||||||||||
| Current year |
995,316 | 712,424 | 582,788 | |||||||||
| Prior years |
(234,827 | ) | (233,150 | ) | (136,558 | ) | ||||||
| Total net incurred |
760,489 | 479,274 | 446,230 | |||||||||
| Net paid related to: |
||||||||||||
| Current year |
346,845 | 125,816 | 139,268 | |||||||||
| Prior years |
397,787 | 304,538 | 452,022 | |||||||||
| Total net paid |
744,632 | 430,354 | 591,290 | |||||||||
| Total net reserves as of December 31 |
1,861,078 | 1,845,221 | 1,796,301 | |||||||||
| Losses recoverable as of December 31 |
299,534 | 183,275 | 301,854 | |||||||||
| Total gross reserves as of December 31 |
$ | 2,160,612 | $ | 2,028,496 | $ | 2,098,155 | ||||||
For the year ended December 31, 2008, the prior year favorable development of $234.8 million included $188.1 million attributable to the Companys Reinsurance segment and $46.7 million attributable to the Companys Individual Risk segment. Within the Companys Reinsurance segment, the catastrophe reinsurance unit experienced $131.6 million of favorable development on prior years estimated ultimate claim reserves, principally as a result of a comprehensive review of the Companys expected ultimate net losses associated with the 2005 hurricanes, Katrina, Rita and Wilma. The Companys specialty reinsurance unit, within the Reinsurance segment, and its Individual Risk segment experienced $56.5 million and $46.7 million, respectively, of favorable development in 2008. The favorable development within the specialty reinsurance unit and Individual Risk segment was principally driven by the application of formulaic actuarial reserving methodology for these books of business with the reductions being due to actual paid and reported loss activity being more favorable to date than what was originally anticipated when setting the initial IBNR reserves.
For the year ended December 31, 2007, the prior year favorable development of $233.2 million included $194.4 million attributable to the Companys Reinsurance segment and $38.8 million attributable to the Companys Individual Risk segment. Within the Companys Reinsurance segment, the catastrophe reinsurance unit experienced $93.1 million of favorable development on prior years estimated ultimate claim reserves, principally as a result of a reduction of the ultimate losses for the 2006 and 2005 accident years as reported claims have come in less than expected. Included in the 2005 accident year is a $19.2 million reduction in net claims and claim expenses associated with hurricanes Katrina, Rita and Wilma. The Companys specialty reinsurance unit experienced $101.3 million of favorable development in 2007. The favorable development within the Companys specialty reinsurance unit and Individual Risk segment was principally driven by the application of the Companys formulaic actuarial reserving methodology for these books of business with the reductions being due to actual paid and reported loss activity being better than what was anticipated when setting the initial IBNR reserves.
For the year ended December 31, 2006, the prior year favorable development of $136.6 million included $125.2 million attributable to the Companys Reinsurance segment and $11.3 million attributable to the Companys Individual Risk segment. The reduction in prior years estimated ultimate claim reserves in the Companys Reinsurance segment was primarily due to lower than expected claims emergence within the Companys specialty reinsurance unit. The Companys specialty reinsurance unit experienced $139.2 million of favorable development in 2006 while its catastrophe reinsurance unit experienced $13.9 million of adverse development. The favorable development within the Companys specialty reinsurance unit and Individual Risk segment was principally driven by the application of the Companys formulaic reserving methodology for these books of business with the reductions being due to actual paid and reported loss activity being better than what was anticipated when setting the initial IBNR reserves. In addition, within the Companys specialty reinsurance unit $46.0 million of the favorable development was driven by a reduction
F-26
Table of Contents
in carried reserves due to commutations. The adverse development in the Companys catastrophe reinsurance unit was principally driven by an increase in the Companys ultimate losses for a U.K. industrial property loss. This loss occurred at the end of 2005 and both the estimate of insured industry losses for the event and the Companys estimate of its clients losses from this event increased in 2006.
Net claims and claim expenses incurred were reduced by $1.9 million during 2008 (2007 $3.3 million, 2006 $5.5 million) related to income earned on assumed reinsurance contracts that were classified as deposit contracts with underwriting risk only. Other income was decreased by $1.9 million during 2008 (2007 $1.4 million, 2006 $1.0 million) related to premiums and losses incurred on assumed reinsurance contracts that were classified as deposit contracts with timing risk only. Aggregate deposit liabilities of $73.6 million are included in reinsurance balances payable at December 31, 2008 (2007 $84.1 million) and aggregate deposit assets of $nil are included in other assets at December 31, 2008 (2007 $nil) associated with these contracts.
NOTE 10. DEBT
In January 2003, the Company issued $100.0 million of 5.875% Senior Notes due February 15, 2013, with interest on the notes payable on February 15 and August 15 of each year. The notes can be redeemed by the Company prior to maturity subject to payment of a make-whole premium. The notes, which are senior obligations, contain various covenants, including limitations on mergers and consolidations, restrictions as to the disposition of the stock of designated subsidiaries and limitations on liens of the stock of designated subsidiaries. In July 2001, the Company issued $150.0 million of 7.0% Senior Notes which came due July 15, 2008. The notes were paid at maturity on July 15, 2008 using existing capital resources, as discussed below. At December 31, 2008, the fair value of the 5.875% Senior Notes was $93.3 million (2007 $101.3 million).
During April 2006, DaVinciRe amended and restated its credit agreement to, among other things, (i) extend the termination date of the revolving credit facility established thereunder from May 25, 2010 to April 5, 2011; (ii) increase the borrowing capacity to $200.0 million; and (iii) increase the minimum net worth requirement with respect to DaVinciRe and DaVinci by $100.0 million to $350.0 million and $450.0 million, respectively. All other material terms and conditions in the credit agreement remained the same, including the requirement that DaVinciRe maintain a debt to capital ratio of 30% or below. At December 31, 2008, $200.0 million remained outstanding. Interest rates on the facility are based on a spread above LIBOR, and averaged approximately 4.3% during 2008 (2007 6.0%). The term of the credit facility may be further extended and the size of the facility may be increased to $250.0 million if certain conditions are met. Neither RenaissanceRe nor Renaissance Reinsurance is a guarantor of this facility and the lenders have no recourse against the Company or its subsidiaries other than DaVinciRe and its subsidiary under the DaVinciRe facility. Pursuant to the terms of the $500.0 million revolving credit facility maintained by RenaissanceRe, a default by DaVinciRe on its obligations will not result in a default under the RenaissanceRe facility.
During August 2004, the Company amended and restated its committed revolving credit agreement to (i) increase the facility from $400.0 million to $500.0 million, (ii) extend the term to August 6, 2009 and (iii) make certain other changes. On July 10, 2008, the Company borrowed $150.0 million available under this facility to pay at maturity its 7.0% Senior Notes which came due on July 15, 2008. At December 31, 2008, the $150.0 million borrowed under this facility remains outstanding. Interest rates on the facility are based on a spread above LIBOR and averaged 4.2% during 2008. As amended, the agreement contains certain covenants, including financial covenants. These covenants generally provide that consolidated debt to capital shall not exceed the ratio (the Debt to Capital Ratio) of 0.35:1 and that the consolidated net worth (the Net Worth Requirements) of RenaissanceRe and Renaissance Reinsurance shall equal or exceed $1.0 billion and $500.0 million, respectively, subject to certain adjustments under certain circumstances in the case of the Debt to Capital Ratio and certain grace periods in the case of the Net Worth requirements, all as more fully set forth in the agreement. The Company has the right, subject to certain conditions, to increase the size of this facility to $600.0 million.
F-27
Table of Contents
Interest paid on the above debt (and to the Capital Trust in 2007 and 2006) totaled $28.2 million, $35.5 million and $36.8 million for the years ended December 31, 2008, 2007 and 2006, respectively.
NOTE 11. VARIABLE INTEREST ENTITIES
Subordinated Obligation to Capital Trust
In March 1997, the Company issued $100.0 million aggregate liquidation amount of mandatorily redeemable capital securities (Capital Securities) through a subsidiary trust holding solely $103.1 million of the Companys 8.54% junior subordinated debentures due March 1, 2027. The Capital Securities paid cumulative cash distributions at an annual rate of 8.54%, payable semi-annually. The Capital Trust is a wholly owned subsidiary of the Company and was consolidated into the Companys consolidated financial statements up until the Companys adoption of FIN 46(R) at December 31, 2003. The Companys guarantee of the distributions on the Capital Securities issued by the Capital Trust, when taken together with the Companys obligations under an expense reimbursement agreement with the Capital Trust, provided full and unconditional guarantee of amounts due on the Capital Securities issued by the Capital Trust.
Upon the adoption of FIN 46(R) at December 31, 2003, the Capital Trust was determined to be a variable interest entity and the Company was determined not to be the primary beneficiary of the Capital Trust. Accordingly, the Capital Trust was deconsolidated from the Companys consolidated financial statements at December 31, 2003. As a result, the balance of the Capital Securities, previously classified as minority interest, were classified as a liability. In addition, equity interests in the Capital Trust and purchased Capital Securities held by the Company were included in the Companys investments. These investments included $15.4 million of Capital Securities purchased by the Company and $3.1 million of common stock issued by the Capital Trust to the Company in March 1997.
On January 25, 2007, the Capital Trust called for redemption, all of the outstanding Capital Securities which it did not then own, concurrent with the redemption by the Company of the underlying 8.54% junior subordinated debentures of the Company, which were the sole asset held by the Capital Trust. The redemption price for such Capital Securities was $1,042.70 per security plus accrued and unpaid dividends thereon, up to but excluding, the redemption date. The redemption of the Capital Securities occurred on March 1, 2007, the redemption date. The aggregate redemption price was $91.9 million.
Timicuan Reinsurance Ltd.
On June 1, 2006, Tim Re, a wholly owned subsidiary of the Company, sold $49.5 million of non-voting Class B shares to external investors to provide Tim Re with additional capacity to accept property catastrophe excess of loss reinsurance business. Tim Re is a Class 3 Bermuda domiciled reinsurer. The Company ceded a defined portfolio of property catastrophe excess of loss reinsurance contracts incepting June 1, 2006 to Tim Re under a fully-collateralized reinsurance contract in return for an underwriting profit commission. The Class B shareholders participated in substantially all of the profits or losses of Tim Re while the Class B shares remained outstanding. The Class B shares indemnify Tim Re against losses relating to insurance risk and therefore these shares have been accounted for as prospective reinsurance under FASB Statement No. 113, Accounting and Reporting for Reinsurance of Short-Duration and Long-Duration Contracts. The sale of the Class B shares was considered a reconsideration event under FIN 46(R). In accordance with the provisions of FIN 46(R), Tim Re was considered a variable interest entity and the Company was considered the primary beneficiary. As a result, Tim Re was consolidated by the Company and all significant inter-company transactions have been eliminated. The Class B share capital was invested by Tim Re in short term investments and pledged as collateral to the Company in support of obligations arising under the reinsurance contract. Tim Re was required to repurchase the Class B shares subsequent to the end of the exposure period. The Company ceded $27.5 million of premium to Tim Re under an auto facultative retrocessional excess of loss reinsurance contract through December 31, 2006. Effective January 1, 2007, the Company repurchased all of the outstanding Class B shares for $67.6 million, net of a $3.0 million holdback. The $3.0 million holdback has since been settled. Subsequent to the repurchase of the Class B shares by the Company, Tim Re remains a consolidated subsidiary, but is no longer considered a variable interest entity.
F-28
Table of Contents
NOTE 12. MINORITY INTEREST
In October 2001, the Company formed DaVinciRe and DaVinci with other equity investors. RenaissanceRe owns a minority economic interest in DaVinciRe; however, because RenaissanceRe controls a majority of DaVinciRes outstanding voting rights, the consolidated financial statements of DaVinciRe are included in the consolidated financial statements of the Company. The portion of DaVinciRes earnings owned by third parties for the years ended December 31, 2008, 2007 and 2006 is recorded in the consolidated statements of operations as minority interest.
Effective December 31, 2005, DaVinciRe raised $320.6 million of equity capital from new and existing investors, including $50.0 million contributed by the Company. The Companys ownership in DaVinciRe was 19.7% at December 31, 2005. Effective January 1, 2006, the Company purchased the shares of one of DaVinciRes original shareholders for $15.4 million, subject to a true-up for development on outstanding loss reserves after the settlement of all claims relating to the applicable years; increasing the Companys economic ownership to 22.3%. In addition, on February 1, 2006, DaVinciRe raised an additional $53.9 million of equity capital, diluting the Companys economic ownership interest to 20.5% for the remainder of 2006 and 2007. The Company continues to maintain majority voting control of DaVinciRe and, accordingly, will continue consolidating the results of DaVinciRe into the Companys consolidated results of operations and financial position.
In conjunction with the capital raise, the Company and other DaVinciRe shareholders entered into the second amended and restated shareholders agreement, which provides the shareholders, excluding the Company, with certain redemption rights such as allowing each shareholder to notify DaVinciRe of their desire for DaVinciRe to repurchase up to half of their aggregate number of shares held. Any share repurchases are subject to certain limitations such as limiting the aggregate of all share repurchase requests to 25% of DaVinciRes capital in any given year and subject to ensuring all applicable legal and regulatory requirements are met. If the total shareholder requests exceed 25% of DaVinciRes capital, the number of shares repurchased will be reduced among the requesting shareholders pro-rata, based on the amounts desired to be repurchased. Shareholders must notify DaVinciRe before March 1 of each year, commencing March 1, 2007, if they desire to have DaVinciRe repurchase shares. The redemption rights repurchase price will be GAAP book value as of the end of the year in which the shareholder notice is given, and the repurchase will be effective as of such date. Payment will be made by April 1 of the following year, following delivery of the audited financial statements for the year in which the repurchase was effective. The repurchase price will be subject to adjustment in future periods for development on outstanding loss reserves after settlement of all claims relating to the applicable years.
On December 31, 2007, the Company, acting in the capacity of an intermediary, purchased the shares of a third party DaVinciRe shareholder for $43.5 million, at GAAP book value as of December 31, 2007. Subsequently, on January 1, 2008, the Company sold these shares to two existing third party DaVinciRe shareholders for $43.5 million. At December 31, 2007, the Company had a receivable and payable of $43.5 million and $3.5 million, respectively, related to this transaction, which are reflected in other assets and other liabilities, respectively. The Companys 20.5% ownership interest at December 31, 2007 excludes the impact of this transaction.
Certain shareholders of DaVinciRe put in repurchase notices on or before the March 1, 2008 repurchase notice date. The repurchase notice was for shares with a GAAP book value of $145.5 million at December 31, 2008. On January 30, 2009, the Company on behalf of DaVinciRe purchased the shares for $145.5 million, less a $21.8 million reserve holdback. The Companys ownership interest in DaVinciRe increased from 22.8% at December 31, 2008, to 37.6%. as a result of these purchases.
F-29
Table of Contents
NOTE 13. SHAREHOLDERS EQUITY
The aggregate authorized capital of the Company is 325 million shares consisting of 225 million common shares and 100 million preference shares.
The following table is a summary of changes in common shares issued and outstanding:
| Year ended December 31, |
2008 | 2007 | 2006 | |||||
| (thousands of shares) | ||||||||
| Issued and outstanding shares January 1 |
68,920 | 72,140 | 71,523 | |||||
| Shares repurchased |
(8,064 | ) | (3,588 | ) | | |||
| Exercise of options and issuance of restricted stock awards |
647 | 368 | 617 | |||||
| Issued and outstanding shares December 31 |
61,503 | 68,920 | 72,140 | |||||
On August 7, 2003, the Board authorized a share repurchase program of $150.0 million. On August 15, 2007, the Board of Directors increased the Companys share repurchase program to $500.0 million from the original amount authorized on August 7, 2003. On May 20, 2008, the Board of Directors authorized an additional increase in the Companys share repurchase program to $500.0 million, which included the remaining amounts available under the August 2007 authorization. The Companys decision to repurchase common shares will depend on, among other matters, the market price of the common shares and the capital requirements of the Company. During 2008, $428.4 million of shares (2007 $200.1 million, 2006 $nil) were repurchased under this program. Common shares repurchased by the Company are normally cancelled and retired. At December 31, 2008, $382.4 million remained available for repurchase under the Board authorized share repurchase program.
In December 2006, the Company raised $300.0 million through the issuance of 12 million Series D Preference Shares at $25 per share; in March 2004, the Company raised $250.0 million through the issuance of 10 million Series C Preference Shares at $25 per share and in February 2003, the Company raised $100.0 million through the issuance of 4 million Series B Preference Shares at $25 per share; and in November 2001, the Company raised $150.0 million through the issuance of 6 million Series A Preference Shares at $25 per share. The Series D, Series C and Series B Preference Shares may be redeemed at $25 per share at the Companys option on or after December 1, 2011, March 23, 2009 and February 4, 2008, respectively. Dividends on the Series D, Series C and Series B Preference Shares are cumulative from the date of original issuance and are payable quarterly in arrears at 6.60% 6.08% and 7.30% respectively, when, if, and as declared by the Board of Directors. If the Company submits a proposal to its shareholders concerning an amalgamation or submits any proposal that, as a result of any changes to Bermuda law, requires approval of the holders of these preference shares to vote as a single class, the Company may redeem the Series D, Series C and Series B Preference Shares prior to December 1, 2011, March 23, 2009 and February 4, 2008, respectively, at $26 per share. The preference shares have no stated maturity and are not convertible into any other securities of the Company. Generally, the preference shares have no voting rights. Whenever dividends payable on the preference shares are in arrears (whether or not such dividends have been earned or declared) in an amount equivalent to dividends for six full dividend periods (whether or not consecutive), the holders of the preference shares, voting as a single class regardless of class or series, will have the right to elect two directors to the Board of Directors of the Company. During 2008, the Company declared and paid $42.3 million in preference share dividends (2007 $42.9 million, 2006 $34.7 million).
On December 15, 2006, the Company gave redemption notices to the holders of the Series A Preference Shares to redeem such shares for $25 per share. All of the Series A Preferences Shares were redeemed for $150.0 million plus accrued and unpaid dividends thereon.
F-30
Table of Contents
NOTE 14. EARNINGS PER SHARE
The Company accounts for its weighted average shares in accordance with FASB Statement No. 128, Earnings per Share (FAS 128). The numerator in both the Companys basic and diluted earnings per share calculations is identical. The following table sets forth the reconciliation of the denominator from basic to diluted weighted average shares outstanding:
| Year ended December 31, |
2008 | 2007 | 2006 | |||
| (thousands of shares) | ||||||
| Weighted average shares basic |
62,531 | 70,520 | 71,064 | |||
| Per share equivalents of employee stock options and restricted shares |
880 | 1,305 | 1,009 | |||
| Weighted average shares diluted (1) |
63,411 | 71,825 | 72,073 | |||
| (1) | In accordance with FAS 128, earnings per share calculations use average common shares outstanding basic, when in a net loss position. |
NOTE 15. RELATED PARTY TRANSACTIONS AND MAJOR CUSTOMERS
The Company has entered into reinsurance agreements with certain subsidiaries and affiliates of Tower Hill and has also entered into reinsurance agreements with respect to business produced by Tower Hill Insurance. These reinsurance agreements included excess of loss reinsurance and four net retained personal property quota share agreements for 2008 and 2007. For the year ended December 31, 2008, the Company recorded $57.3 million (2007 $118.6 million) of gross premium written assumed from Tower Hill and its subsidiaries and affiliates related to the above mentioned contracts. Gross premiums written assumed from Tower Hill in 2007 included $65.6 million related to the portfolio transfer of the business from Tower Hill to the Company effective June 1, 2007. Gross premiums earned totaled $78.0 million (2007 $71.6 million) and expenses incurred were $29.2 million (2007 $20.3 million) for the year ended December 31, 2008 related to these contracts. The Company had a net related outstanding receivable balance of $17.0 million as of December 31, 2008 (2007 $17.4 million).
During 2008, the Company purchased $3.5 million of intangible assets from a current employee of the Company, including rights, title and interest in and to patents and patent technologies, inventions and trade names. These intangible assets were owned by the employee. As part of the purchase agreement, the Company paid a set price and agreed to pay additional amounts upon successful licensing, sale, or certain other monetization by the Company of the inventions.
During 2008, the Company invested $6.0 million in Angus Partners LLC (Angus), representing a 40% equity interest, which is accounted for under the equity method of accounting. Angus provides weather-centric risk management products, with a particular focus on weather exposed commodity price risk to third party customers. The Company had an outstanding liability position of $38.8 million at December 31, 2008 related to certain derivative trades with Angus. For the year ended December 31, 2008, the Company incurred an other loss of $39.4 million related to these trades.
During 2008, the Company received distributions from Top Layer Re of $15.1 million (2007 $12.8 million), and a management fee of $3.5 million (2007 $2.6 million). The management fee reimburses the Company for services it provides to Top Layer Re.
The Company provides ChannelRe with various administrative services. As a result of ChannelRes net loss for 2007 and resulting negative shareholders equity position at December 31, 2007, the Company reversed its accrual for profit-based administrative services, resulting in a loss of $2.4 million. For 2008, ChannelRe continued to have a negative shareholders equity position at December 31, 2008 and as a result the Company recorded profit-based administrative services income of $nil. The Company had an outstanding receivable from ChannelRe of $nil million as of December 31, 2008 (2007 $nil) related to the administrative services noted above.
During the years ended December 31, 2008, 2007 and 2006, the Company received 88.6%, 91.8% and 90.1%, respectively, of its Reinsurance segment premium assumed from four brokers. Subsidiaries and affiliates of the Benfield Group Limited (Benfield), Marsh Inc., AON Corporation (AON) and the Willis
F-31
Table of Contents
Group accounted for approximately 48.3%, 18.2%, 13.2% and 8.9%, respectively, of gross premiums written for the Reinsurance segment in 2008. During November 2008, AON acquired Benfield, resulting in the combined entity accounting for 61.5% of the Companys Reinsurance segment gross premiums written in 2008.
NOTE 16. DIVIDENDS
Dividends declared and paid on Common Shares amounted to $0.92, $0.88 and $0.84 per common share for the years ended December 31, 2008, 2007 and 2006, respectively.
The total amount of dividends paid to holders of the common shares during 2008, 2007 and 2006 was $57.9 million, $62.6 million and $60.4 million, respectively.
NOTE 17. TAXATION
Under current Bermuda law, the Company and its Bermuda subsidiaries are not subject to any income or capital gains taxes. In the event that such taxes are imposed, the Company and its Bermuda subsidiaries would be exempted from any such tax until March 2016 pursuant to the Bermuda Exempted Undertakings Tax Protection Act of 1966, and Amended Act of 1987.
Glencoe U.S. Holdings Inc. (Glencoe U.S.) and its subsidiaries are subject to income taxes imposed by U.S. Federal and state authorities and file a consolidated U.S. tax return. Should the U.S. subsidiaries pay a dividend to the Company, withholding taxes would apply to the extent of current year or accumulated earnings and profits. The Company also has operations in Ireland which are also subject to income taxes imposed by the jurisdiction in which they operate.
The Company is not subject to income taxation other than as stated above. There can be no assurance that there will not be changes in applicable laws, regulations or treaties, which might require the Company to change the way it operates or become subject to taxation.
Income tax benefit (expense) for 2008, 2007 and 2006 is comprised as follows:
| Year ended December 31, 2008 |
Current | Deferred | Total | |||||||||
| Total income tax benefit (expense) |
$ | 107 | $ | (675 | ) | $ | (568 | ) | ||||
| Year ended December 31, 2007 |
||||||||||||
| Total income tax (expense) benefit |
$ | (385 | ) | $ | 18,817 | $ | 18,432 | |||||
| Year ended December 31, 2006 |
||||||||||||
| Total income tax expense |
$ | (935 | ) | $ | | $ | (935 | ) | ||||
The Companys expected income tax provision computed on pre-tax income at the weighted average tax rate has been calculated as the sum of the pre-tax income in each jurisdiction multiplied by that jurisdictions applicable statutory tax rate. A reconciliation of the difference between the provision for income taxes and the expected tax provision at the weighted average tax rate for the years ended December 31, 2008 and 2007 is as follows:
| Year ended December 31, |
2008 | 2007 | ||||||
| Expected income tax benefit (expense) |
$ | 468 | $ | (7,514 | ) | |||
| Change in valuation allowance |
1,702 | 25,845 | ||||||
| Non-deductible expenses |
(168 | ) | (54 | ) | ||||
| Transfer pricing adjustments |
(1,908 | ) | | |||||
| Other |
(662 | ) | 155 | |||||
| Income tax (expense) benefit |
$ | (568 | ) | $ | 18,432 | |||
F-32
Table of Contents
The tax effects of temporary differences that give rise to significant portions of the deferred tax assets and deferred tax liabilities are presented below:
| At December 31, |
2008 | 2007 | ||||||
| Deferred tax assets |
||||||||
| Net operating loss carryforwards |
$ | 15,603 | $ | 9,026 | ||||
| Unearned premium adjustment |
4,937 | 4,240 | ||||||
| Claims reserves, principally due to discounting for tax |
4,567 | 4,691 | ||||||
| Intangible assets |
2,145 | 913 | ||||||
| Accrued expenses |
3,347 | 4,574 | ||||||
| Investments |
| 461 | ||||||
| Other |
2,163 | 2,586 | ||||||
| 32,762 | 26,491 | |||||||
| Deferred tax liabilities |
||||||||
| Deferred acquisition costs |
(3,775 | ) | (4,741 | ) | ||||
| Investments |
(10,643 | ) | | |||||
| (14,418 | ) | (4,741 | ) | |||||
| Net deferred tax asset before valuation allowance |
18,344 | 21,750 | ||||||
| Valuation allowance |
(1,383 | ) | (3,085 | ) | ||||
| Net deferred tax asset |
$ | 16,961 | $ | 18,665 | ||||
During 2008, the Company recorded net reductions to the valuation allowance of $1.7 million. The Companys deferred tax asset relates primarily to net operating loss carryforwards and book-tax differences relating to unearned premium reserves, loss reserves, accrued expenses and intangible assets. Net operating loss carryforwards are available to offset future taxes payable by the Companys U.S. subsidiaries. Although the net operating losses, which gave rise to a deferred tax asset, have a carryforward period through 2027, the Companys U.S. operations generated cumulative taxable income for the three year period ending December 31, 2008. In addition, the Company expects its U.S. tax-paying subsidiaries will continue to generate taxable income in future periods. Accordingly, the Company believes that it is more likely than not that the U.S. deferred tax asset will be realized and therefore the U.S. valuation allowance was reduced in its entirety in 2008. The remaining valuation allowance at December 31, 2008 relates exclusively to net operating loss carryforwards in the Companys operations in Ireland.
Net operating loss carryforwards of $40.6 million (2007 $48.9 million) are available to offset regular taxable U.S. income during the carryforward period. Under applicable law, the U.S. net operating losses expire between 2020 and 2027. All net operating losses for tax years prior to 2000 have been fully utilized. In addition, the Company has an alternative minimum tax (AMT) credit carryforward of $1.0 million which can be carried forward indefinitely. In Ireland, the Company has net operating loss carryforwards of $11.0 million. Under applicable law, the Irish net operating losses carryforward for an indefinite period.
The Company paid U.S. federal and Irish income taxes of $0.3 million, $0.7 million and $0.6 million in the years ended December 31, 2008, 2007 and 2006, respectively.
The Company had no unrecognized tax benefits upon adoption of FIN 48 and has no unrecognized tax benefits as of December 31, 2008. Tax years ending December 31, 2005 through December 31, 2007 are open for examination by the Internal Revenue Service.
F-33
Table of Contents
NOTE 18. GEOGRAPHIC INFORMATION
The following is a summary of the Companys gross premiums written allocated to the territory of coverage exposure:
| Year ended December 31, |
2008 | 2007 | 2006 | ||||||
| Property catastrophe |
|||||||||
| United States and Caribbean |
$ | 745,016 | $ | 735,322 | $ | 792,311 | |||
| Worldwide (excluding U.S.) (1) |
75,489 | 66,392 | 71,116 | ||||||
| Europe |
72,153 | 111,702 | 73,500 | ||||||
| Worldwide |
67,371 | 27,577 | 68,575 | ||||||
| Australia and New Zealand |
5,455 | 4,360 | 2,732 | ||||||
| Other |
23,465 | 20,374 | 23,972 | ||||||
| Specialty reinsurance (2) |
159,770 | 287,316 | 222,049 | ||||||
| Total Reinsurance (3) |
1,148,719 | 1,253,043 | 1,254,255 | ||||||
| Individual Risk (4) |
587,309 | 556,594 | 689,392 | ||||||
| Total gross written premium |
$ | 1,736,028 | $ | 1,809,637 | $ | 1,943,647 | |||
| (1) | The category Worldwide (excluding U.S.) consists of contracts that cover more than one geographic region (other than the U.S.). The exposure in this category for gross written premiums to date is predominantly from Europe and Japan. |
| (2) | The category specialty reinsurance consists of contracts that are predominantly exposed to U.S. risks, with a small portion of the risks being Worldwide. |
| (3) | Excludes $5.7 million, $37.4 million and $66.9 million of premium assumed from the Individual Risk segment for the years ended December 31, 2008, 2007 and 2006, respectively. |
| (4) | The category Individual Risk consists of contracts that are primarily exposed to U.S. risks. |
NOTE 19. SEGMENT REPORTING
The Company has two reportable segments: Reinsurance and Individual Risk.
The Reinsurance segment consists of: 1) property catastrophe reinsurance, primarily written through Renaissance Reinsurance and DaVinci; 2) specialty reinsurance, primarily written through Renaissance Reinsurance and DaVinci; and 3) certain other activities of ventures as described herein. The Reinsurance segment is managed by the President of Renaissance Reinsurance, who leads a team of underwriters, risk modelers and other industry professionals, who have access to the Companys proprietary risk management, underwriting and modeling resources and tools.
The Individual Risk segment includes underwriting that involves understanding the characteristics of the original underlying insurance policy. The Companys Individual Risk segment is managed by the Chief Executive Officer of the Glencoe Group. The Individual Risk segment currently provides insurance written on both an admitted basis and an excess and surplus lines basis, and also provides reinsurance on a quota share basis.
The Company does not manage its assets by segment and therefore total assets are not allocated to the segments.
F-34
Table of Contents
Data for the years ended December 31, 2008, 2007 and 2006 is as follows:
| Year ended December 31, 2008 |
Reinsurance | Individual Risk |
Eliminations (1) | Other | Total | |||||||||||||||
| Gross premiums written |
$ | 1,154,391 | $ | 587,309 | $ | (5,672 | ) | $ | | $ | 1,736,028 | |||||||||
| Net premiums written |
$ | 871,893 | $ | 481,727 | | $ | 1,353,620 | |||||||||||||
| Net premiums earned |
$ | 909,759 | $ | 477,065 | | $ | 1,386,824 | |||||||||||||
| Net claims and claim expenses incurred |
440,900 | 319,589 | | 760,489 | ||||||||||||||||
| Acquisition expenses |
105,437 | 108,116 | | 213,553 | ||||||||||||||||
| Operational expenses |
81,797 | 40,368 | | 122,165 | ||||||||||||||||
| Underwriting income |
$ | 281,625 | $ | 8,992 | | 290,617 | ||||||||||||||
| Net investment income |
24,231 | 24,231 | ||||||||||||||||||
| Equity in earnings of other ventures |
13,603 | 13,603 | ||||||||||||||||||
| Other income |
10,252 | 10,252 | ||||||||||||||||||
| Interest and preference share dividends |
(66,933 | ) | (66,933 | ) | ||||||||||||||||
| Minority interest DaVinciRe |
(55,133 | ) | (55,133 | ) | ||||||||||||||||
| Other items, net |
(23,603 | ) | (23,603 | ) | ||||||||||||||||
| Net realized losses on investments |
(206,314 | ) | (206,314 | ) | ||||||||||||||||
| Net (loss) income (attributable) available to common shareholders |
$ | (303,897 | ) | $ | (13,280 | ) | ||||||||||||||
| Net claims and claim expenses incurred current accident year |
$ | 629,022 | $ | 366,294 | $ | 995,316 | ||||||||||||||
| Net claims and claim expenses incurred prior accident years |
(188,122 | ) | (46,705 | ) | (234,827 | ) | ||||||||||||||
| Net claims and claim expenses incurred total |
$ | 440,900 | $ | 319,589 | $ | 760,489 | ||||||||||||||
| Net claims and claim expense |
69.1 | % | 76.8 | % | 71.8 | % | ||||||||||||||
| Net claims and claim expense |
(20.6 | %) | (9.8 | %) | (17.0 | %) | ||||||||||||||
| Net claims and claim expense |
48.5 | % | 67.0 | % | 54.8 | % | ||||||||||||||
| Underwriting expense ratio |
20.5 | % | 31.1 | % | 24.2 | % | ||||||||||||||
| Combined ratio |
69.0 | % | 98.1 | % | 79.0 | % | ||||||||||||||
| (1) | Represents premium ceded from the Individual Risk segment to the Reinsurance segment. |
F-35
Table of Contents
| Year ended December 31, 2007 |
Reinsurance | Individual Risk |
Eliminations (1) | Other | Total | |||||||||||||||
| Gross premiums written |
$ | 1,290,420 | $ | 556,594 | $ | (37,377 | ) | $ | | $ | 1,809,637 | |||||||||
| Net premiums written |
$ | 1,024,493 | $ | 410,842 | | $ | 1,435,335 | |||||||||||||
| Net premiums earned |
$ | 957,661 | $ | 466,708 | | $ | 1,424,369 | |||||||||||||
| Net claims and claim expenses incurred |
241,118 | 238,156 | | 479,274 | ||||||||||||||||
| Acquisition expenses |
119,915 | 135,015 | | 254,930 | ||||||||||||||||
| Operational expenses |
67,969 | 42,495 | | 110,464 | ||||||||||||||||
| Underwriting income |
$ | 528,659 | $ | 51,042 | | 579,701 | ||||||||||||||
| Net investment income |
402,463 | 402,463 | ||||||||||||||||||
| Equity in losses of other ventures |
(128,609 | ) | (128,609 | ) | ||||||||||||||||
| Other loss |
(37,930 | ) | (37,930 | ) | ||||||||||||||||
| Interest and preference share dividends |
(76,487 | ) | (76,487 | ) | ||||||||||||||||
| Minority interest DaVinciRe |
(164,396 | ) | (164,396 | ) | ||||||||||||||||
| Other items, net |
(6,460 | ) | (6,460 | ) | ||||||||||||||||
| Net realized losses on investments |
1,293 | 1,293 | ||||||||||||||||||
| Net income available to common shareholders |
$ | (10,126 | ) | $ | 569,575 | |||||||||||||||
| Net claims and claim expenses incurred current accident year |
$ | 435,495 | $ | 276,929 | $ | 712,424 | ||||||||||||||
| Net claims and claim expenses incurred prior accident years |
(194,377 | ) | (38,773 | ) | (233,150 | ) | ||||||||||||||
| Net claims and claim expenses incurred total |
$ | 241,118 | $ | 238,156 | $ | 479,274 | ||||||||||||||
| Net claims and claim expense ratio current accident year |
45.5 | % | 59.3 | % | 50.0 | % | ||||||||||||||
| Net claims and claim expense ratio prior accident years |
(20.3 | %) | (8.3 | %) | (16.4 | %) | ||||||||||||||
| Net claims and claim expense ratio calendar year |
25.2 | % | 51.0 | % | 33.6 | % | ||||||||||||||
| Underwriting expense ratio |
19.6 | % | 38.1 | % | 25.7 | % | ||||||||||||||
| Combined ratio |
44.8 | % | 89.1 | % | 59.3 | % | ||||||||||||||
| (1) | Represents premium ceded from the Individual Risk segment to the Reinsurance segment. |
F-36
Table of Contents
| Year ended December 31, 2006 |
Reinsurance |
Individual Risk |
Eliminations (1) | Other | Total | |||||||||||||||
| Gross premiums written |
$ | 1,321,163 | $ | 689,392 | $ | (66,908 | ) | $ | | $ | 1,943,647 | |||||||||
| Net premiums written |
$ | 1,039,103 | $ | 490,517 | | $ | 1,529,620 | |||||||||||||
| Net premiums earned |
$ | 972,017 | $ | 557,760 | | $ | 1,529,777 | |||||||||||||
| Net claims and claim expenses incurred |
148,052 | 298,178 | | 446,230 | ||||||||||||||||
| Acquisition expenses |
115,324 | 165,373 | | 280,697 | ||||||||||||||||
| Operational expenses |
72,405 | 37,181 | | 109,586 | ||||||||||||||||
| Underwriting income |
$ | 636,236 | $ | 57,028 | | 693,264 | ||||||||||||||
| Net investment income |
318,106 | 318,106 | ||||||||||||||||||
| Equity in earnings of other ventures |
34,528 | 34,528 | ||||||||||||||||||
| Other loss |
(3,917 | ) | (3,917 | ) | ||||||||||||||||
| Interest and preference share dividends |
(73,077 | ) | (73,077 | ) | ||||||||||||||||
| Minority interest DaVinciRe |
(144,159 | ) | (144,159 | ) | ||||||||||||||||
| Other items, net |
(28,646 | ) | (28,646 | ) | ||||||||||||||||
| Net realized losses on investments |
(34,464 | ) | (34,464 | ) | ||||||||||||||||
| Net income available to common shareholders |
$ | 68,371 | $ | 761,635 | ||||||||||||||||
| Net claims and claim expenses incurred current accident year |
$ | 273,286 | $ | 309,502 | $ | 582,788 | ||||||||||||||
| Net claims and claim expenses incurred prior accident years |
(125,234 | ) | (11,324 | ) | (136,558 | ) | ||||||||||||||
| Net claims and claim expenses incurred total |
$ | 148,052 | $ | 298,178 | $ | 446,230 | ||||||||||||||
| Net claims and claim expense ratio current accident year |
28.1 | % | 55.5 | % | 38.1 | % | ||||||||||||||
| Net claims and claim expense ratio prior accident years |
(12.9 | %) | (2.0 | %) | (8.9 | %) | ||||||||||||||
| Net claims and claim expense ratio calendar year |
15.2 | % | 53.5 | % | 29.2 | % | ||||||||||||||
| Underwriting expense ratio |
19.3 | % | 36.3 | % | 25.5 | % | ||||||||||||||
| Combined ratio |
34.5 | % | 89.8 | % | 54.7 | % | ||||||||||||||
| (1) | Represents premium ceded from the Individual Risk segment to the Reinsurance segment. |
NOTE 20. STOCK INCENTIVE COMPENSATION AND EMPLOYEE BENEFIT PLANS
The Company has a stock incentive plan (the 2001 Stock Incentive Plan) under which all employees of the Company and its subsidiaries may be granted stock options and restricted stock awards. A stock option award under the Companys 2001 Stock Incentive Plan generally allows for the purchase of the Companys common shares at a price that is equal to the fair market value of the Companys common shares as of the grant effective date. Options to purchase common shares are granted periodically by the Board of Directors, generally vest over four years and generally expire ten years from the date of grant. Restricted common shares are granted periodically by the Board of Directors and generally vest ratably over a four or five year period. In addition, awards granted under the Companys prior 1993 stock incentive plan remain outstanding, with terms similar to the 2001 Stock Incentive Plan. The Company has also established a Non-Employee Director Stock Incentive Plan to issue stock options and shares of restricted stock to the Companys non-employee directors.
F-37
Table of Contents
The Companys 2001 Stock Incentive Plan also allows for the issuance of share-based awards, the issuance of restricted common shares and shares tendered in connection with option exercises. For purposes of determining the number of shares reserved for issuance under the 2001 Stock Plan, shares tendered to or withheld by the Company in connection with certain option exercises will again be available for issuance.
In August 2004, the Companys shareholders approved the RenaissanceRe Holdings Ltd. 2004 Stock Option Incentive Plan (the Premium Option Plan) under which 6.0 million common shares were reserved for issuance upon the exercise of options granted under the Premium Option Plan. On August 15, 2007, the Company terminated the Premium Option Plan, such that no further option grants will be made thereunder. However, options outstanding at the time of the termination will, unless otherwise subsequently amended pursuant to the terms of the Premium Option Plan, remain outstanding and unmodified until they expire, subject to the terms of the Premium Option Plan and any applicable award agreement. The Premium Option Plan provides for, among other things, mandatory premium pricing such that options can generally only be issued thereunder with a strike price at a minimum of 150% of the fair market value on the date of grant, minimum 5-year cliff vesting (subject to waiver by the compensation committee of the Board of Directors), and no discretionary repricing. The Premium Option Plan includes a dividend protection feature that reduces the strike price for extraordinary dividends and a change in control feature that reduces the strike price based on a pre-established formula in the event of a change in control. Other terms are substantially similar to the 2001 Stock Incentive Plan.
Valuation Assumptions
The fair value of each stock option award is estimated on the date of grant using the Black-Scholes option pricing model with the following weighted average-assumptions for all awards issued in each respective year:
| Option Grants | |||||||||
| Year ended December 31, |
2008 | 2007 | 2006 | ||||||
| Expected Volatility |
21 | % | 21 | % | 24 | % | |||
| Expected Term (in years) |
5 | 5 | 5 | ||||||
| Expected Dividend Yield |
1.7 | % | 1.7 | % | 1.9 | % | |||
| Risk-Free Interest Rate |
2.5 | % | 4.5 | % | 4.7 | % | |||
Expected Volatility: The expected volatility is estimated by the Company based on the Companys historical stock volatility.
Expected Term: The expected term is estimated by looking at historical experience of similar awards, giving consideration to the contractual terms of the award, vesting schedules and expectations of future employee behavior as influenced by changes to the terms of its stock option awards.
Expected Dividend Yield: The expected dividend yield is estimated by reviewing the most recent dividend declared by the Board of Directors.
Risk-Free Interest Rate: The risk free rate is estimated based on the yield on a U.S. Treasury zero-coupon issue with a remaining term equal to the expected term of the stock option grants.
The fair value of restricted shares is determined based on the market value of the Companys shares on the grant date.
Under the fair value recognition provisions of FAS 123(R), the estimated fair value of employee stock options and other share-based payments, net of estimated forfeitures, is amortized as an expense over the requisite service period. When estimating forfeitures, the Company considers its historical forfeitures as well as expectations about employee behavior. The Company currently uses an 8% forfeiture rate.
F-38
Table of Contents
Summary of Stock Compensation Activity:
The following is a summary of activity under the Companys existing stock compensation plans for the years ending December 31, 2006, 2007 and 2008, respectively:
2001 Stock Incentive and Non-Employee Director Stock Incentive Plans
| Weighted options outstanding |
Weighted average exercise price |
Fair value of options |
Weighted average remaining contractual life |
Aggregate intrinsic value |
Range of exercise prices |
||||||||||||
| Balance, December 31, 2005 |
3,151,180 | $ | 35.44 | ||||||||||||||
| Options granted |
981,958 | 43.76 | $ | 10.60 | $ | 42.66 $51.16 | |||||||||||
| Options granted, at lower than market price (1) |
37,964 | 0.01 | $ | 55.30 | $ | 0.01 | |||||||||||
| Options forfeited |
(107,461 | ) | 47.47 | ||||||||||||||
| Options expired |
(44,523 | ) | 52.93 | ||||||||||||||
| Options exercised |
(592,315 | ) | 31.95 | $ | 10,940.3 | ||||||||||||
| Balance, December 31, 2006 |
3,426,803 | $ | 37.43 | $ | 77,333.7 | $ | 0.01 $53.96 | ||||||||||
| Options granted |
755,586 | $ | 51.51 | $ | 12.71 | $ | 51.13 $59.66 | ||||||||||
| Options forfeited |
(18,092 | ) | 45.90 | ||||||||||||||
| Options expired |
| | |||||||||||||||
| Options exercised |
(191,649 | ) | 27.12 | $ | 5,900.9 | ||||||||||||
| Balance, December 31, 2007 |
3,972,648 | $ | 40.57 | $ | 77,749.2 | $ | 0.01 $59.66 | ||||||||||
| Options granted |
800,230 | $ | 53.69 | $ | 9.94 | $ | 50.71 $53.86 | ||||||||||
| Options forfeited |
(56,457 | ) | 49.23 | ||||||||||||||
| Options expired |
(145,124 | ) | 52.78 | ||||||||||||||
| Options exercised |
(564,564 | ) | 25.18 | $ | 9,946.6 | ||||||||||||
| Balance, December 31, 2008 |
4,006,733 | $ | 44.79 | 6.6 | $ | 29,583.4 | $ | 11.92 $59.66 | |||||||||
| Total options exercisable at December 31, 2008 |
2,090,751 | $ | 40.23 | 5.1 | $ | 24,208.2 | $ | 27.24 $59.66 | |||||||||
| (1) | These options were issued as replacement options to the employees of a subsidiary at the time the Company purchased the remaining minority interest in the subsidiary. The options were issued as vested and immediately exercisable under the terms of the original options. |
F-39
Table of Contents
Premium Option Plan
| Weighted options outstanding |
Weighted average exercise price |
Fair value of options |
Weighted average remaining contractual life |
Aggregate intrinsic value |
Range of exercise prices |
|||||||||||
| Balance, December 31, 2005 |
5,174,000 | $ | 80.15 | $ | | |||||||||||
| Options granted |
| | ||||||||||||||
| Options forfeited |
(1,400,000 | ) | 74.24 | |||||||||||||
| Options expired |
| | ||||||||||||||
| Options exercised |
| | ||||||||||||||
| Balance, December 31, 2006 |
3,774,000 | $ | 82.34 | $ | | $ | 73.06 $98.98 | |||||||||
| Options granted |
| $ | | |||||||||||||
| Options forfeited |
| | ||||||||||||||
| Options expired |
| | ||||||||||||||
| Options exercised |
| | ||||||||||||||
| Balance, December 31, 2007 (1) |
3,774,000 | $ | 82.34 | $ | | $ | 73.06 $98.98 | |||||||||
| Options granted |
| $ | | |||||||||||||
| Options forfeited |
| | ||||||||||||||
| Options expired |
| | ||||||||||||||
| Options exercised |
| | ||||||||||||||
| Balance, December 31, 2008 (1) |
3,774,000 | $ | 82.34 | $ | | $ | 73.06 $98.98 | |||||||||
| Total options exercisable at December 31, 2008 (1) |
2,500,000 | $ | 86.61 | 5.7 | $ | | $ | 74.24 $98.98 | ||||||||
| (1) | The Premium Option Plan was terminated at the August 2007 Board of Directors meeting and consequently, the shares available for grant under the plan is zero. |
Restricted Stock
|
Employee restricted stock |
Non-employee director restricted stock |
Total restricted stock |
||||||||||||||||
| Number of shares |
Weighted average grant-dated fair value |
Number of shares |
Weighted average grant-dated fair value |
Number of shares |
Weighted average grant-dated fair value |
|||||||||||||
| Nonvested at December 31, 2005 |
631,592 | $ | 44.90 | 27,523 | $ | 48.43 | 659,115 | $ | 45.05 | |||||||||
| Awards granted |
502,234 | $ | 44.88 | 24,625 | $ | 44.67 | 526,859 | $ | 44.87 | |||||||||
| Awards vested |
(207,905 | ) | 44.65 | (13,157 | ) | 48.12 | (221,062 | ) | 44.86 | |||||||||
| Awards canceled/expired/forfeited |
(37,165 | ) | 46.14 | | | (37,165 | ) | 46.14 | ||||||||||
| Nonvested at December 31, 2006 |
888,756 | $ | 44.90 | 38,991 | $ | 46.16 | 927,747 | $ | 44.95 | |||||||||
| Awards granted |
307,251 | $ | 51.80 | 23,183 | $ | 51.75 | 330,434 | $ | 51.79 | |||||||||
| Awards vested |
(315,916 | ) | 45.55 | (16,971 | ) | 47.14 | (332,887 | ) | 45.63 | |||||||||
| Awards canceled/expired/forfeited |
(16,959 | ) | 44.98 | | | (16,959 | ) | 44.98 | ||||||||||
| Nonvested at December 31, 2007 |
863,132 | $ | 47.11 | 45,203 | $ | 48.65 | 908,335 | $ | 47.19 | |||||||||
| Awards granted |
437,250 | $ | 51.19 | 23,585 | $ | 53.00 | 460,835 | $ | 51.28 | |||||||||
| Awards vested |
(358,745 | ) | 46.62 | (30,479 | ) | 48.65 | (389,224 | ) | 46.78 | |||||||||
| Awards canceled/expired/forfeited |
(42,346 | ) | 49.61 | | | (42,346 | ) | 49.61 | ||||||||||
| Nonvested at December 31, 2008 |
899,291 | $ | 49.17 | 38,309 | $ | 51.33 | 937,600 | $ | 49.26 | |||||||||
Shares available for issuance under the Companys 2001 Stock Incentive Plan and Non-Employee Director Stock Incentive Plan totaled 2.0 million at December 31, 2008. The total fair value of shares vested during the year ended December 31, 2008 was $19.8 million (2007 $17.4 million, 2006 $10.5 million). Cash in the amount of $3.0 million was received from employees as a result of employee stock option exercises
F-40
Table of Contents
during the year ended December 31, 2008 (2007 $0.5 million, 2006 $0.5 million). In connection with these exercises there was no tax benefit realized by the Company. The Company issues new shares upon the exercise of an option.
As of December 31, 2008, there was $30.7 million of total unrecognized compensation cost related to restricted shares and $13.9 million related to stock options expense which will be recognized during the next 2.4 years.
All of the Companys employees are eligible for defined contribution pension plans. Contributions are primarily based upon a percentage of eligible compensation. The Company contributed $2.3 million to its defined contribution pension plans in 2008 (2007 $1.7 million, 2006 $1.7 million).
NOTE 21. STATUTORY REQUIREMENTS
Under the Insurance Act 1978, amendments thereto and Related Regulations of Bermuda (the Act), certain subsidiaries of the Company are required to prepare statutory financial statements and to file in Bermuda a statutory financial return. The Act also requires these subsidiaries of the Company to maintain certain measures of solvency and liquidity. At December 31, 2008, the statutory capital and surplus of the Bermuda subsidiaries was $3.2 billion (2007 $3.3 billion) and the amount required to be maintained under Bermuda law was $525.5 million (2007 $578.3 million).
Under the Act, Renaissance Reinsurance and DaVinci are classified as Class 4 insurers, and are therefore restricted as to the payment of dividends in the amount of 25% of the prior years statutory capital and surplus, unless at least two members of the Board of Directors attest that a dividend in excess of this amount would not cause the company to fail to meet its relevant margins. During 2008, Renaissance Reinsurance and DaVinci declared aggregate cash dividends of $238.1 million (2007 $547.8 million) and $6.9 million (2007 $28.1 million).
Under the Act, Glencoe is classified as a Class 3 insurer and Glencoe is also eligible as an excess and surplus lines insurer in a number of states in the U.S. Under the various capital and surplus requirements in Bermuda and in these states, Glencoe is required to maintain a minimum amount of capital and surplus. In this regard, the declaration of dividends from retained earnings and distributions from additional paid-in capital are limited to the extent that the above requirement is met. During 2008, Glencoe declared aggregate cash dividends of $40.0 million (2007 $nil).
In 2008, new statutory legislation was enacted in Bermuda, which included, among other things, the Bermuda Solvency Capital Requirement (BSCR) which is a standard mathematical model designed to give the BMA more advanced methods for determining an insurers capital adequacy. Underlying the BSCR is the belief that all insurers should operate on an ongoing basis with a view to maintaining their capital at a prudent level in excess of the minimum solvency margin otherwise prescribed under the Insurance Act. Effective December 31 2008, the BMA will require all Class 4 insurers to maintain their capital at a target level which is set at 120% of the minimum amount calculated in accordance with the BSCR or an approved in-house model. The Company is currently completing the 2008 BSCR for its Class 4 insurers, Renaissance Reinsurance and DaVinci, and at this time believes both companies will exceed the target level of capital.
The Companys principal U.S. insurance subsidiary Stonington is also required to maintain certain measures of solvency and liquidity. Restrictions with respect to dividends are based on state statutes. In addition, there are restrictions based on risk based capital tests which is the threshold that constitutes the authorized control level. If Stoningtons statutory capital and surplus falls below the authorized control level, the commissioner is authorized to take whatever regulatory actions are considered necessary to protect policyholders and creditors. At December 31, 2008, the consolidated statutory capital and surplus of Stonington was $128.6 million (2007 $124.8 million). Because of an accumulated deficit in earned surplus from prior operations, Stonington cannot currently pay an ordinary dividend without commissioner approval.
F-41
Table of Contents
The differences between statutory basis financial statements and financial statements prepared in accordance with U.S. GAAP vary between domestic and foreign jurisdictions. The principal differences in Bermuda are that statutory financial statements do not reflect deferred acquisition costs, prepaid assets, or fixed assets. Also, reinsurance assets and liabilities are presented net of retrocessional reinsurance and there is no cash flow statement. The principal differences in the United States are that statutory financial statements do not reflect deferred acquisition costs, bonds are carried at amortized cost, deferred income tax is charged or credited directly to equity, subject to limitations, and reinsurance assets and liabilities are presented net of retrocessional reinsurance. The Company has not used any statutory accounting practices that are not prescribed.
NOTE 22. DERIVATIVE INSTRUMENTS
Under FAS 133, companies are required to recognize all derivative instruments as either assets or liabilities on its balance sheet at fair value. The accounting for changes in fair value (i.e. gains or losses) of a derivative instrument depends on whether it has been designated and qualifies as part of a hedging relationship. The Company does not hold any derivatives designated as hedging instruments under FAS 133.
The Companys guidelines permit, subject to approval, investments in derivative instruments such as futures, forward contracts, options, swap agreements and other derivative contracts which may be used to assume risk or for hedging purposes. The Company principally has exposure to derivatives related to the following types of risks: interest rate risk; foreign currency risk; credit risk and energy and weather-related risk.
Interest Rate Futures
The Company uses interest rate futures within its portfolio of fixed maturity investments available for sale to manage its exposure to interest rate risk, which can include increasing or decreasing its exposure to this risk. At December 31, 2008, the Company had $1.6 billion of notional long positions and $134.0 million of notional short positions of Eurodollar, U.S. Treasury and non-U.S. dollar futures contracts. The fair value of these derivatives as recognized in other assets and liabilities in its consolidated balance sheet at December 31, 2008, was $0.1 million (2007 $0.3 million) and $0.1 million (2007 $0.3 million), respectively. During 2008, the Company recorded gains of $12.4 million (2007 losses of $1.9 million) in its consolidated statement of operations related to these derivatives. The fair value of these derivatives is determined using exchange traded closing prices.
Foreign Currency Derivatives
The Companys functional currency is the U.S. dollar. The Company writes a portion of its business in currencies other than U.S. dollars and may, from time to time, experience foreign exchange gains and losses and incur underwriting losses in currencies other than U.S. dollars, which will in turn affect the Companys consolidated financial statements. All changes in exchange rates, with the exception of non-U.S. dollar denominated investments classified as available for sale, are recognized currently in the Companys consolidated statements of operations.
Underwriting Related Foreign Currency Contracts
The Companys foreign currency policy with regard to its underwriting operations is generally to hold foreign currency assets, including cash, investments and receivables that approximate the foreign currency liabilities, including claims and claim expense reserves and reinsurance balances payable. When necessary, the Company will use foreign currency forward and option contracts to minimize the effect of fluctuating foreign currencies on the value of non-U.S. dollar denominated assets and liabilities associated with its underwriting operations. At December 31, 2008, the total notional amount in United States dollars of the Companys underwriting related foreign currency contracts was $133.0 million (2007 $222.5 million). For the year ended December 31, 2008, the company incurred a loss of $21.4 million (2007 gain of $3.6 million) on its foreign currency forward and option contracts related to its underwriting operations.
F-42
Table of Contents
Investment Portfolio Related Foreign Currency Forward Contracts
The Companys investment operations are exposed to currency fluctuations through its investments in non-U.S. dollar fixed maturity investments, short term investments and other investments. To economically hedge its exposure to currency fluctuations from these investments, the Company has entered into foreign currency forward contracts. Foreign exchange gains (losses) associated with the Companys hedging of these non-U.S. dollar investments are recorded in net foreign exchange gains (losses) in its consolidated statements of operations. As at December 31, 2008, the Company had outstanding investment portfolio related foreign currency contracts of $207.0 million in short positions and $103.4 million in long positions, denominated in U.S. dollars. For the year ended December 31, 2008, the Company recorded a gain of $5.8 million (2007 loss of $15.1 million, 2006 loss of $13.1 million) related to its foreign currency forward contracts entered into to economically hedge the Companys non-U.S. dollar investments.
Credit Derivatives
The Companys exposure to credit risk is primarily due to its fixed maturity investments available for sale, short term investments, premiums receivable and ceded reinsurance balances. From time to time, the Company purchases credit derivatives to hedge its exposures in the insurance industry and to assist in managing the credit risk associated with ceded reinsurance. The fair value of the credit derivatives are determined using industry valuation models. The fair value of these credit derivatives can change based on a variety of factors including changes in credit spreads, default rates and recovery rates, the correlation of credit risk between the referenced credit and the counterparty, and market rate inputs such as interest rates. The fair value of these credit derivatives, as recognized in other liabilities in the Companys balance sheet, at December 31, 2008 was $0.9 million (2007 $0.1 million). During 2008, the Company recorded gains of $1.1 million (2007 gains of $0.5 million, 2006 loss of $0.6 million), which are included in other income (loss) and represents net settlements and changes in the fair value of these credit derivatives.
Energy and Weather-Related Derivatives
The Company sells certain derivative financial products primarily to address weather risks and engages in hedging and trading activities related to these risks. The trading markets for these derivatives is linked to energy, commodities, weather, other natural phenomena, or products or indices linked in part to such phenomena, such as heating and cooling degree days, precipitation, energy production and prices, and commodities. The fair value of these contracts is obtained through the use of quoted market prices, or in the absence of such quoted prices, industry or internal valuation models. These contracts are recorded on the Companys balance sheet in other assets and other liabilities and totaled $41.7 million and $38.8 million, respectively (2007 $15.9 million and $21.1 million, respectively). During 2008, the Company generated income related to these derivatives of $33.7 million (2007 incurred losses of $1.1 million, 2006 incurred losses of $2.2 million) which are included in other income (loss) and represents net settlements and changes in the fair value of these contracts.
Platinum Warrant
The Company holds a warrant to purchase up to 2.5 million common shares of Platinum Underwriters Holding Ltd. (Platinum) for $27.00 per share. The Company has recorded its investment in the Platinum warrant at fair value. At December 31, 2008, the fair value of the warrant was $29.9 million (2007 $30.5 million). The fair value of the warrant is estimated using the Black-Scholes option pricing model. For the year ended December 31, 2008, a loss of $0.5 million (2007 income of $5.5 million, 2006 loss of $1.7 million) was recorded in other income (loss) representing the change in the fair value of the warrant.
F-43
Table of Contents
The table below shows the location on the consolidated balance sheet and fair value of the Companys derivative instruments:
| Derivative Assets | Derivative Liabilities | |||||||||||||||||||
| At December 31, |
2008 | 2007 | 2008 | 2007 | ||||||||||||||||
| Balance Sheet Location |
Fair Value |
Balance Sheet Location |
Fair Value |
Balance Sheet Location |
Fair Value |
Balance Sheet Location |
Fair Value |
|||||||||||||
| Interest rate futures |
Other assets | $ | 96 | Other assets | $ | 300 | Other liabilities | $ | 148 | Other liabilities | $ | 300 | ||||||||
| Foreign currency forward contracts * |
Other assets | | Other assets | | Other liabilities | 26,428 | Other liabilities | 652 | ||||||||||||
| Foreign currency forward contracts ** |
Other assets | | Other assets | 2,747 | Other liabilities | 2,955 | Other liabilities | 1,476 | ||||||||||||
| Credit default swaps |
Other assets | | Other assets | | Other liabilities | 854 | Other liabilities | 94 | ||||||||||||
| Energy and weather contracts |
Other assets | 41,668 | Other assets | 15,914 | Other liabilities | 38,819 | Other liabilities | 21,057 | ||||||||||||
| Platinum warrant |
Other assets | 29,913 | Other assets | 30,452 | Other liabilities | | Other liabilities | | ||||||||||||
| Total |
$ | 71,677 | $ | 49,413 | $ | 69,204 | $ | 23,579 | ||||||||||||
| * | Contracts used to manage foreign currency risks in underwriting and non-investment operations. |
| ** | Contracts used to manage foreign currency risks in investment operations. |
The location and amount of the gain (loss) recognized in the Companys consolidated statement of operations related to its derivative instruments is shown in the following table:
| Year ended December 31, |
Location of gain (loss) recognized on derivatives |
Amount of gain (loss) recognized on derivatives |
||||||||
| 2008 | 2007 | |||||||||
| Interest rate futures |
Net investment income | $ | 12,391 | $ | (1,888 | ) | ||||
| Foreign currency forward contracts * |
Net foreign exchange gains | (21,366 | ) | 3,611 | ||||||
| Foreign currency forward contracts ** |
Net foreign exchange gains | 5,784 | (15,132 | ) | ||||||
| Credit default swaps |
Other income (loss) | 1,148 | 506 | |||||||
| Energy and weather contracts |
Other income (loss) | 33,681 | (1,112 | ) | ||||||
| Platinum warrant |
Other income (loss) | (538 | ) | 5,468 | ||||||
| Total |
$ | 31,100 | $ | (8,547 | ) | |||||
| * | Contracts used to manage foreign currency risks in underwriting and non-investment operations. |
| ** | Contracts used to manage foreign currency risks in investment operations. |
The Company is not aware of the existence of any credit-risk related contingent features that could be triggered in its derivative instruments that are in a net liability position at December 31, 2008.
NOTE 23. COMMITMENTS AND CONTINGENCIES
CONCENTRATION OF CREDIT RISK
Financial instruments which potentially subject the Company to concentration of credit risk consist principally of investments, including the Companys equity method investments, cash and reinsurance balances. The Company limits the amount of credit exposure to any one financial institution and, except for U.S. Government securities, none of the Companys investments exceeded 10% of shareholders equity at December 31, 2008. See Note 7. Ceded Reinsurance, for information with respect to losses recoverable.
EMPLOYMENT AGREEMENTS
The Board of Directors has authorized the execution of employment agreements between the Company and certain officers. These agreements provide for, among other things, severance payments under certain circumstances, as well as accelerated vesting of options and restricted stock grants, upon a change in control, as defined therein and by the Companys 2001 Stock Incentive Plan and Premium Option Plan.
F-44
Table of Contents
LETTERS OF CREDIT AND OTHER COMMITMENTS
At December 31, 2008, the Companys banks have issued letters of credit of approximately $998.9 million in favor of certain ceding companies. In connection with the Companys Top Layer Re joint venture, the Company has committed $37.5 million of collateral to support a letter of credit and is obligated to make a mandatory capital contribution of up to $50.0 million in the event that a loss reduces Top Layer Res capital and surplus below a specified level. The letters of credit are secured by cash and investments of similar amounts. The Companys principal letter of credit facility contains certain financial covenants.
At December 31, 2008, the Company provided $105.1 million of guarantees to support the weather and energy trading operations of Renaissance Trading Ltd.
PRIVATE EQUITY AND INVESTMENT FUND COMMITMENTS
We have committed capital to private equity partnerships and a bank loan fund of $586.7 million, of which $239.1 million has not yet been contributed at December 31, 2008. These commitments do not have a defined contractual commitment date.
REVERSE REPURCHASE OBLIGATION
At December 31, 2008, included in other liabilities on the Companys consolidated balance sheet is $50.1 million related to a reverse repurchase obligation whereby the Company transferred certain fixed maturity investments available for sale in exchange for cash and simultaneously agreed to reacquire these securities at an amount equal to the cash received plus an interest payment. The $50.1 million was settled in January 2009.
INDEMNIFICATIONS AND WARRANTIES
In the ordinary course of its business, the Company may enter into contracts or agreements that contain indemnifications or warranties. Future events could occur that lead to the execution of these provisions against the Company. Based on past experience, management currently believes that the likelihood of such an event is remote.
OPERATING LEASES
The Company and its subsidiaries lease office space under operating leases which expire at various dates through 2019. Future minimum lease payments under existing operating leases are expected to be as follows:
| Year ended December 31, |
Minimum lease payments | ||
| 2009 |
$ | 6,782 | |
| 2010 |
6,505 | ||
| 2011 |
6,100 | ||
| 2012 |
5,526 | ||
| 2013 |
5,516 | ||
| After 2013 |
14,294 | ||
| $ | 44,723 | ||
CAPITAL LEASES
During the fourth quarter of 2007, the Company entered into a capital lease transaction, committing the Company to lease additional office space in Bermuda. Upon completion of construction of the building in July 2008, the Company commenced making lease payments. The initial lease term is for 20 years, with a bargain renewal option for an additional 30 years.
F-45
Table of Contents
The future minimum lease payments detailed below, relate principally to the transaction noted above, excluding the bargain renewal option, and are estimated to be $50.3 million in the aggregate.
| Year ended December 31, |
Minimum lease payments | ||
| 2009 |
$ | 2,893 | |
| 2010 |
2,695 | ||
| 2011 |
2,417 | ||
| 2012 |
2,417 | ||
| 2013 |
2,417 | ||
| After 2013 |
37,450 | ||
| $ | 50,289 | ||
LITIGATION
As previously disclosed, the Company received a subpoena from the SEC in February 2005, a subpoena from the Office of the Attorney General of the State of New York (the NYAG) in March 2005, and a subpoena from the United States Attorneys Office for the Southern District of New York in June 2005, each of which related to industry-wide investigations into non-traditional, or loss mitigation, (re)insurance products.
On February 6, 2007, the Company announced that the SEC had accepted its offer of settlement to the SEC to resolve the SECs investigation. The settlement was approved by the United States District Court for the Southern District of New York pursuant to a final judgment entered on March 20, 2007 and the Company has made payment on all financial penalties agreed to under the settlement. Pursuant to the settlement, the Company was also obliged to retain an independent consultant to review certain of its internal controls, policies and procedures as well as the design and implementation of the review conducted by independent counsel reporting to the non-executive members of the Board of Directors and certain additional procedures performed by the Companys auditors in connection with their audit of the Companys financial statements for the fiscal year ended December 31, 2004. While the Company continues to strive to fully comply with the terms of the settlement agreement with the SEC, it is possible it will fail to do so, or that the enforcement staff of the SEC and/or the independent consultant may take issue with the Companys cooperation despite its efforts. Any such failure to comply with the settlement agreement or any such perception that the Company has failed to comply could adversely affect it, perhaps materially so.
As previously disclosed, in September 2006, the SEC filed an enforcement action in the United States District Court for the Southern District of New York (the Court) against certain of the Companys former officers, including James N. Stanard, the Companys former Chairman and Chief Executive Officer, charging such individuals with violations of federal securities laws, including securities fraud, and seeking permanent injunctive relief, disgorgement of ill-gotten gains, if any, plus prejudgment interest, civil money penalties, and orders barring each defendant from acting as an officer or director of any public company. The civil litigation between the SEC and Mr. Stanard, to which the Company was not a party, went to trial in September 2008. On January 27, 2009, the Court issued an opinion and order finding Mr. Stanard liable for securities fraud and other violations of Federal securities laws. The Court permanently enjoined Mr. Stanard from future securities violations and ordered Mr. Stanard to pay a $100 thousand civil penalty. The Court denied the SECs request for an order barring Mr. Stanard from serving as an officer or director of a public company. The ongoing matter, including whether or not an appeal is taken, could give rise to additional costs, distractions, or impacts to the Companys reputation.
The Companys operating subsidiaries are subject to claims litigation involving disputed interpretations of policy coverages. Generally, the Companys primary insurance operations are subject to greater frequency and diversity of claims and claims-related litigation and, in some jurisdictions, may be subject to direct actions by allegedly injured persons or entities seeking damages from policyholders. These lawsuits, involving claims on policies issued by the Companys subsidiaries which are typical to the insurance industry in general and in the normal course of business, are considered in its loss and loss expense reserves which are discussed in its loss reserves discussion. In addition to claims litigation, the Company
F-46
Table of Contents
and its subsidiaries are subject to lawsuits and regulatory actions in the normal course of business that do not arise from or directly relate to claims on insurance policies. This category of business litigation may involve allegations of underwriting or claims-handling errors or misconduct, employment claims, regulatory activity or disputes arising from the Companys business ventures. Any such litigation or arbitration contains an element of uncertainty, and the Company believes the inherent uncertainty in such matters may have increased recently and will likely continue to increase. Currently, the Company believes that no individual, normal course litigation or arbitration to which it is presently a party is likely to have a material adverse effect on its financial condition, business or operations.
NOTE 24. QUARTERLY FINANCIAL RESULTS (UNAUDITED)
| Quarter Ended March 31, |
Quarter Ended June 30, |
Quarter Ended September 30, |
Quarter Ended December 31, |
|||||||||||||||||||||||||||||
| 2008 | 2007 | 2008 | 2007 | 2008 | 2007 | 2008 | 2007 | |||||||||||||||||||||||||
| Gross premiums written |
$ | 527,038 | $ | 632,729 | $ | 807,575 | $ | 845,860 | $ | 239,806 | $ | 208,821 | $ | 161,609 | $ | 122,227 | ||||||||||||||||
| Net premiums written |
$ | 403,116 | $ | 571,027 | $ | 614,022 | $ | 609,842 | $ | 194,408 | $ | 149,163 | $ | 142,074 | $ | 105,303 | ||||||||||||||||
| Net premiums earned |
308,914 | 362,618 | $ | 376,573 | $ | 358,454 | $ | 379,342 | $ | 367,057 | $ | 321,995 | $ | 336,240 | ||||||||||||||||||
| Net investment income (loss) |
52,503 | 108,015 | 38,685 | 118,140 | 15,767 | 95,594 | (82,724 | ) | 80,714 | |||||||||||||||||||||||
| Net foreign exchange gains (losses) |
4,936 | 5,167 | (231 | ) | (373 | ) | 3,448 | (5,424 | ) | (5,553 | ) | 4,598 | ||||||||||||||||||||
| Equity in earnings (losses) of other ventures |
6,250 | 10,701 | 4,872 | 9,675 | 2,333 | (23,986 | ) | 148 | (124,999 | ) | ||||||||||||||||||||||
| Other income (loss) |
8,012 | (2,203 | ) | (24 | ) | (5,498 | ) | 2,258 | (10,008 | ) | 6 | (20,221 | ) | |||||||||||||||||||
| Net realized (losses) gains on investments |
(10,670 | ) | 4,085 | (24,161 | ) | (11,566 | ) | (87,610 | ) | 1,592 | (83,873 | ) | 7,182 | |||||||||||||||||||
| Total revenues |
369,945 | 488,383 | 395,714 | 468,832 | 315,538 | 424,825 | 149,999 | 283,514 | ||||||||||||||||||||||||
| Net claims and claim expenses incurred |
82,156 | 145,992 | 114,217 | 138,854 | 535,347 | 131,700 | 28,769 | 62,728 | ||||||||||||||||||||||||
| Acquisition costs |
46,428 | 63,729 | 53,613 | 59,509 | 54,231 | 63,719 | 59,281 | 67,973 | ||||||||||||||||||||||||
| Operational expenses |
30,113 | 28,524 | 33,494 | 26,527 | 30,296 | 27,126 | 28,262 | 28,287 | ||||||||||||||||||||||||
| Corporate expenses |
8,703 | 7,004 | 7,111 | 4,927 | 3,116 | 7,158 | 6,705 | 9,771 | ||||||||||||||||||||||||
| Interest expense |
6,804 | 11,979 | 5,937 | 7,195 | 5,379 | 7,226 | 6,513 | 7,226 | ||||||||||||||||||||||||
| Total expenses |
174,204 | 257,228 | 214,372 | 237,012 | 628,369 | 236,929 | 129,530 | 175,985 | ||||||||||||||||||||||||
| Income (loss) before minority interest and taxes |
195,741 | 231,155 | 181,342 | 231,820 | (312,831 | ) | 187,896 | 20,469 | 107,529 | |||||||||||||||||||||||
| Minority interest DaVinciRe |
(40,315 | ) | (29,107 | ) | (41,341 | ) | (37,399 | ) | 91,977 | (43,820 | ) | (65,454 | ) | (54,070 | ) | |||||||||||||||||
| Income (loss) before taxes |
155,426 | 202,048 | 140,001 | 194,421 | (220,854 | ) | 144,076 | (44,985 | ) | 53,459 | ||||||||||||||||||||||
| Income tax (expense) benefit |
(7,686 | ) | (107 | ) | 6,295 | (680 | ) | 455 | (101 | ) | 368 | 19,320 | ||||||||||||||||||||
| Net income (loss) |
147,740 | 201,941 | 146,296 | 193,741 | (220,399 | ) | 143,975 | (44,617 | ) | 72,779 | ||||||||||||||||||||||
| Dividends on preference shares |
(10,575 | ) | (11,136 | ) | (10,575 | ) | (10,575 | ) | (10,575 | ) | (10,575 | ) | (10,575 | ) | (10,575 | ) | ||||||||||||||||
| Net income (loss) available (attributable) to common shareholders |
$ | 137,165 | $ | 190,805 | $ | 135,721 | $ | 183,166 | $ | (230,974 | ) | $ | 133,400 | $ | (55,192 | ) | $ | 62,204 | ||||||||||||||
| Earnings (loss) per common share basic |
$ | 2.09 | $ | 2.68 | $ | 2.16 | $ | 2.57 | $ | (3.79 | ) | $ | 1.89 | $ | (0.91 | ) | $ | 0.90 | ||||||||||||||
| Earnings (loss) per common share diluted (1) |
$ | 2.05 | $ | 2.63 | $ | 2.13 | $ | 2.53 | $ | (3.79 | ) | $ | 1.85 | $ | (0.91 | ) | $ | 0.88 | ||||||||||||||
| Weighted average shares basic |
65,528 | 71,281 | 62,921 | 71,259 | 60,943 | 70,575 | 60,732 | 68,966 | ||||||||||||||||||||||||
| Weighted average shares diluted (1) |
66,803 | 72,514 | 63,878 | 72,430 | 61,694 | 71,945 | 61,269 | 70,413 | ||||||||||||||||||||||||
| Claims and claim expense ratio |
26.6% | 40.2% | 30.3% | 38.7% | 141.1% | 35.9% | 8.9% | 18.7% | ||||||||||||||||||||||||
| Underwriting expense ratio |
24.8% | 25.4% | 23.2% | 24.0% | 22.3% | 24.7% | 27.2% | 28.6% | ||||||||||||||||||||||||
| Combined ratio |
51.4% | 65.6% | 53.5% | 62.7% | 163.4% | 60.6% | 36.1% | 47.3% | ||||||||||||||||||||||||
| (1) | In accordance with FAS 128, diluted earnings per share calculations use average common shares outstanding basic, when in a net loss position. |
F-47
Table of Contents
NOTE 25. SUMMARIZED FINANCIAL INFORMATION OF CHANNELRE HOLDINGS LTD.
The following tables provide summarized financial information for ChannelRe, which is accounted for using the equity method of accounting, for 2008, 2007 and 2006. The Company calculates its proportionate share in the equity of ChannelRe one quarter in arrears, except for 2007, which includes ChannelRes estimated loss for the fourth quarter of 2007 due to significant net unrealized mark-to-market losses on credit derivatives and other credit-related products issued by ChannelRe. The summary information provided below is for the twelve months ended September 30, 2008, 2007 and 2006, respectively.
| As at September 30, |
2008 | 2007 | 2006 | |||||||||
| Balance Sheet Data |
||||||||||||
| Fixed maturity securities, at fair value |
$ | 586,736 | $ | 463,250 | $ | 519,857 | ||||||
| Short term investments, at fair value |
104,036 | 174,640 | 104,532 | |||||||||
| Total investments |
690,772 | 637,890 | 624,389 | |||||||||
| Cash and cash equivalents |
8,404 | 18,990 | 10,052 | |||||||||
| Deferred acquisition costs |
31,692 | 36,994 | 41,013 | |||||||||
| Derivative assets |
86,000 | 20,000 | 183 | |||||||||
| Other assets |
9,049 | 10,458 | 8,330 | |||||||||
| Total assets |
$ | 825,917 | $ | 724,332 | $ | 683,967 | ||||||
| Deferred premium revenue |
$ | 123,187 | $ | 144,478 | $ | 160,162 | ||||||
| Loss and loss adjustment expenses reserves |
41,172 | 28,245 | 19,317 | |||||||||
| Derivative liabilities |
743,167 | 115,443 | 4,821 | |||||||||
| Other liabilities |
8,620 | 6,840 | 7,690 | |||||||||
| Total liabilities |
916,146 | 295,006 | 191,990 | |||||||||
| Minority interest |
(25,179 | ) | 119,815 | 137,301 | ||||||||
| Deficiency in assets / shareholders equity |
(65,050 | ) | 309,511 | 354,676 | ||||||||
| Total liabilities, minority interest and shareholders equity |
$ | 825,917 | $ | 724,332 | $ | 683,967 | ||||||
| Twelve months ended September 30, |
2008 | 2007 | 2006 | |||||||||
| Statement of Operations Data |
||||||||||||
| Premiums earned |
$ | 47,904 | $ | 45,354 | $ | 56,153 | ||||||
| Net investment income |
30,246 | 29,430 | 24,108 | |||||||||
| Total revenues |
78,150 | 74,784 | 80,261 | |||||||||
| Losses incurred |
27,508 | 11,638 | 6,945 | |||||||||
| Acquisition costs |
12,163 | 12,362 | 14,833 | |||||||||
| Other expenses |
2,868 | 4,529 | 8,013 | |||||||||
| Total expenses |
42,539 | 28,529 | 29,791 | |||||||||
| Realized gains and other settlements on derivatives |
18,461 | 14,493 | 9,425 | |||||||||
| Unrealized losses on derivatives |
(560,674 | ) | (91,003 | ) | (688 | ) | ||||||
| Net change in fair value of derivatives |
(542,213 | ) | (76,510 | ) | 8,737 | |||||||
| Net realized gains (losses) on investments |
1 | (239 | ) | (887 | ) | |||||||
| Net gains on foreign exchange |
1,271 | 1,680 | 93 | |||||||||
| Net realized and unrealized (losses) gains |
(540,941 | ) | (75,069 | ) | 7,943 | |||||||
| Minority interest |
141,024 | 8,043 | (16,303 | ) | ||||||||
| Net (loss) income (attributable) available to common shareholders |
$ | (364,306 | ) | $ | (20,771 | ) | $ | 42,110 | ||||
ChannelRe experienced significant unrealized mark-to-market losses arising from financial guaranty contracts accounted for as derivatives under GAAP during 2007, and as a result, ChannelRes GAAP shareholders equity decreased to below $nil as of December 31, 2007 and remained negative throughout 2008. As such, the Company reduced the carried value of its equity investment in ChannelRe to $nil as of December 31, 2007.
Certain amounts have been reclassified in the prior years financial information, noted above, to conform to the current presentation.
F-48
Table of Contents
RENAISSANCERE HOLDINGS LTD. AND SUBSIDIARIES
INDEX TO SCHEDULES TO CONSOLIDATED FINANCIAL STATEMENTS
Schedules other than those listed above are omitted for the reason that they are not applicable.
S-1
Table of Contents
REPORT OF INDEPENDENT REGISTERED PUBLIC ACCOUNTING FIRM
To the Board of Directors and Shareholders of RenaissanceRe Holdings Ltd.
We have audited the consolidated financial statements of RenaissanceRe Holdings Ltd. and Subsidiaries as of December 31, 2008 and 2007, and for each of the three years in the period ended December 31, 2008, and have issued our report thereon dated February 19, 2009; such financial statements and our report thereon are included elsewhere in this Annual Report on Form 10-K. Our audits also included the financial statement schedules listed in Item 15(a) (2) of this Annual Report on Form 10-K for the year ended December 31, 2008. These schedules are the responsibility of the Companys management. Our responsibility is to express an opinion based on our audits.
In our opinion, the financial statement schedules referred to above, when considered in relation to the basic financial statements taken as a whole, present fairly in all material respects the information set forth therein.
/s/ Ernst & Young Ltd.
Hamilton, Bermuda
February 19, 2009
S-2
Table of Contents
RENAISSANCERE HOLDINGS LTD. AND SUBSIDIARIES
SUMMARY OF INVESTMENTS
OTHER THAN INVESTMENTS IN RELATED PARTIES
(MILLIONS OF UNITED STATES DOLLARS)
| Year ended December 31, 2008 | |||||||||
| Amortized Cost |
Market Value |
Amount at which shown in the Balance Sheet |
|||||||
| Type of investment: |
|||||||||
| Fixed maturity investments available for sale |
|||||||||
| U.S. treasuries |
$ | 462.5 | $ | 467.5 | $ | 467.5 | |||
| Agencies |
431.5 | 448.5 | 448.5 | ||||||
| Non-U.S. government bonds |
53.6 | 57.1 | 57.1 | ||||||
| Corporate securities |
719.2 | 747.2 | 747.2 | ||||||
| Mortgage-backed securities |
1,084.2 | 1,110.6 | 1,110.6 | ||||||
| Asset-backed securities |
166.0 | 166.0 | 166.0 | ||||||
| Total fixed maturity investments available for sale |
2,917.0 | 2,996.9 | 2,996.9 | ||||||
| Short term investments |
2,172.3 | 2,172.3 | 2,172.3 | ||||||
| Other investments |
773.5 | 773.5 | 773.5 | ||||||
| Investments in other ventures, under equity method |
99.9 | 99.9 | 99.9 | ||||||
| Total investments |
$ | 5,962.7 | $ | 6,042.6 | $ | 6,042.6 | |||
S-3
Table of Contents
RENAISSANCERE HOLDINGS LTD.
CONDENSED FINANCIAL INFORMATION OF REGISTRANT
RENAISSANCERE HOLDINGS LTD.
BALANCE SHEETS
AT DECEMBER 31, 2008 AND 2007
(PARENT COMPANY)
(THOUSANDS OF UNITED STATES DOLLARS)
| At December 31, | ||||||
| 2008 | 2007 | |||||
| Assets: |
||||||
| Investments and cash |
||||||
| Fixed maturity investments, available for sale, at fair value |
$ | 62,536 | $ | 60,920 | ||
| Short term investments, at fair value |
236,133 | 377,619 | ||||
| Other investments |
8,880 | | ||||
| Total investments |
307,549 | 438,539 | ||||
| Cash and cash equivalents |
5,122 | 9,290 | ||||
| Investments in subsidiaries |
3,059,524 | 3,049,933 | ||||
| Due from subsidiaries |
18,123 | 156,500 | ||||
| Accrued investment income |
1,214 | 2,134 | ||||
| Other assets |
13,745 | 94,415 | ||||
| Total Assets |
$ | 3,405,277 | $ | 3,750,811 | ||
| Liabilities and Shareholders Equity: |
||||||
| Liabilities: |
||||||
| Notes and bank loans payable |
$ | 250,000 | $ | 250,000 | ||
| Contributions due to subsidiaries |
86,262 | 275 | ||||
| Other liabilities |
36,272 | 23,033 | ||||
| Total Liabilities |
372,534 | 273,308 | ||||
| Shareholders Equity: |
||||||
| Preference Shares: $1.00 par value 26,000,000 shares issued and outstanding at December 31, 2008 (2007 26,000,000) |
650,000 | 650,000 | ||||
| Common Shares: $1.00 par value 61,503,333 shares issued and outstanding at December 31, 2008 (2007 68,920,319 shares) |
61,503 | 68,920 | ||||
| Additional paid-in capital |
| 107,867 | ||||
| Accumulated other comprehensive income |
75,387 | 44,719 | ||||
| Retained earnings |
2,245,853 | 2,605,997 | ||||
| Total Shareholders Equity |
3,032,743 | 3,477,503 | ||||
| Total Liabilities and Shareholders Equity |
$ | 3,405,277 | $ | 3,750,811 | ||
S-4
Table of Contents
SCHEDULE II
RENAISSANCERE HOLDINGS LTD.
CONDENSED FINANCIAL INFORMATION OF REGISTRANT CONTINUED
RENAISSANCERE HOLDINGS LTD.
STATEMENTS OF OPERATIONS
FOR THE YEARS ENDED DECEMBER 31, 2008, 2007 AND 2006
(PARENT COMPANY)
(THOUSANDS OF UNITED STATES DOLLARS)
| Year ended December 31, | ||||||||||||
| 2008 | 2007 | 2006 | ||||||||||
| Revenues |
||||||||||||
| Net investment (loss) income |
$ | (1,745 | ) | $ | 23,770 | $ | 16,455 | |||||
| Net foreign exchange loss |
(38 | ) | | | ||||||||
| Net realized losses on investments |
(3,877 | ) | (182 | ) | | |||||||
| Other (loss) income |
(4,634 | ) | (145,596 | ) | 17,997 | |||||||
| Total revenues |
(10,294 | ) | (122,008 | ) | 34,452 | |||||||
| Expenses |
||||||||||||
| Interest expense |
14,613 | 21,193 | 28,767 | |||||||||
| Operating and corporate expenses |
12,152 | 18,420 | 37,890 | |||||||||
| Total expenses |
26,765 | 39,613 | 66,657 | |||||||||
| Loss before equity in net income of subsidiaries & taxes |
(37,059 | ) | (161,621 | ) | (32,205 | ) | ||||||
| Equity in net income of subsidiaries |
66,079 | 774,057 | 829,315 | |||||||||
| Net income before taxes |
29,020 | 612,436 | 797,110 | |||||||||
| Income tax expense |
| | | |||||||||
| Net income |
29,020 | 612,436 | 797,110 | |||||||||
| Dividends on preference shares |
(42,300 | ) | (42,861 | ) | (35,475 | ) | ||||||
| Net (loss) income (attributable) available to common shareholders |
$ | (13,280 | ) | $ | 569,575 | $ | 761,635 | |||||
S-5
Table of Contents
SCHEDULE II
RENAISSANCERE HOLDINGS LTD.
CONDENSED FINANCIAL INFORMATION OF REGISTRANT CONTINUED
RENAISSANCERE HOLDINGS LTD.
STATEMENTS OF CASH FLOWS
FOR THE YEARS ENDED DECEMBER 31, 2008, 2007 AND 2006
(PARENT COMPANY)
(THOUSANDS OF UNITED STATES DOLLARS)
| Year ended December 31, | ||||||||||||
| 2008 | 2007 | 2006 | ||||||||||
| Cash flows provided by (used in) operating activities: |
||||||||||||
| Net income |
$ | 29,020 | $ | 612,436 | $ | 797,110 | ||||||
| Less: equity in net income of subsidiaries |
66,079 | 774,057 | 829,315 | |||||||||
| (37,059 | ) | (161,621 | ) | (32,205 | ) | |||||||
| Adjustments to reconcile net income to net cash provided by (used in) operating activities |
||||||||||||
| Net unrealized losses included in net investment income |
17,020 | | | |||||||||
| Net unrealized losses (gains) included in other income |
3,866 | (5,780 | ) | 1,687 | ||||||||
| Equity in undistributed losses (earnings) of other ventures |
| 151,751 | (19,097 | ) | ||||||||
| Net realized losses |
3,877 | 182 | | |||||||||
| Other |
51,839 | 11,096 | 11,291 | |||||||||
| Net cash provided by (used in) operating activities |
39,543 | (4,372 | ) | (38,324 | ) | |||||||
| Cash flows provided by (used in) investing activities: |
||||||||||||
| Proceeds from maturities and sales of investments available for sale |
511,628 | 15,370 | | |||||||||
| Purchase of investments available for sale |
(494,683 | ) | (59,733 | ) | | |||||||
| Contributions to subsidiaries |
(233,560 | ) | (63,489 | ) | (93,312 | ) | ||||||
| Dividends from subsidiaries |
403,948 | 547,785 | 406,010 | |||||||||
| Net sales (purchases) of short term investments |
141,486 | 169,273 | (190,480 | ) | ||||||||
| Net (purchases) sales of other investments |
(25,900 | ) | 3,093 | | ||||||||
| Purchase of investments in other ventures |
| 12,262 | | |||||||||
| Due from subsidiary |
138,377 | (24,140 | ) | (132,360 | ) | |||||||
| Net cash provided by (used in) investing activities |
441,296 | 600,421 | (10,142 | ) | ||||||||
| Cash flows (used in) provided by financing activities: |
||||||||||||
| Dividends paid common shares |
(57,850 | ) | (62,595 | ) | (60,413 | ) | ||||||
| Dividends paid preference shares |
(42,300 | ) | (42,861 | ) | (34,650 | ) | ||||||
| RenaissanceRe common share repurchase |
(428,406 | ) | (200,171 | ) | | |||||||
| Redemption of 7.0% Senior Notes |
(150,000 | ) | | | ||||||||
| Redemption of Series A preference shares |
| (150,000 | ) | | ||||||||
| Repayment of debt |
| | (150,000 | ) | ||||||||
| Issuance of debt |
150,000 | | | |||||||||
| Repayment of subordinated obligation to Capital Trust |
| (103,093 | ) | | ||||||||
| Issuance of Preference Shares, net of expenses |
| | 291,127 | |||||||||
| Third party DaVinciRe share repurchase |
43,549 | (40,000 | ) | | ||||||||
| Net cash (used in) provided by financing activities |
(485,007 | ) | (598,720 | ) | 46,064 | |||||||
| Net decrease in cash and cash equivalents |
(4,168 | ) | (2.671 | ) | (2,402 | ) | ||||||
| Cash and cash equivalents, beginning of year |
9,290 | 11,961 | 14,363 | |||||||||
| Cash and cash equivalents, end of year |
$ | 5,122 | $ | 9,290 | $ | 11,961 | ||||||
S-6
Table of Contents
RENAISSANCERE HOLDINGS LTD. AND SUBSIDIARIES
SUPPLEMENTARY INSURANCE INFORMATION
(THOUSANDS OF UNITED STATES DOLLARS)
| December 31, 2008 | Year ended December 31, 2008 | ||||||||||||||||||||||||||
| Deferred Policy Acquisition Costs |
Future Policy Benefits, Losses and Claims and Claims Premiums Expenses |
Unearned Premiums |
Premium Revenue |
Net Investment Income |
Benefits, Claims, Losses and Expenses |
Amortization of Deferred Policy Settlement Costs |
Other Acquisition Expenses |
Net Written Premiums |
|||||||||||||||||||
| Reinsurance |
$ | 44,855 | $ | 1,497,819 | $ | 313,374 | $ | 909,759 | $ | | $ | 440,900 | $ | 105,437 | $ | 81,797 | $ | 871,893 | |||||||||
| Individual Risk |
37,049 | 662,793 | 196,861 | 477,065 | | 319,589 | 108,116 | 40,368 | 481,727 | ||||||||||||||||||
| Other |
| | | | 24,231 | | | | | ||||||||||||||||||
| Total |
$ | 81,904 | $ | 2,160,612 | $ | 510,235 | $ | 1,386,824 | $ | 24,231 | $ | 760,489 | $ | 213,553 | $ | 122,165 | $ | 1,353,620 | |||||||||
| December 31, 2007 | Year ended December 31, 2007 | ||||||||||||||||||||||||||
| Deferred Policy Acquisition Costs |
Future Policy Benefits, Losses and Claims and Claims Premiums Expenses |
Unearned Premiums |
Premium Revenue |
Net Investment Income |
Benefits, Claims, Losses and Expenses |
Amortization of Deferred Policy Settlement Costs |
Other Acquisition Expenses |
Net Written Premiums |
|||||||||||||||||||
| Reinsurance |
$ | 57,596 | $ | 1,418,727 | $ | 352,822 | $ | 957,661 | $ | | $ | 241,118 | $ | 119,915 | $ | 67,969 | $ | 1,024,493 | |||||||||
| Individual Risk |
46,616 | 609,769 | 210,514 | 466,708 | | 238,156 | 135,015 | 42,495 | 410,842 | ||||||||||||||||||
| Other |
| | | | 402,463 | | | | | ||||||||||||||||||
| Total |
$ | 104,212 | $ | 2,028,496 | $ | 563,336 | $ | 1,424,369 | $ | 402,463 | $ | 479,274 | $ | 254,930 | $ | 110,464 | $ | 1,435,335 | |||||||||
| December 31, 2006 | Year ended December 31, 2006 | ||||||||||||||||||||||||||
| Deferred Policy Acquisition Costs |
Future Policy Benefits, Losses and Claims and Claims Premiums Expenses |
Unearned Premiums |
Premium Revenue |
Net Investment Income |
Benefits, Claims, Losses and Expenses |
Amortization of Deferred Policy Settlement Costs |
Other Acquisition Expenses |
Net Written Premiums |
|||||||||||||||||||
| Reinsurance |
$ | 37,583 | $ | 1,469,251 | $ | 286,410 | $ | 972,017 | $ | | $ | 148,052 | $ | 115,324 | $ | 72,405 | $ | 1,039,103 | |||||||||
| Individual Risk |
69,335 | 628,904 | 292,014 | 557,760 | | 298,178 | 165,373 | 37,181 | 490,517 | ||||||||||||||||||
| Other |
| | | | 318,106 | | | | | ||||||||||||||||||
| Total |
$ | 106,918 | $ | 2,098,155 | $ | 578,424 | $ | 1,529,777 | $ | 318,106 | $ | 446,230 | $ | 280,697 | $ | 109,586 | $ | 1,529,620 | |||||||||
S-7
Table of Contents
RENAISSANCERE HOLDINGS LTD. AND SUBSIDIARIES
REINSURANCE
(THOUSANDS OF UNITED STATES DOLLARS)
| Gross Amounts |
Ceded to Other Companies |
Assumed From Other Companies |
Net Amount | Percentage of Amount Assumed to Net |
|||||||||||
| Year ended December 31, 2008 |
|||||||||||||||
| Property and liability premiums written |
$ | 489,866 | $ | 382,408 | $ | 1,246,162 | $ | 1,353,620 | 92 | % | |||||
| Year ended December 31, 2007 |
|||||||||||||||
| Property and liability premiums written |
$ | 416,642 | $ | 374,302 | $ | 1,392,995 | $ | 1,435,335 | 97 | % | |||||
| Year ended December 31, 2006 |
|||||||||||||||
| Property and liability premiums written |
$ | 451,325 | $ | 414,027 | $ | 1,492,322 | $ | 1,529,620 | 98 | % | |||||
S-8
Table of Contents
RENAISSANCERE HOLDINGS LTD. AND SUBSIDIARIES
SUPPLEMENTARY INSURANCE INFORMATION CONCERNING
PROPERTY/CASUALTY INSURANCE OPERATIONS
(THOUSANDS OF UNITED STATES DOLLARS)
| Affiliation with Registrant |
Deferred Policy Acquisition Costs |
Reserve for Unpaid Claims and Claim Expenses |
Discount, if any, deducted |
Unearned Premiums |
Earned Premiums |
Net Investment Income |
||||||||||||
| Consolidated Subsidiaries |
||||||||||||||||||
| Year ended December 31, 2008 |
$ | 81,904 | $ | 2,160,612 | $ | | $ | 510,235 | $ | 1,386,824 | $ | 24,231 | ||||||
| Year ended December 31, 2007 |
$ | 104,212 | $ | 2,028,496 | $ | | $ | 563,336 | $ | 1,424,369 | $ | 402,463 | ||||||
| Year ended December 31, 2006 |
$ | 106,918 | $ | 2,098,155 | $ | | $ | 578,424 | $ | 1,529,777 | $ | 318,106 | ||||||
|
Claims and Claim Expense Incurred Related to |
Amortization of Deferred Policy Acquisition Costs |
Paid Claims and Claim Expenses |
Net Premiums Written |
|||||||||||||
| Affiliation with Registrant |
Current Year | Prior Year | ||||||||||||||
| Consolidated Subsidiaries |
||||||||||||||||
| Year ended December 31, 2008 |
$ | 995,316 | $ | (234,827 | ) | $ | 213,553 | $ | 744,632 | $ | 1,353,620 | |||||
| Year ended December 31, 2007 |
$ | 712,424 | $ | (233,150 | ) | $ | 254,930 | $ | 430,354 | $ | 1,435,335 | |||||
| Year ended December 31, 2006 |
$ | 582,788 | $ | (136,558 | ) | $ | 280,697 | $ | 591,290 | $ | 1,529,620 | |||||
S-9
Table of Contents
UNITED STATES
SECURITIES AND EXCHANGE COMMISSION
WASHINGTON, D.C. 20549
EXHIBITS
TO
FORM 10-K
Annual Report pursuant to Section 13 or 15(d) of the Securities Exchange Act of 1934 for the fiscal year ended December 31, 2008.
RenaissanceRe Holdings Ltd.
Table of Contents
| Exhibits |
||
| 1. | The Consolidated Financial Statements of RenaissanceRe Holdings Ltd. and related Notes thereto are listed in the accompanying Index to Consolidated Financial Statements and are filed as part of this Form 10-K. | |
| 2. | The Schedules to the Consolidated Financial Statements of RenaissanceRe Holdings Ltd. are listed in the accompanying Index to Schedules to Consolidated Financial Statements and are filed as a part of this Form 10-K. | |
| 3. | Exhibits | |
| 3.1 | Memorandum of Association.(1) | |
| 3.2 | Amended and Restated Bye-Laws.(2) | |
| 3.3 | Memorandum of Increase in Share Capital of RenaissanceRe Holdings Ltd.(3) | |
| 3.4 | Specimen Common Share certificate.(1) | |
| 10.1 | Form of Director Retention Agreement, dated as of November 8, 2002, entered into by each of the non-employee directors of RenaissanceRe Holdings Ltd.(4) | |
| 10.2 | Amended and Restated Employment Agreement, dated as of February 22, 2006, between RenaissanceRe Holdings Ltd. and Neill A. Currie.(5) | |
| 10.3 | Amendment No. 1, dated as of March 1, 2007, to the Employment Agreement, dated as of February 22, 2006 by and between RenaissanceRe Holdings Ltd. and Neill A. Currie.(6) | |
| 10.4 | Amendment No. 2, dated as of November 19, 2008, between RenaissanceRe Holdings Ltd. and Neill A. Currie.(7) | |
| 10.5 | Employment Agreement, dated as of July 19, 2006, between RenaissanceRe Holdings Ltd. and Fred R. Donner.(8) | |
| 10.6 | Amended and Restated Employment Agreement, dated as of July 19, 2006, between RenaissanceRe Holdings Ltd. and William I. Riker.(8) | |
| 10.7 | Transition Services Agreement dated as of July 18, 2007 between RenaissanceRe Holdings Ltd. and William I. Riker.(9) | |
| 10.8 | Amended and Restated Employment Agreement, dated as of July 19, 2006, between RenaissanceRe Holdings Ltd. and John D. Nichols, Jr.(8) | |
| 10.9 | Sublease Agreement, dated as of July 19, 2006, between Renaissance Reinsurance Ltd. and John D. Nichols, Jr.(8) | |
| 10.10 | Form of Employment Agreement for Executive Officers.(8) | |
| 10.11 | Form of Amendment to Employment Agreement for Executive Officers.(10) | |
| 10.12 | Form of Amendment to Employment Agreement for Executive Officers.(7) | |
| 10.13 | Sixth Amended and Restated Employment Agreement, dated as of May 19, 2004, between RenaissanceRe Holdings Ltd. and James N. Stanard.(11) | |
| 10.14 | Second Amended and Restated Credit Agreement, dated as of August 6, 2004, among RenaissanceRe Holdings Ltd., the Lenders named therein, Deutsche Bank AG New York Branch, as LC Issuer and Co-Documentation Agent, HSBC Bank U.S., National Association, as Co-Documentation Agent, Citibank, N.A. and Wachovia Bank, National Association, as Co-Syndication Agents, Bank of America, N.A., as Administrative Agent and Bank of America Securities LLC, as Sole Lead Arranger and Sole Book Manager.(12) | |
| 10.15 | First Amendment Agreement, dated as of August 11, 2005, among RenaissanceRe Holdings Ltd., the Lenders named therein, Deutsche Bank AG New York Branch, as LC Issuer and Bank of America, National Association, as Administrative Agent for the Lenders.(13) | |
Table of Contents
| 10.16 | Second Amendment Agreement to Second Amended and Restated Credit Agreement, dated as of May 19, 2006, among RenaissanceRe Holdings Ltd., the lenders named therein, Deutsche Bank AG New York Branch, as LC Issuer and Bank of America, National Association, as Administrative Agent for the Lenders.(14) | |
| 10.17 | Third Amendment, dated as of June 18, 2007, to Second Amended and Restated Credit Agreement, dated as of August 6, 2004, among RenaissanceRe Holdings Ltd., the lenders named therein, Deutsche Bank AG New York Branch, as LC Issuer and Bank of America, National Association as Administrative Agent for the Lenders.(15) | |
| 10.18 | Fourth Amendment, dated as of September 6, 2007, to Second Amended and Restated Credit Agreement, dated as of August 6, 2004, among RenaissanceRe Holdings Ltd., the lenders named therein, Deutsche Bank AG New York Branch, as LC Issuer and Bank of America, National Association as Administrative Agent for the Lenders.(16) | |
| 10.19 | Third Amended and Restated Credit Agreement, dated as of April 5, 2006, by and among DaVinciRe Holdings Ltd., the banks, financial institutions and other institutional lenders listed thereto (the Lenders), Citigroup Global Markets Inc., as sole lead arranger, book manager and syndication agent, and Citibank, N.A. as administrative agent for the Lenders.(17) | |
| 10.20 | RenaissanceRe Holdings Ltd. Second Amended and Restated 1993 Stock Incentive Plan.(18) | |
| 10.21 | RenaissanceRe Holdings Ltd. 2001 Stock Incentive Plan.(19) | |
| 10.22 | Amendment No. 1 to the RenaissanceRe Holdings Ltd. 2001 Stock Incentive Plan.(20) | |
| 10.23 | Amendment No. 2 to the RenaissanceRe Holdings Ltd. 2001 Stock Incentive Plan.(20) | |
| 10.24 | Form of Option Grant Notice and Agreement pursuant to which option grants are made under the RenaissanceRe Holdings Ltd. 2001 Stock Incentive Plan.(12) | |
| 10.25 | Form of Restricted Stock Grant Notice and Agreement pursuant to which Restricted Stock grants are made under the RenaissanceRe Holdings Ltd. 2001 Stock Incentive Plan.(12) | |
| 10.26 | RenaissanceRe Holdings Ltd. 2004 Stock Option Incentive Plan.(21) | |
| 10.27 | Amendment No. 1 to the RenaissanceRe Holdings Ltd. 2004 Stock Option Incentive Plan.(22) | |
| 10.28 | Form of Option Agreement pursuant to which option grants are made under the RenaissanceRe Holdings 2004 Stock Option Incentive Plan to executive officers.(21) | |
| 10.29 | Amended and Restated RenaissanceRe Holdings Ltd. Non-Employee Director Stock Plan.(23) | |
| 10.30 | Amendment No. 1 to the RenaissanceRe Holdings Ltd. Non-Employee Director Stock Plan.(24) | |
| 10.31 | Amendment No. 2 to the RenaissanceRe Holdings Ltd. Non-Employee Director Stock Plan.(25) | |
| 10.32 | Amendment No. 3 to the RenaissanceRe Holdings Ltd. Non-Employee Director Stock Plan. | |
| 10.33 | Form of Restricted Stock Grant Agreement for Directors.(5) | |
| 10.34 | Form of Option Grant Agreement for Directors.(5) | |
| 10.35 | Master Standby Letter of Credit Reimbursement Agreement, dated as of November 2, 2001, between Renaissance Reinsurance Ltd. and Fleet National Bank. Glencoe Insurance Ltd. and Timicuan Reinsurance Ltd. have each become a party to this agreement pursuant to an accession agreement, and DaVinci Reinsurance Ltd. has entered in a substantially similar agreement with Fleet National Bank.(26) | |
| 10.36 | Certificate of Designation, Preferences and Rights of 7.30% Series B Preference Shares.(27) | |
| 10.37 | Certificate of Designation, Preferences and Rights of 6.08% Series C Preference Shares.(28) | |
| 10.38 | Certificate of Designation, Preferences and Rights of 6.60% Series D Preference Shares.(29) | |
| 10.39 | Senior Indenture, dated as of July 1, 2001, between RenaissanceRe Holdings Ltd., as Issuer, and Bankers Trust Company, as Trustee.(30) | |
Table of Contents
| 10.40 | Second Supplemental Indenture, by and between RenaissanceRe Holdings Ltd. and Deutsche Bank Trust Company Americas (f/k/a Bankers Trust Company), dated as of January 31, 2003.(31) | |
| 10.41 | Second Amended and Restated Reimbursement Agreement, dated as of April 27, 2007, by and among Renaissance Reinsurance Ltd., Renaissance Reinsurance of Europe, Glencoe Insurance Ltd., DaVinci Reinsurance Ltd., RenaissanceRe Holdings Ltd., Wachovia Bank, National Association, as Issuing Bank, Administrative Agent, and Collateral Agent for the Lenders, certain Co-Syndication Agents, ING Bank N.V., as Documentation Agent, and certain Lenders party thereto.(32) | |
| 21.1 | List of Subsidiaries of the Registrant. | |
| 23.1 | Consent of Ernst & Young Ltd. | |
| 31.1 | Certification of Neill A. Currie, Chief Executive Officer of RenaissanceRe Holdings Ltd., pursuant to Rule 13a-14(a) or Rule 15d-14(a) of the Securities Exchange Act of 1934, as amended. | |
| 31.2 | Certification of Fred R. Donner, Chief Financial Officer of RenaissanceRe Holdings Ltd., pursuant to Rule 13a-14(a) or Rule 15d-14(a) of the Securities Exchange Act of 1934, as amended. | |
| 32.1 | Certification of Neill A. Currie, Chief Executive Officer of RenaissanceRe Holdings Ltd., pursuant to 18 U.S.C. Section 1350, as adopted pursuant to Section 906 of the Sarbanes-Oxley Act of 2002. | |
| 32.2 | Certification of Fred R. Donner, Chief Financial Officer of RenaissanceRe Holdings Ltd., pursuant to 18 U.S.C. Section 1350, as adopted pursuant to Section 906 of the Sarbanes-Oxley Act of 2002. | |
| (1) | Incorporated by reference to the Registration Statement on Form S-1 of RenaissanceRe Holdings Ltd. (Registration No. 33-70008) which was declared effective by the SEC on July 26, 1995. |
| (2) | Incorporated by reference to RenaissanceRe Holdings Ltd.s Quarterly Report on Form 10-Q for the period ended June 30, 2002, filed with the SEC on August 14, 2002. |
| (3) | Incorporated by reference to RenaissanceRe Holdings Ltd.s Quarterly Report on Form 10-Q for the period ended March 31, 1998, filed with the SEC on May 14, 1998 (SEC File Number 000-26512) |
| (4) | Incorporated by reference to RenaissanceRe Holdings Ltd.s Annual Report on Form 10-K for the year ended December 31, 2002, filed with the SEC on March 31, 2003 (SEC File Number 001-14428) |
| (5) | Incorporated by reference to RenaissanceRe Holdings Ltd.s Current Report on Form 8-K, filed with the SEC on February 27, 2006 |
| (6) | Incorporated by reference to RenaissanceRe Holdings Ltd.s Quarterly Report on Form 10-Q for the period ended March 31, 2007, filed with the SEC on May 2, 2007. |
| (7) | Incorporated by reference to RenaissanceRe Holdings Ltd.s Current Report on Form 8-K, filed with the SEC on November 25, 2008. |
| (8) | Incorporated by reference to RenaissanceRe Holdings Ltd.s Current Report on Form 8-K, filed with the SEC on July 21, 2006, relating to certain events which occurred on July 19, 2006. Other than with respect to the Percent and Lump Sum Percent (as defined and disclosed in the Form 8-K) and matters such as names and titles, the employment agreements for Messrs. ODonnell and Ashley are identical to the form filed as Exhibit 10.9. |
| (9) | Incorporated by reference to RenaissanceRe Holdings Ltd.s Current Report on Form 8-K, filed with the SEC on July 20, 2007. |
| (10) | Incorporated by reference to RenaissanceRe Holdings Ltd.s Quarterly Report on Form 10-Q for the period ended March 31, 2008, filed with the SEC on May 2, 2008. |
| (11) | Incorporated by reference to RenaissanceRe Holdings Ltd.s Quarterly Report on Form 10-Q for the period ended June 30, 2004, filed with the SEC on August 9, 2004. |
| (12) | Incorporated by reference to RenaissanceRe Holdings Ltd.s Quarterly Report on Form 10-Q for the period ended September 30, 2004, filed with the SEC on November 9, 2004. |
Table of Contents
| (13) | Incorporated by reference to RenaissanceRe Holdings Ltd.s Annual Report on Form 10-K for the year ended December 31, 2005, filed with the SEC on March 3, 2006 (SEC File Number 001-14428). |
| (14) | Incorporated by reference to RenaissanceRe Holdings Ltd.s Quarterly Report on Form 10-Q for the period ended June 30, 2006, filed with the SEC on August 2, 2006 (SEC File Number 001-14428). |
| (15) | Incorporated by reference to RenaissanceRe Holdings Ltd.s Current Report on Form 8-K, filed with the SEC on June 29, 2007. |
| (16) | Incorporated by reference to RenaissanceRe Holdings Ltd.s Quarterly Report on Form 10-Q for the period ended September 30, 2007, filed with the SEC on October 31, 2007 (SEC File Number 001-14428). |
| (17) | Incorporated by reference to RenaissanceRe Holdings Ltd.s Current Report on Form 8-K, filed with the SEC on April 11, 2006, relating to certain events which occurred on April 5, 2006. |
| (18) | Incorporated by reference to Exhibit 99.3 to the Registration Statement on Form S-8 (Registration No. 333-90758) dated June 19, 2002. |
| (19) | Incorporated by reference to Exhibit 99.2 to the Registration Statement on Form S-8 (Registration No. 333-90758) dated June 19, 2002. |
| (20) | Incorporated by reference to RenaissanceRe Holdings Ltd.s Quarterly Report on Form 10-Q for the period ended March 31, 2007, filed with the SEC on May 2, 2007. |
| (21) | Incorporated by reference to RenaissanceRe Holdings Ltd.s Current Report on Form 8-K, filed with the SEC on September 2, 2004. |
| (22) | Incorporated by reference to RenaissanceRe Holdings Ltd.s Annual Report on Form 10-K for the year ended December 31, 2004, filed with the SEC on March 31, 2005 (SEC File Number 001-14428). |
| (23) | Incorporated by reference to Exhibit 99.1 to the Registration Statement on Form S-8 (Registration No. 333-90758) dated June 19, 2002. |
| (24) | Incorporated by reference to RenaissanceRe Holdings Ltd.s Quarterly Report on Form 10-Q for the period ended March 31, 2007, filed with the SEC on May 2, 2007. |
| (25) | Incorporated by reference to RenaissanceRe Holdings Ltd.s Quarterly Report on Form 10-Q for the period ended September 30, 2008, filed with the SEC on October 30, 2008. |
| (26) | Incorporated by reference to RenaissanceRe Holdings Ltd.s Annual Report on Form 10-K for the year ended December 31, 2001 filed with the SEC on April 1, 2002. |
| (27) | Incorporated by reference to RenaissanceRe Holdings Ltd.s Current Report on Form 8-K, filed with the SEC on February 4, 2003, relating to certain events which occurred on January 30, 2003. |
| (28) | Incorporated by reference to RenaissanceRe Holdings Ltd.s Current Report on Form 8-K, filed with the SEC on March 18, 2004. |
| (29) | Incorporated by reference to RenaissanceRe Holdings Ltd.s Form 8-A, filed with the SEC on December 14, 2006. |
| (30) | Incorporated by reference to RenaissanceRe Holdings Ltd.s Current Report on Form 8-K, filed with the SEC on July 17, 2001, relating to certain events which occurred on July 12, 2001. |
| (31) | Incorporated by reference to RenaissanceRe Holdings Ltd.s Current Report on Form 8-K, filed with the SEC on January 31, 2003, relating to certain events which occurred on January 28, 2003. |
| (32) | Incorporated by reference to RenaissanceRe Holdings Ltd.s Current Report on Form 8-K, filed with the SEC on May 3, 2007. |